Cash Flow
Germany: Roughly Matches the DAX, -50% Max Drawdown
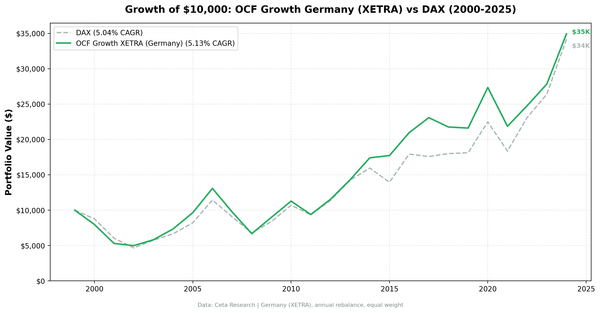
OCF momentum returned 5.1% annually on German stocks vs the DAX's 5.0%, essentially a match (+0.1%). A 36% win rate and a -50.2% max drawdown make it a rough ride for no edge.

Building CetaResearch. Data analysis for policy, research, and startups.

Cash Flow
OCF momentum returned 5.1% annually on German stocks vs the DAX's 5.0%, essentially a match (+0.1%). A 36% win rate and a -50.2% max drawdown make it a rough ride for no edge.
Cash Flow
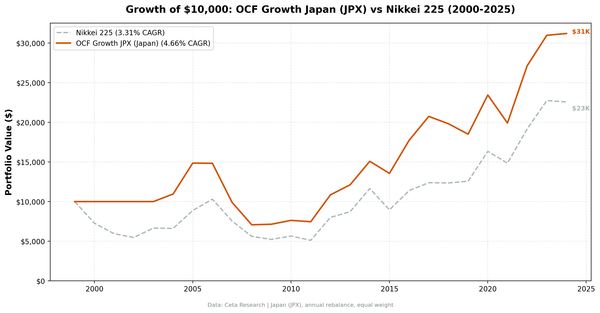
OCF momentum returned 4.7% annually on Japanese stocks vs the Nikkei 225's 3.3%, a +1.4% alpha. The signal now beats the Nikkei, with 4 of 25 cash periods and a -52% drawdown.
Cash Flow
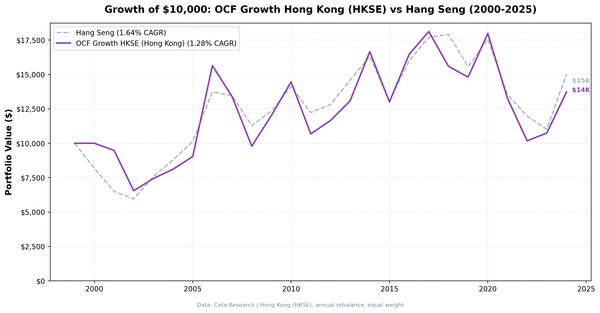
OCF momentum returned 1.3% annually on Hong Kong stocks vs the Hang Seng's 1.6%, slightly lagging by -0.4%. Sharpe -0.07, a -43.8% drawdown, and the highest volatility of any market (24.1%).
Cash Flow
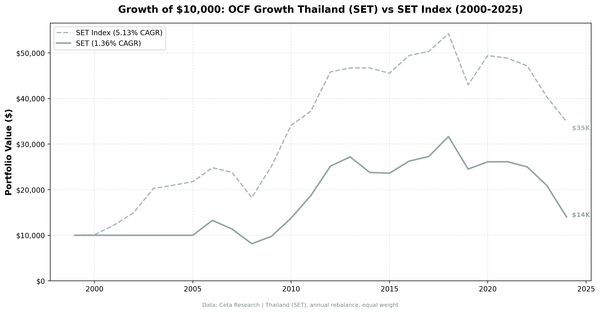
OCF momentum returned 1.4% annually on Thai stocks vs the SET Index's 5.1%, lagging by -3.8%, the worst of any market tested. Negative Sharpe (-0.06), -55.7% drawdown, 24% cash periods.
Cash Flow
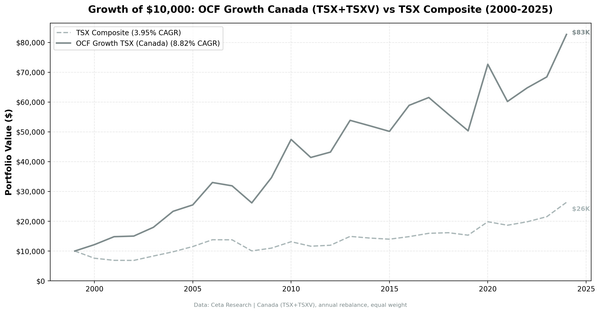
OCF momentum returned 8.8% annually on TSX stocks, 2000-2025, vs 4.0% for the TSX Composite, a +4.9% alpha. $10,000 to $82,715. Zero cash periods, 52% win rate, -20.7% max drawdown.
Cash Flow
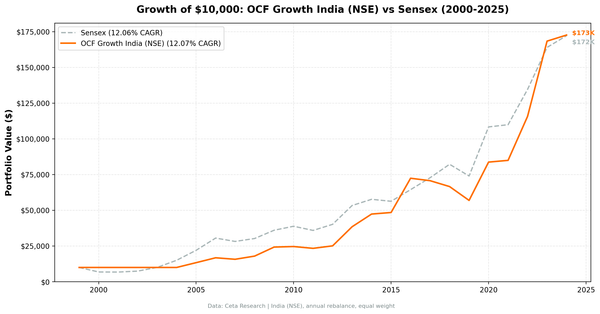
Operating cash flow momentum returned 12.1% annually on NSE stocks from 2000-2025, matching the Sensex. Max drawdown: -21.4% vs Sensex's -32.2%, beta 0.58. $10,000 to $172,659.
Cash Flow
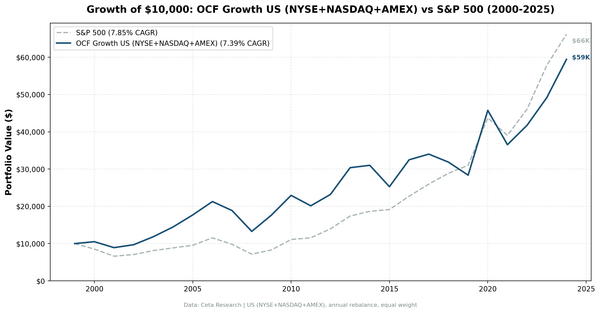
We tested a cash flow quality screen on 25 years of US stock data. The strategy matched the S&P 500 at 7.4% vs 7.9%, with a positive excess every year during the dot-com bust (+19.8% in 2000) but struggling 2017-2019.
Cash Flow
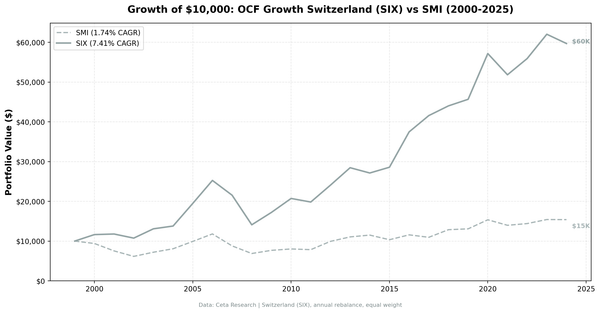
OCF momentum returned 7.4% annually on Swiss stocks vs the SMI's 1.7%, a +5.7% alpha, the strongest of all markets. Sharpe 0.41, a 68% win rate (the highest tested), -44.2% drawdown.
Cash Flow
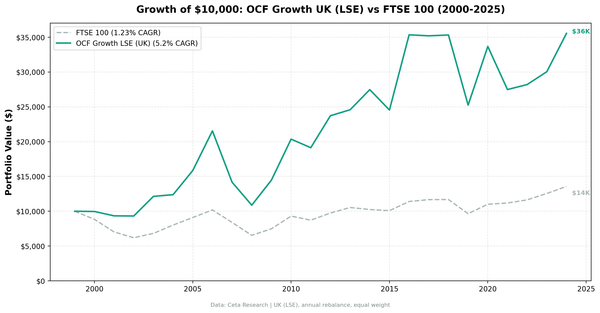
OCF momentum returned 5.2% annually on UK stocks vs the FTSE 100's 1.2%, a +4.0% alpha. A 60% win rate and a deep -49.5% drawdown make it volatile, but the signal works.
value investing
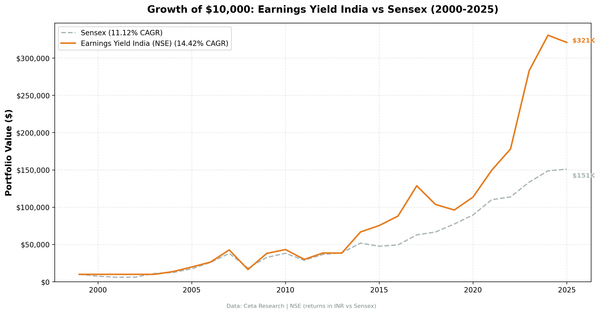
Earnings yield screening on NSE returned 14.42% CAGR vs 11.12% for the Sensex. +3.30% annual excess with 57.3% quarterly win rate. Returns in INR, max drawdown -61.4%.
quality investing
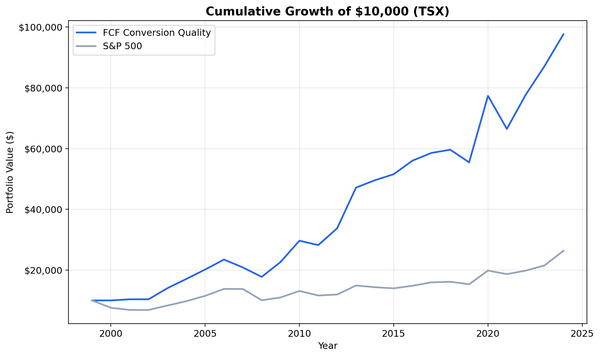
FCF Conversion on TSX stocks returned 9.54% CAGR from 2000-2025 vs the TSX Composite's 3.95%. 76% win rate, the highest of any exchange. $10K grew to $98K vs $26K for the index.
quality investing
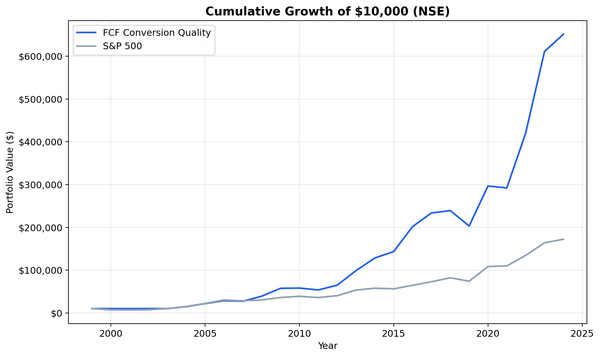
We ran our FCF Conversion screen on BSE and NSE stocks from 2000-2025. 18.18% CAGR in INR, 6.13% annual excess over the Sensex (12.06% CAGR). Max drawdown of just -15% vs the Sensex's -32%. $10K grew to $651K.