
Hong Kong: Slightly Lags the Hang Seng, Negative Sharpe
OCF momentum returned 1.3% annually on Hong Kong stocks vs the Hang Seng's 1.6%, slightly lagging by -0.4%. Sharpe -0.07, a -43.8% drawdown, and the highest volatility of any market (24.1%).

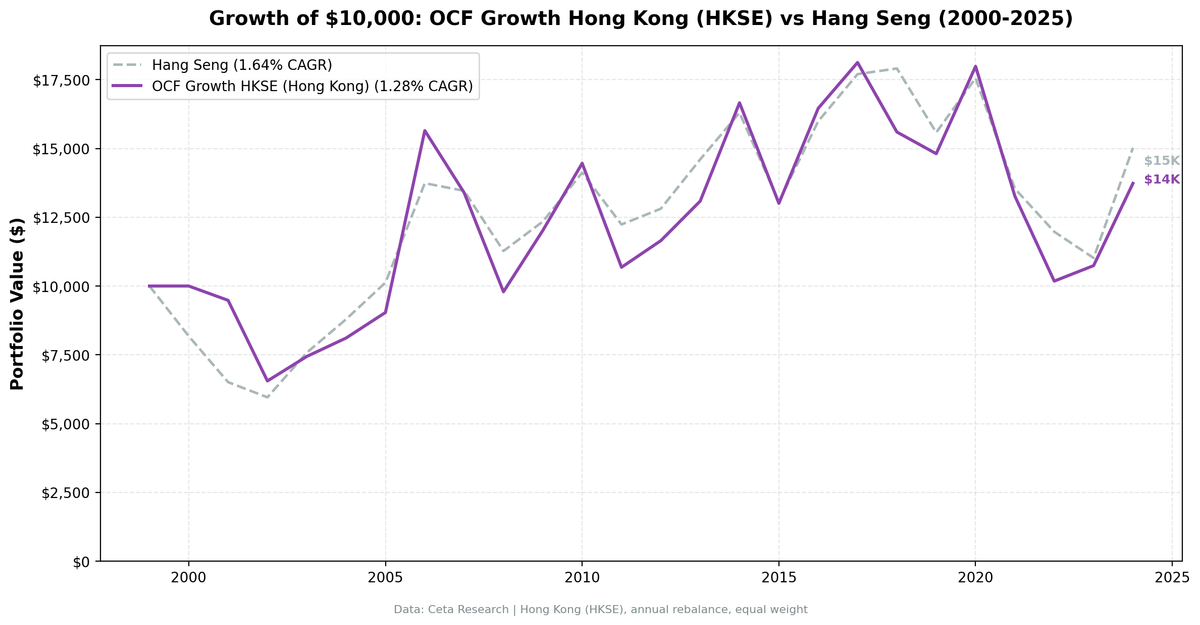
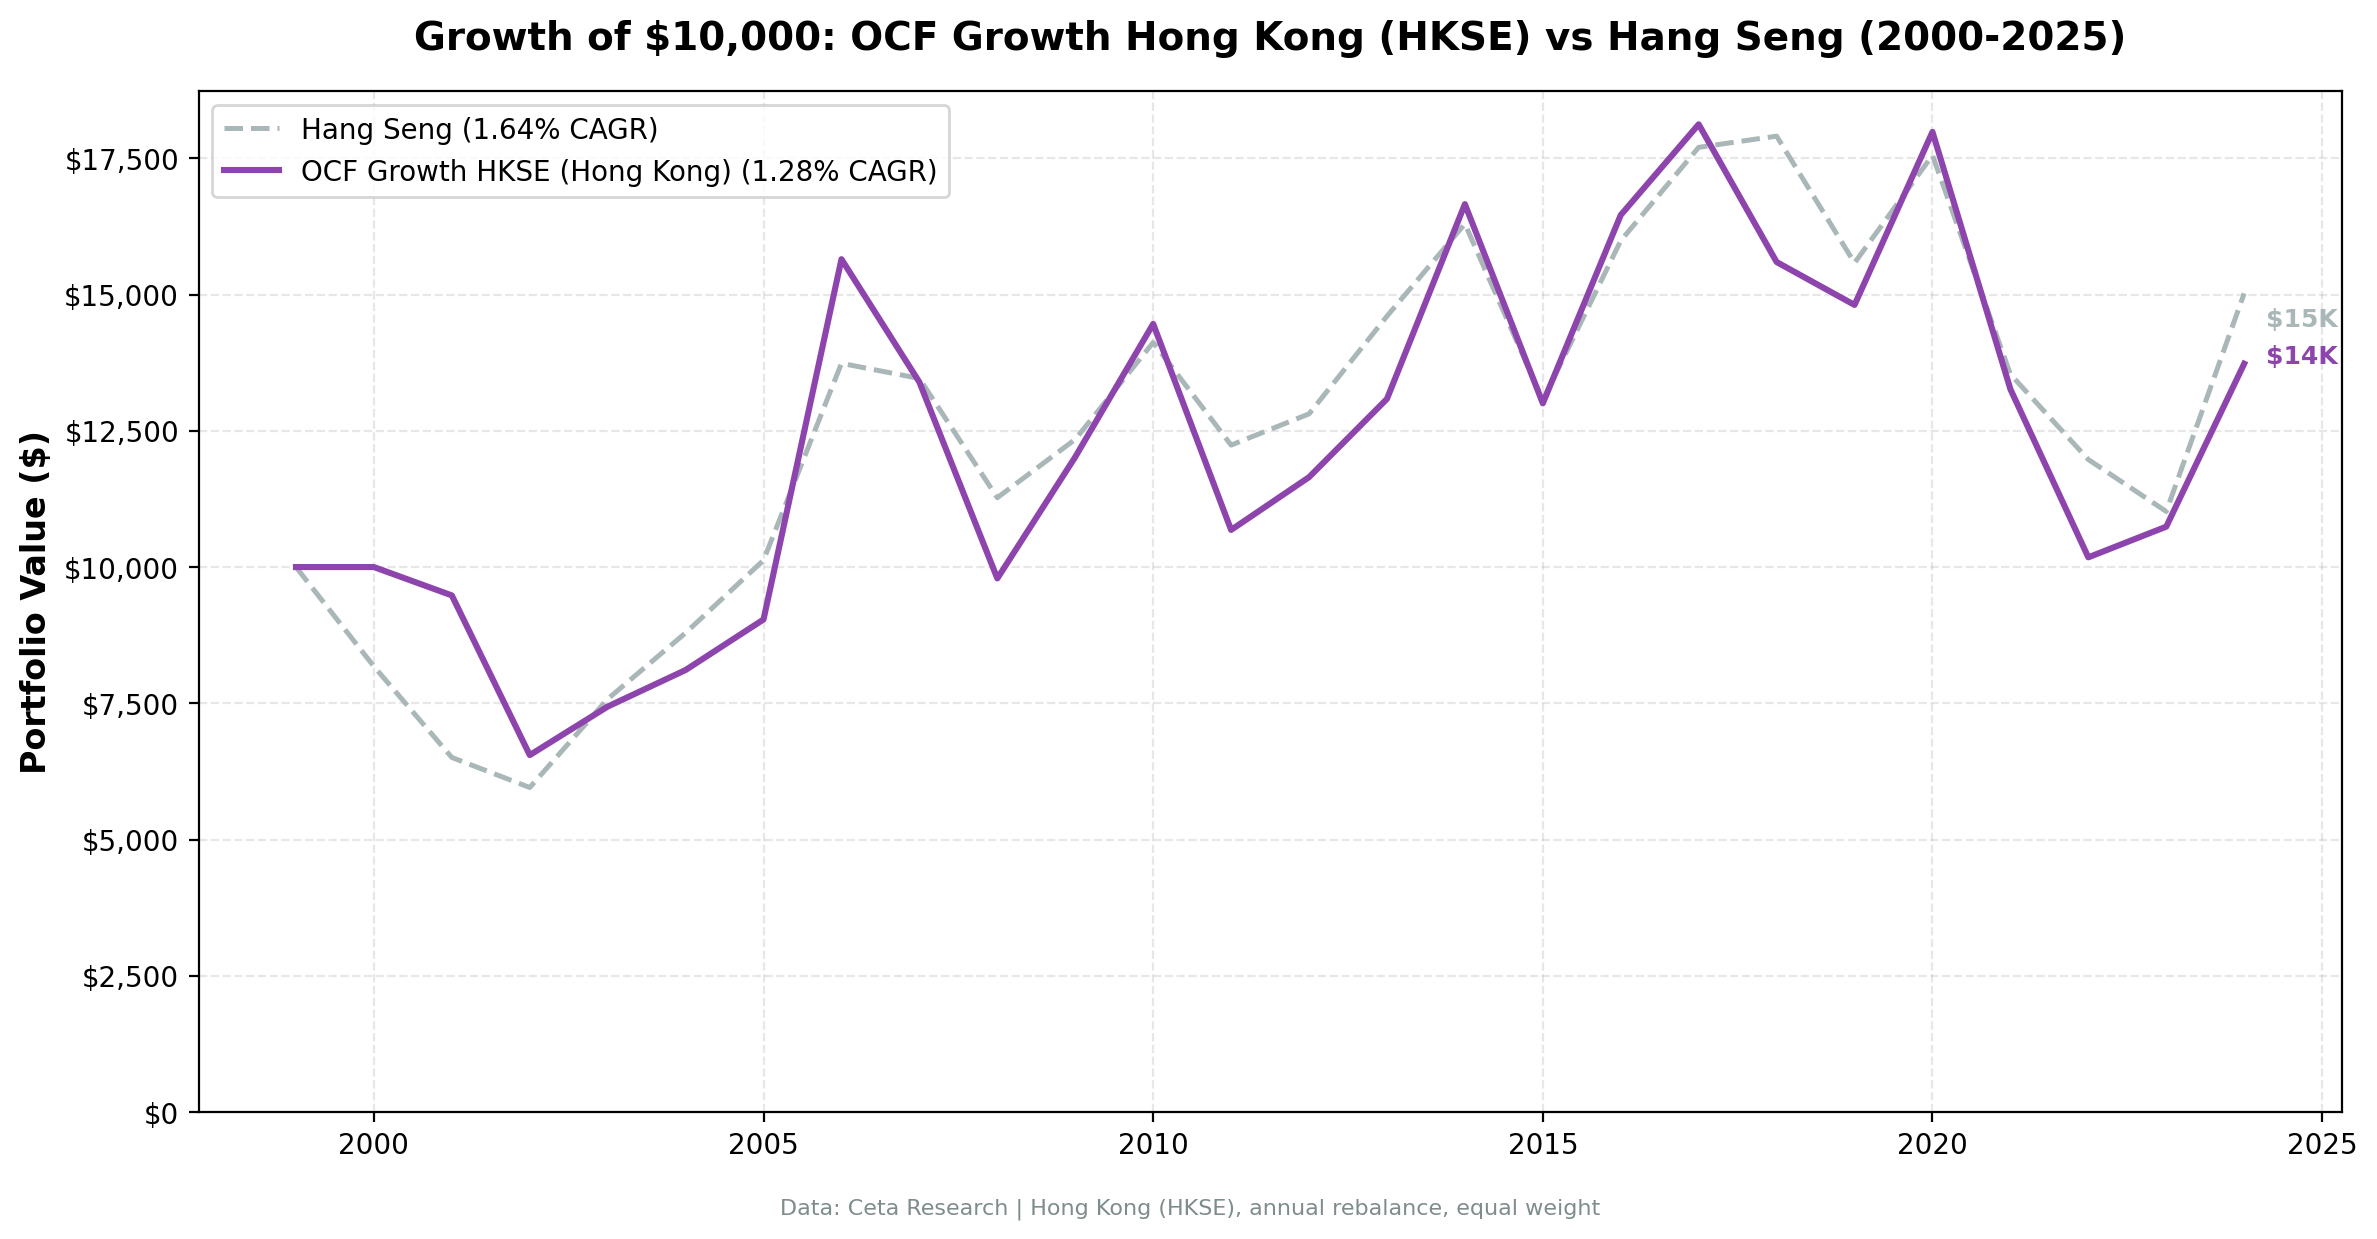
OCF momentum returned 1.3% annually on Hong Kong stocks, 2000-2025, trailing the Hang Seng by 0.4% per year. The Hang Seng returned 1.6% annually. $10,000 grew to $13,733 vs the Hang Seng's $15,022. The strategy was nearly fully invested (24 of 25 years), holding 17 stocks on average, but suffered a -44% max drawdown with a negative Sharpe. The quality screen found no edge over a stagnant Hang Seng: this is one of the markets where the signal does not work.
Contents
Data: FMP financial data warehouse, 2000–2025. Updated June 2026.
What We Found
| Metric | Hong Kong (HKSE) | Hang Seng |
|---|---|---|
| CAGR | 1.3% | 1.6% |
| Volatility | 24.1% | - |
| Max Drawdown | -43.8% | -40.5% |
| Sharpe | -0.07 | - |
| Cash Periods | 1 of 25 | - |
| Win Rate (vs Hang Seng) | 44% | - |
A negative Sharpe means the strategy didn't beat cash after adjusting for volatility. The high volatility (24.1%, the highest among all markets tested) came from Hong Kong's exposure to China macro risk, real estate cycles, and geopolitical shocks.
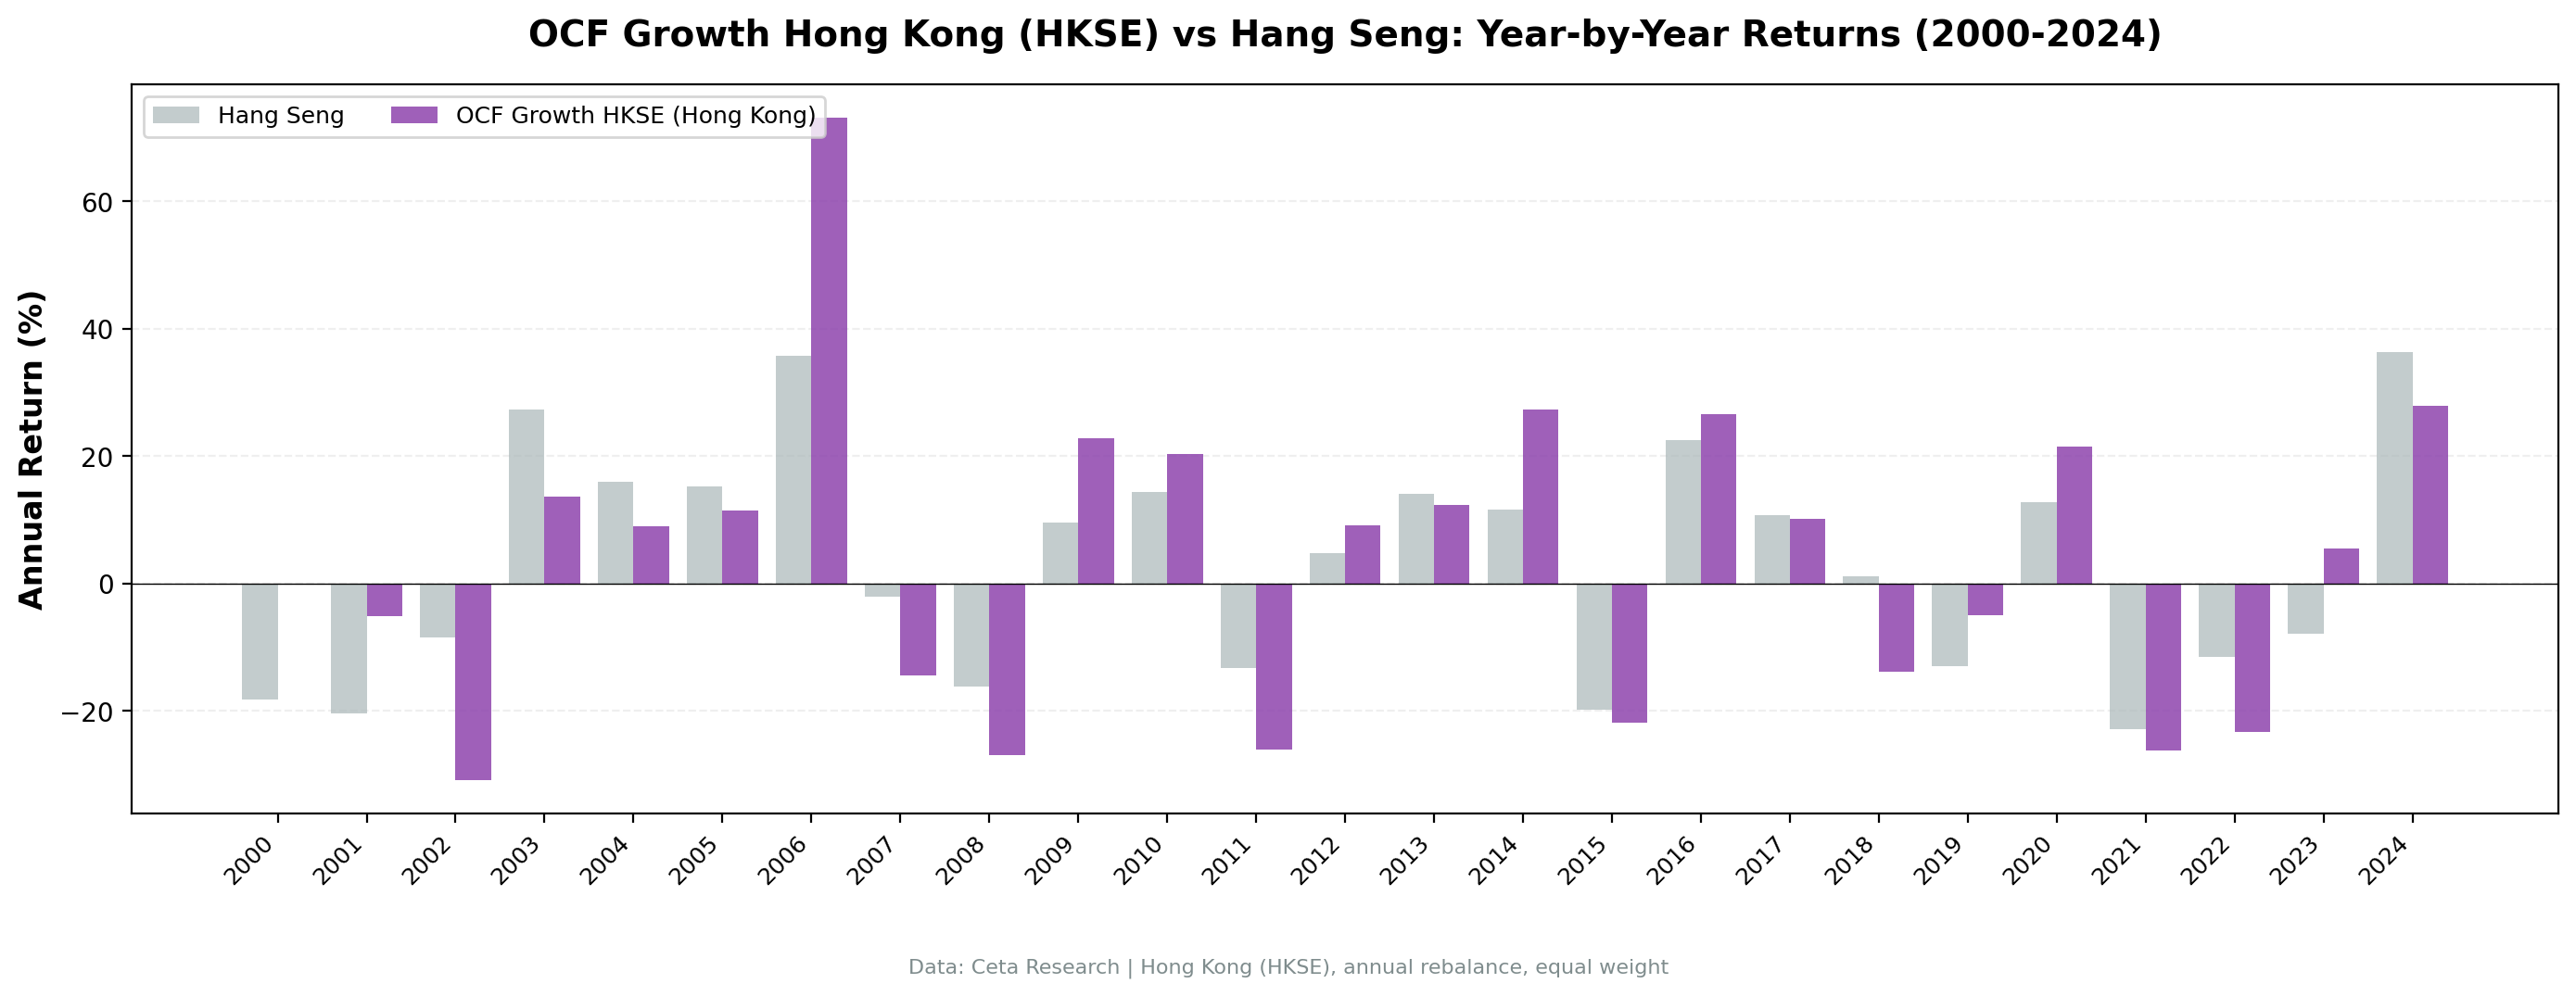
Best year: 2006 (+73.1%). Worst year: 2002 (-30.9%). The strategy beat the Hang Seng in only 11 of 25 years (44% win rate), and the Hang Seng itself barely moved over the period.
Why it fails: Hong Kong companies are often holding structures for Chinese assets. Operating cash flow at the HoldCo level doesn't reflect operating business quality. The divergence signal picks up financial engineering, not genuine cash generation.
Part of a Series: US Results | India: matches the Sensex, lower drawdown | Canada: +4.9% alpha over the TSX | Global Comparison
Run It Yourself
Screen Hong Kong stocks with OCF momentum on Ceta Research
Market cap threshold: HK$2B (~$256M USD), ROE > 10%, operating margin > 5%, OCF growth > NI growth.
Takeaway: Hong Kong shows OCF divergence fails when listed companies are holding structures rather than operating businesses. The signal needs clean financial statements, not complex cross-border structures. Over 25 years it slightly lagged a Hang Seng that went almost nowhere, with a negative Sharpe to show for the volatility.
Data: Ceta Research, HKSE 2000-2025. Full methodology: backtests/METHODOLOGY.md
Past performance does not guarantee future results. This is educational content, not investment advice.

