
FCF Conversion Quality on Canadian Stocks: 76% Win Rate and +5.59% Alpha vs TSX Composite
FCF Conversion on TSX stocks returned 9.54% CAGR from 2000-2025 vs the TSX Composite's 3.95%. 76% win rate, the highest of any exchange. $10K grew to $98K vs $26K for the index.

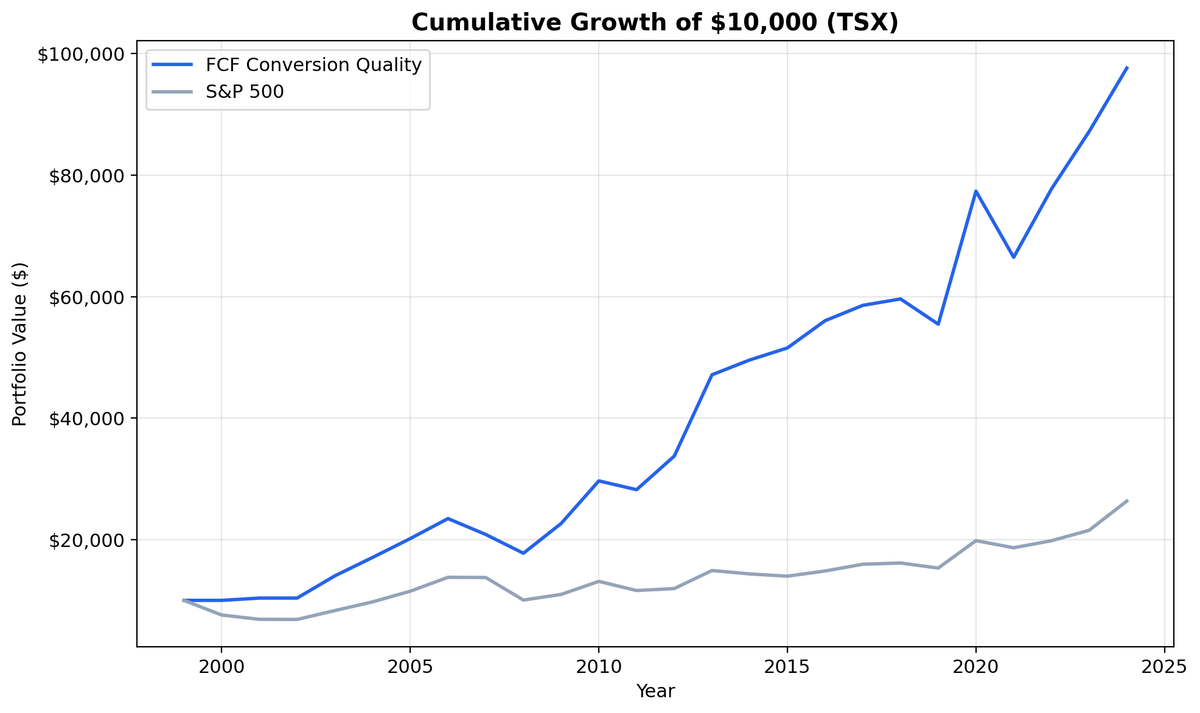
Canada's FCF Conversion results won't grab headlines on raw CAGR alone. 9.54% CAGR vs the TSX Composite's 3.95%. But dig into the risk numbers and something unusual emerges. The Sharpe ratio (0.443) backs it up. Max drawdown (-24.32%) was far shallower than a typical equity allocation. The win rate is 76%, the highest of any exchange we tested. Three out of four years, the strategy beats the local index. $10,000 grew to ~$98,000 vs the TSX Composite's ~$26,000.
Contents
- Method
- The Screen (SQL)
- What We Found
- $10,000 grew to ~$98,000 in CAD. The TSX Composite reached ~$26,000.
- Annual Returns
- Post-crisis recoveries: where the alpha lives
- Consistency over drama
- When It Works
- When It Struggles
- Limitations
- Run It Yourself
- Part of a Series
Data: FMP financial data warehouse, 2000–2025. Updated March 2026.
Method
Data source: Ceta Research (FMP financial data warehouse) Universe: TSX (Toronto Stock Exchange), market cap > C$500M (~$362M USD) Period: 2000-2025 (25 years, 25 annual periods) Rebalancing: Annual (July), top 30 by highest FCF conversion, equal weight Execution: Next-day close (market-on-close) Benchmark: S&P/TSX Composite Total Return (CAD) Cash rule: Hold cash if fewer than 10 stocks qualify Costs: Size-tiered transaction costs (0.1% large-cap, 0.3% mid-cap, 0.5% small-cap)
Financial data uses a 45-day lag to prevent look-ahead bias. Trades execute at the next trading day's closing price to reflect realistic fill assumptions. Returns are in CAD. Full methodology: Ceta Research Backtest Methodology.
For a detailed explanation of FCF Conversion as a quality signal and the academic research behind it, see the US FCF Conversion Quality post.
The Screen (SQL)
SELECT
  c.symbol, p.companyName,
  ROUND(c.freeCashFlow / NULLIF(i.netIncome, 0) * 100, 1) AS fcf_conversion_pct,
  ROUND(c.freeCashFlow / NULLIF(i.revenue, 0) * 100, 1) AS fcf_margin_pct,
  ROUND(k.returnOnEquityTTM * 100, 1) AS roe_pct,
  ROUND(r.operatingProfitMarginTTM * 100, 1) AS op_margin_pct,
  ROUND(k.marketCap / 1e9, 1) AS mktcap_bn
FROM cash_flow_statement_ttm c
JOIN income_statement_ttm i ON c.symbol = i.symbol
JOIN key_metrics_ttm k ON c.symbol = k.symbol
JOIN financial_ratios_ttm r ON c.symbol = r.symbol
JOIN profile p ON c.symbol = p.symbol
WHERE i.netIncome > 0 AND c.freeCashFlow > 0
  AND c.freeCashFlow / NULLIF(i.netIncome, 0) > 1.0
  AND c.freeCashFlow / NULLIF(i.netIncome, 0) < 3.0
  AND c.freeCashFlow / NULLIF(i.revenue, 0) > 0.10
  AND k.returnOnEquityTTM > 0.10
  AND r.operatingProfitMarginTTM > 0.10
  AND k.marketCap > 500e6  -- C$500M (~$362M USD)
  AND p.exchange IN ('TSX')
ORDER BY c.freeCashFlow / NULLIF(i.netIncome, 0) DESC
LIMIT 30
Run this query on Ceta Research
What We Found
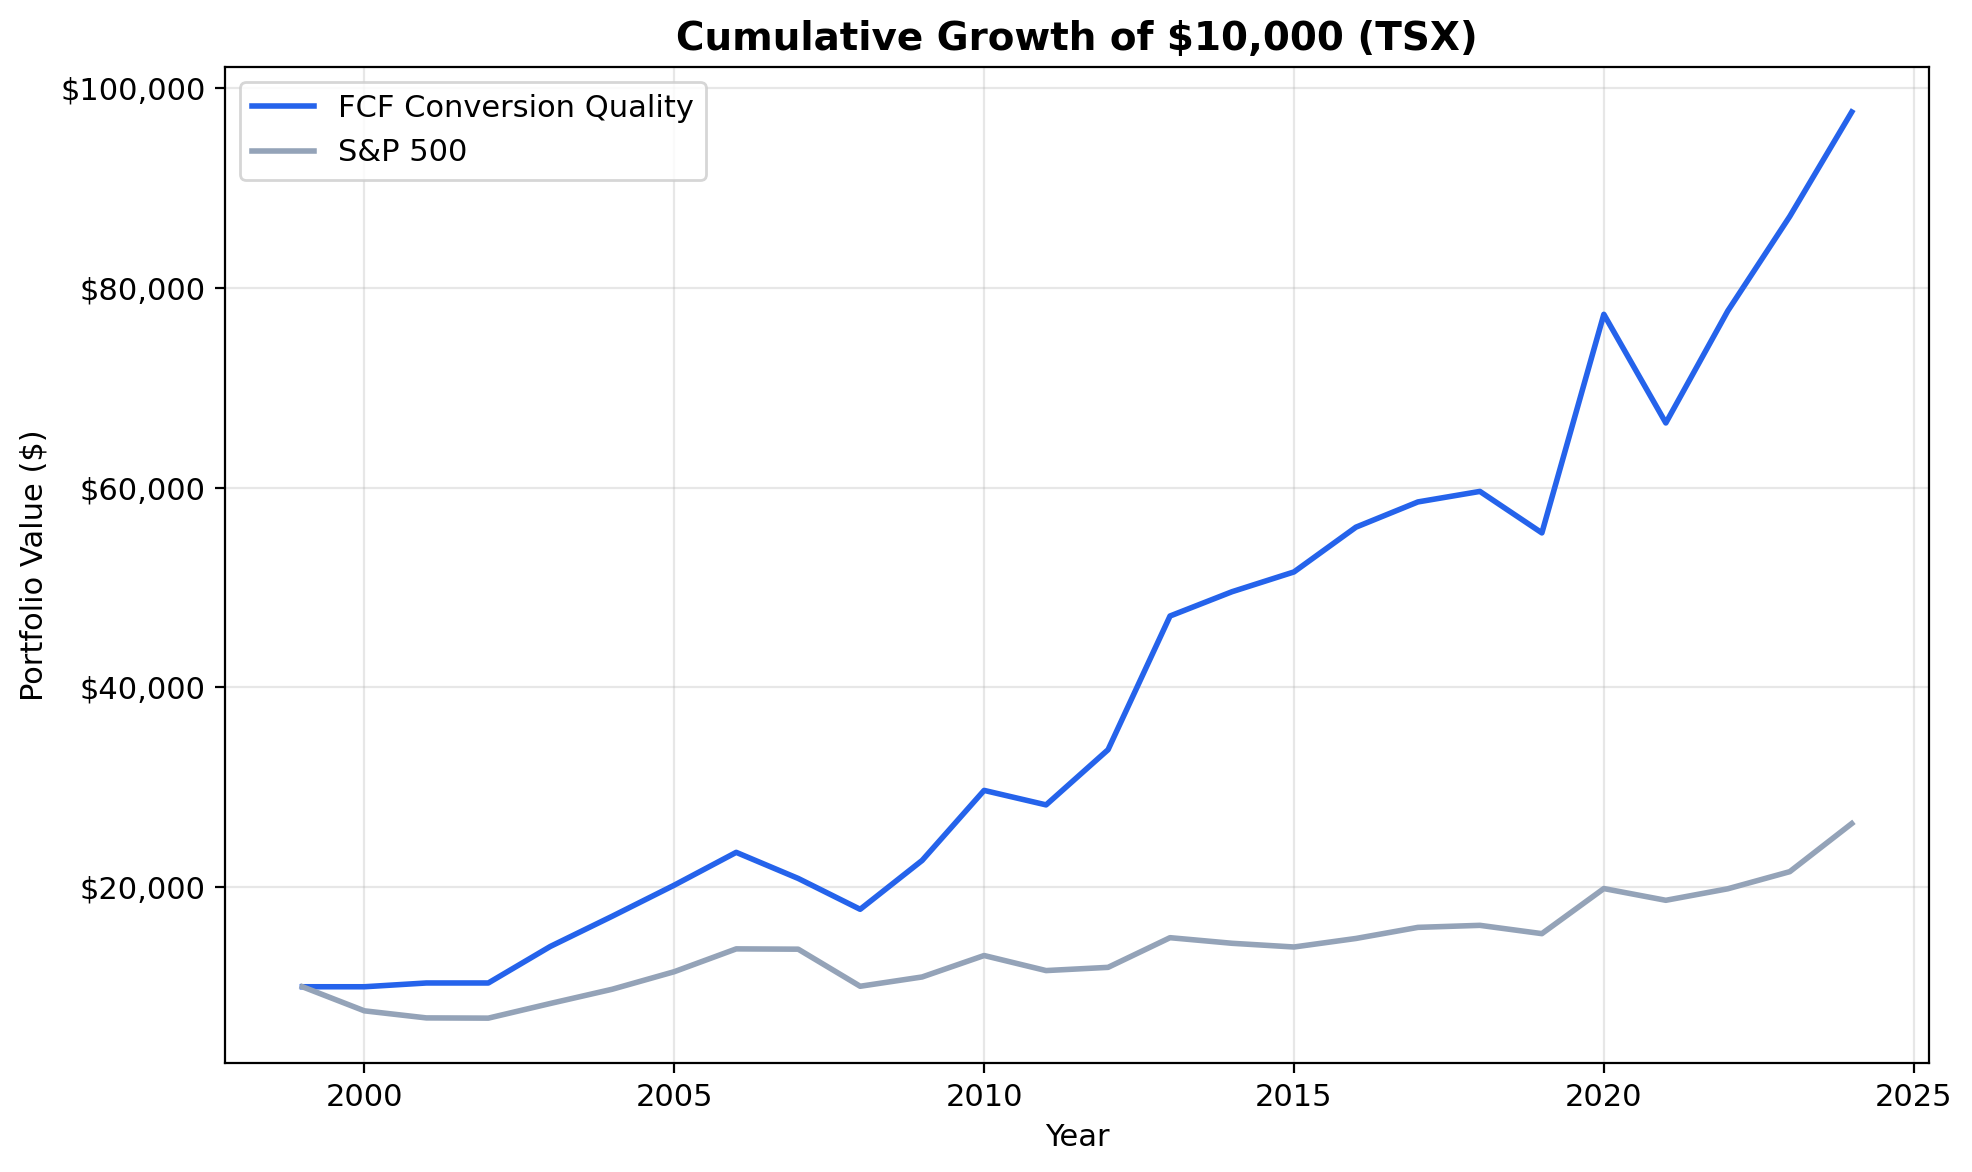
$10,000 grew to ~$98,000 in CAD. The TSX Composite reached ~$26,000.
| Metric | FCF Conversion (CAD) | TSX Composite (CAD) |
|---|---|---|
| CAGR | 9.54% | 3.95% |
| Total Return | 877% | ~160% |
| Excess CAGR | +5.59% | - |
| Max Drawdown | -24.32% | - |
| Sharpe Ratio | 0.443 | - |
| Sortino Ratio | 1.162 | - |
| Down Capture | 43.33% | - |
| Win Rate (annual) | 76% | - |
| Avg Stocks per Period | 21.8 | - |
| Cash Periods | 2 of 25 | - |
The win rate is the first thing to notice: 76%. That's the highest of any exchange we tested. Three out of four years, Canadian cash generators beat the TSX Composite. This isn't a strategy that earns all its alpha in a few big years. It grinds it out consistently.
The Sortino ratio (1.162) reinforces this. Sortino only penalizes downside volatility, and the gap between the Sharpe (0.443) and Sortino (1.162) tells you the upside volatility was large relative to the downside. When the portfolio moved, it moved up more than it moved down.
Down capture of 43.33% means the strategy absorbs less than half of the TSX Composite's losses in bad years. Combine that with the 76% win rate and you get a return profile that's both consistent and protective.
Both strategy and benchmark are in CAD, so there's no currency mismatch in the excess return. The 5.59% annual alpha is a direct, apples-to-apples comparison.
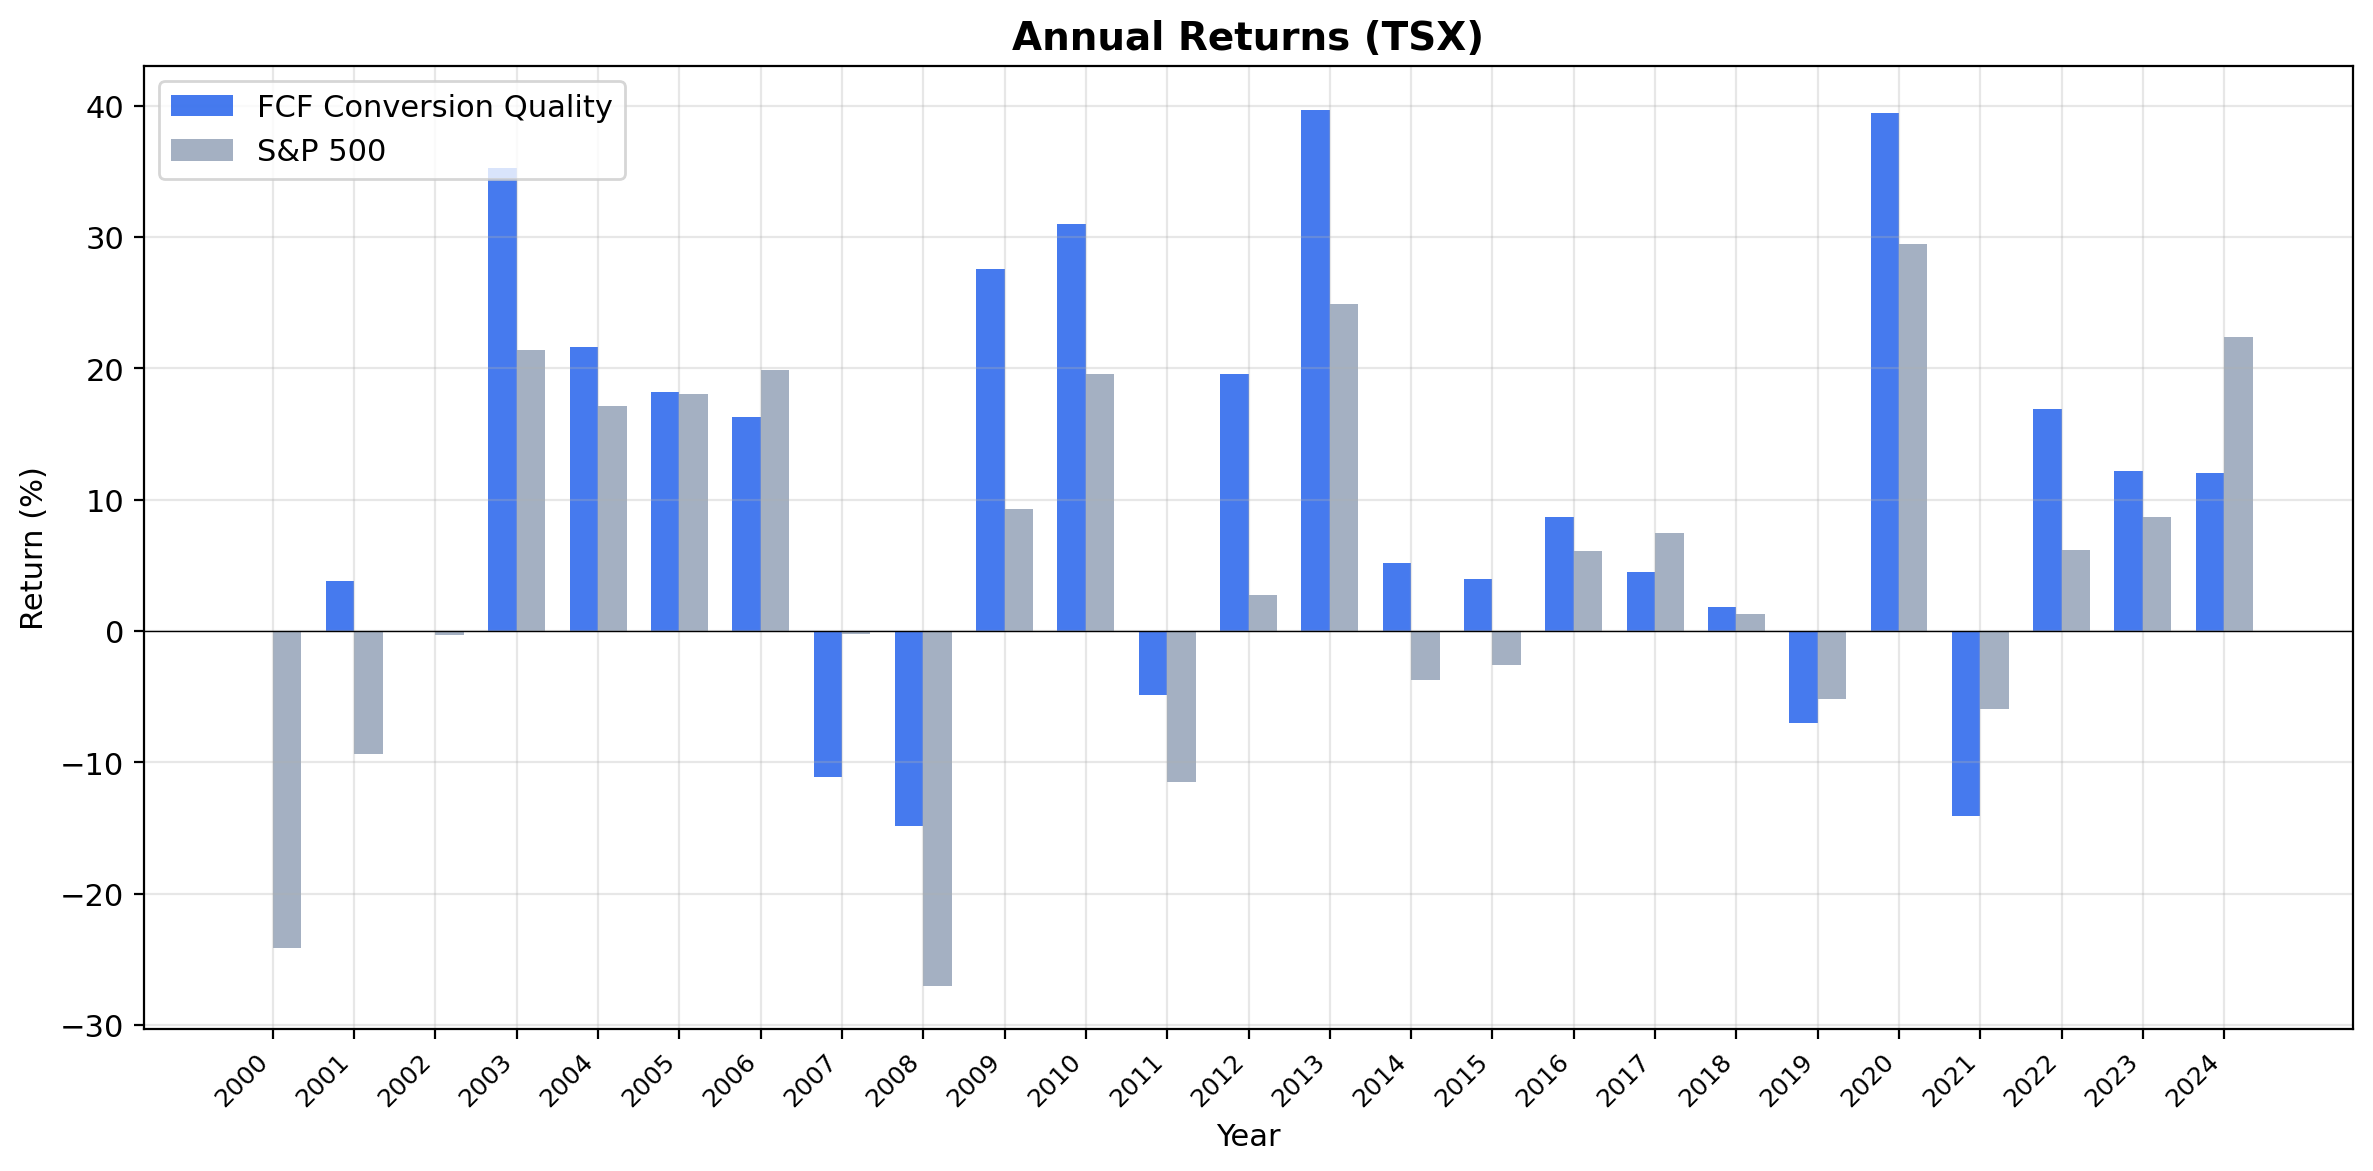
Annual Returns
| Year | Strategy (CAD) | TSX Composite (CAD) | Excess |
|---|---|---|---|
| 2003 | +35.3% | +21.4% | +13.9% |
| 2009 | +27.6% | +9.3% | +18.3% |
| 2010 | +31.0% | +19.6% | +11.4% |
Post-crisis recoveries: where the alpha lives
The strategy's biggest excess returns cluster around recovery years. 2003 (+35.3% vs +21.4%), 2009 (+27.6% vs +9.3%), and 2010 (+31.0% vs +19.6%) all show the same pattern: when the market recovers, cash-rich companies lead. They don't need to raise capital or restructure. They're already generating the cash to invest in growth.
Consistency over drama
With a 76% win rate, the losing years are the exception. When the strategy does underperform, the gaps tend to be small. The cumulative effect is a 3.8x return advantage over the TSX Composite ($98K vs $26K) built gradually, not through a few lucky years.
When It Works
Post-crisis recovery. Canadian quality companies tend to be well-capitalized banks, infrastructure operators, and resource companies with stable cash flows. After market dislocations, these firms recover quickly because they don't need external financing. The 2003, 2009, and 2010 results demonstrate this.
US dollar strength. When the USD strengthens vs CAD, Canadian exporters (especially resource companies) see higher CAD-equivalent revenues. Many TSX quality companies have significant US revenue exposure, creating a natural tailwind in USD-strong environments.
Commodity stability. Canada's quality universe tends to include companies that benefit from steady commodity prices without being pure commodity plays. They have processing, distribution, or technology layers on top of resource exposure, which smooths cash flows relative to pure miners or drillers.
When It Struggles
Strong growth environments. When global markets rally on risk appetite and momentum, Canada's conservative cash generators lag. The TSX is underweight in high-growth tech relative to NASDAQ.
Energy downturns. Prolonged oil price weakness hits a significant portion of TSX-listed companies, even quality ones. The 2019 underperformance coincided with energy sector weakness.
Limitations
TSX sector concentration. The TSX is heavily weighted toward financials, energy, and materials. The FCF Conversion screen inherits some of this concentration. Sector diversification is limited compared to US exchanges.
Survivorship bias. Delisted Canadian companies aren't fully captured, particularly small-cap names that may have passed the screen historically.
High win rate context. 76% win rate against a weak benchmark (3.95% CAGR) is partly a function of that low baseline. TSX Composite has been one of the weaker developed-market indices.
Resource company accounting. Canadian resource companies can have volatile FCF due to commodity price swings and lumpy capital expenditure cycles. The conversion ratio can swing between qualifying and disqualifying across years for the same company.
Run It Yourself
Live screen:
python3 fcf-conversion/screen.py --preset canada
Full backtest:
python3 fcf-conversion/backtest.py --preset canada --output results.json --verbose
Code: github.com/ceta-research/backtests/tree/main/fcf-conversion
Part of a Series
This is the Canada edition of our FCF Conversion Quality analysis. We ran the same screen on 15 exchanges globally:
- FCF Conversion on US Stocks (NYSE + NASDAQ + AMEX) - 9.68% CAGR, the baseline
- India: +6.13% excess vs Sensex, best absolute return at 18.18% CAGR
- UK: 84% win rate, consistent across 22 invested years
- Global comparison: all exchanges side by side
Data: Ceta Research (FMP financial data warehouse), 2000-2025. Returns in CAD. Benchmark: S&P/TSX Composite Total Return. Execution: next-day close (MOC). Full methodology: github.com/ceta-research/backtests/blob/main/METHODOLOGY.md
Past performance does not guarantee future results. This is research content, not investment advice.


