
Operating Cash Flow Momentum: When Earnings Grow Faster Than Cash, Watch Out
We tested a cash flow quality screen on 25 years of US stock data. The strategy matched the S&P 500 at 7.4% vs 7.9%, with a positive excess every year during the dot-com bust (+19.8% in 2000) but struggling 2017-2019.


We tested a cash flow quality screen on 25 years of US stock data: buy companies where operating cash flow is growing faster than earnings, sell when the gap reverses. The strategy returned 7.4% annually from 2000 to 2025, essentially matching the S&P 500's 7.9%. It beat the market through the dot-com bust and recovery (positive excess every year from 2000 to 2005, including +19.8% in 2000) but struggled in 2011, 2015, and 2018-2019, underperforming by double digits in four separate years. The lesson: cash flow divergence works when markets care about fundamentals. It doesn't work when sentiment overrides balance sheets.
Contents
- Method
- What is OCF Momentum?
- The Screen
- OCF Momentum Screen with Divergence Signal (SQL)
- What We Found
- 25 years of data. Matched the S&P 500 (+7.4% vs +7.9%).
- Year-by-year returns
- The dot-com era: OCF Momentum's best stretch
- The 2017-2019 underperformance: what changed?
- When OCF Momentum Works
- When OCF Momentum Struggles
- Limitations
- Takeaway
- References
Data: FMP financial data warehouse, 2000–2025. Updated June 2026.
Method
Data source: Ceta Research (FMP financial data warehouse) Universe: All US exchanges (NYSE, NASDAQ, AMEX), market cap > $1B USD Period: 2000-2025 (25 years, annual rebalancing) Rebalancing: Annual (July), 45-day lag on FY financial data Benchmark: S&P 500 Total Return (SPY) Cash rule: Hold cash if fewer than 10 stocks qualify
Operating cash flow growth and net income growth calculated from FY annual data. Point-in-time methodology: only filings available 45 days before each rebalance date were used.
What is OCF Momentum?
Operating cash flow momentum measures whether a company's cash generation is improving faster than its reported earnings. The signal has two parts.
Part 1: Raw OCF Growth
OCF Growth = (OCF this year - OCF last year) / |OCF last year|
If a company generated $500M in operating cash flow last year and $650M this year, OCF growth is 30%. The absolute value in the denominator handles cases where prior-year OCF was negative (turnarounds).
Part 2: The Divergence Signal
Divergence = OCF Growth - Net Income Growth
A positive divergence means cash flow is growing faster than earnings. That's a quality signal: the business is converting a higher percentage of its profits into real cash. A negative divergence means earnings are outpacing cash flow. That's often a red flag: the company may be booking revenue it hasn't collected, delaying expenses, or using accrual accounting to inflate the income statement.
Our filters: - OCF Growth > 10% YoY (genuine momentum) - OCF Growth < 500% (caps recovery-from-zero artifacts) - Divergence > 0 (cash growing faster than earnings) - ROE > 10% (already profitable, filters out noisy turnarounds) - Operating Margin > 5% (real operating business) - Market Cap > $1B (institutional-grade liquidity)
Portfolio: Top 30 stocks by highest divergence, equal weight, rebalanced annually in July.
The divergence ranking is critical. A stock with 12% OCF growth and 5% earnings growth (divergence: +7%) often outperforms a stock with 40% OCF growth and 50% earnings growth (divergence: -10%). We're not buying raw momentum. We're buying improving cash flow quality.
The Screen
OCF Momentum Screen with Divergence Signal (SQL)
WITH latest_cg AS (
    SELECT symbol, growthOperatingCashFlow, dateEpoch,
        ROW_NUMBER() OVER (PARTITION BY symbol ORDER BY dateEpoch DESC) AS rn
    FROM cash_flow_statement_growth
    WHERE period = 'FY' AND growthOperatingCashFlow IS NOT NULL
),
latest_ig AS (
    SELECT symbol, growthNetIncome, dateEpoch,
        ROW_NUMBER() OVER (PARTITION BY symbol ORDER BY dateEpoch DESC) AS rn
    FROM income_statement_growth
    WHERE period = 'FY' AND growthNetIncome IS NOT NULL
)
SELECT
    cg.symbol,
    p.companyName,
    ROUND(cg.growthOperatingCashFlow * 100, 1) AS ocf_growth_pct,
    ROUND(ig.growthNetIncome * 100, 1) AS ni_growth_pct,
    ROUND((cg.growthOperatingCashFlow - ig.growthNetIncome) * 100, 1) AS divergence_pct,
    ROUND(k.returnOnEquityTTM * 100, 1) AS roe_pct,
    ROUND(f.operatingProfitMarginTTM * 100, 1) AS op_margin_pct,
    ROUND(k.marketCap / 1e9, 1) AS market_cap_billions
FROM latest_cg cg
JOIN latest_ig ig ON cg.symbol = ig.symbol AND ig.rn = 1
JOIN key_metrics_ttm k ON cg.symbol = k.symbol
JOIN financial_ratios_ttm f ON cg.symbol = f.symbol
JOIN profile p ON cg.symbol = p.symbol
WHERE cg.rn = 1
  AND cg.growthOperatingCashFlow > 0.10
  AND cg.growthOperatingCashFlow < 5.0
  AND cg.growthOperatingCashFlow > ig.growthNetIncome  -- Positive divergence
  AND k.returnOnEquityTTM > 0.10
  AND f.operatingProfitMarginTTM > 0.05
  AND k.marketCap > 1000000000
  AND p.exchange IN ('NYSE', 'NASDAQ', 'AMEX')
ORDER BY (cg.growthOperatingCashFlow - ig.growthNetIncome) DESC
LIMIT 30
Run this query on Ceta Research
This screen uses CTEs to grab the latest FY growth data for each stock, then joins TTM quality metrics. The critical filter is growthOperatingCashFlow > growthNetIncome, which ensures positive divergence. Results are ranked by divergence magnitude, not raw OCF growth.
What We Found
25 years of data. Matched the S&P 500 (+7.4% vs +7.9%).
| Metric | OCF Momentum (US) | S&P 500 |
|---|---|---|
| CAGR | 7.4% | 7.9% |
| Total Return | 494% | 562% |
| Volatility | 21.2% | 16.6% |
| Max Drawdown | -37.7% | -38.0% |
| Sharpe Ratio | 0.25 | 0.35 |
| Sortino Ratio | 0.51 | 0.63 |
| Win Rate (annual) | 48% | - |
| Avg Stocks per Period | 23.7 | - |
| Cash Periods | 0 of 25 | - |
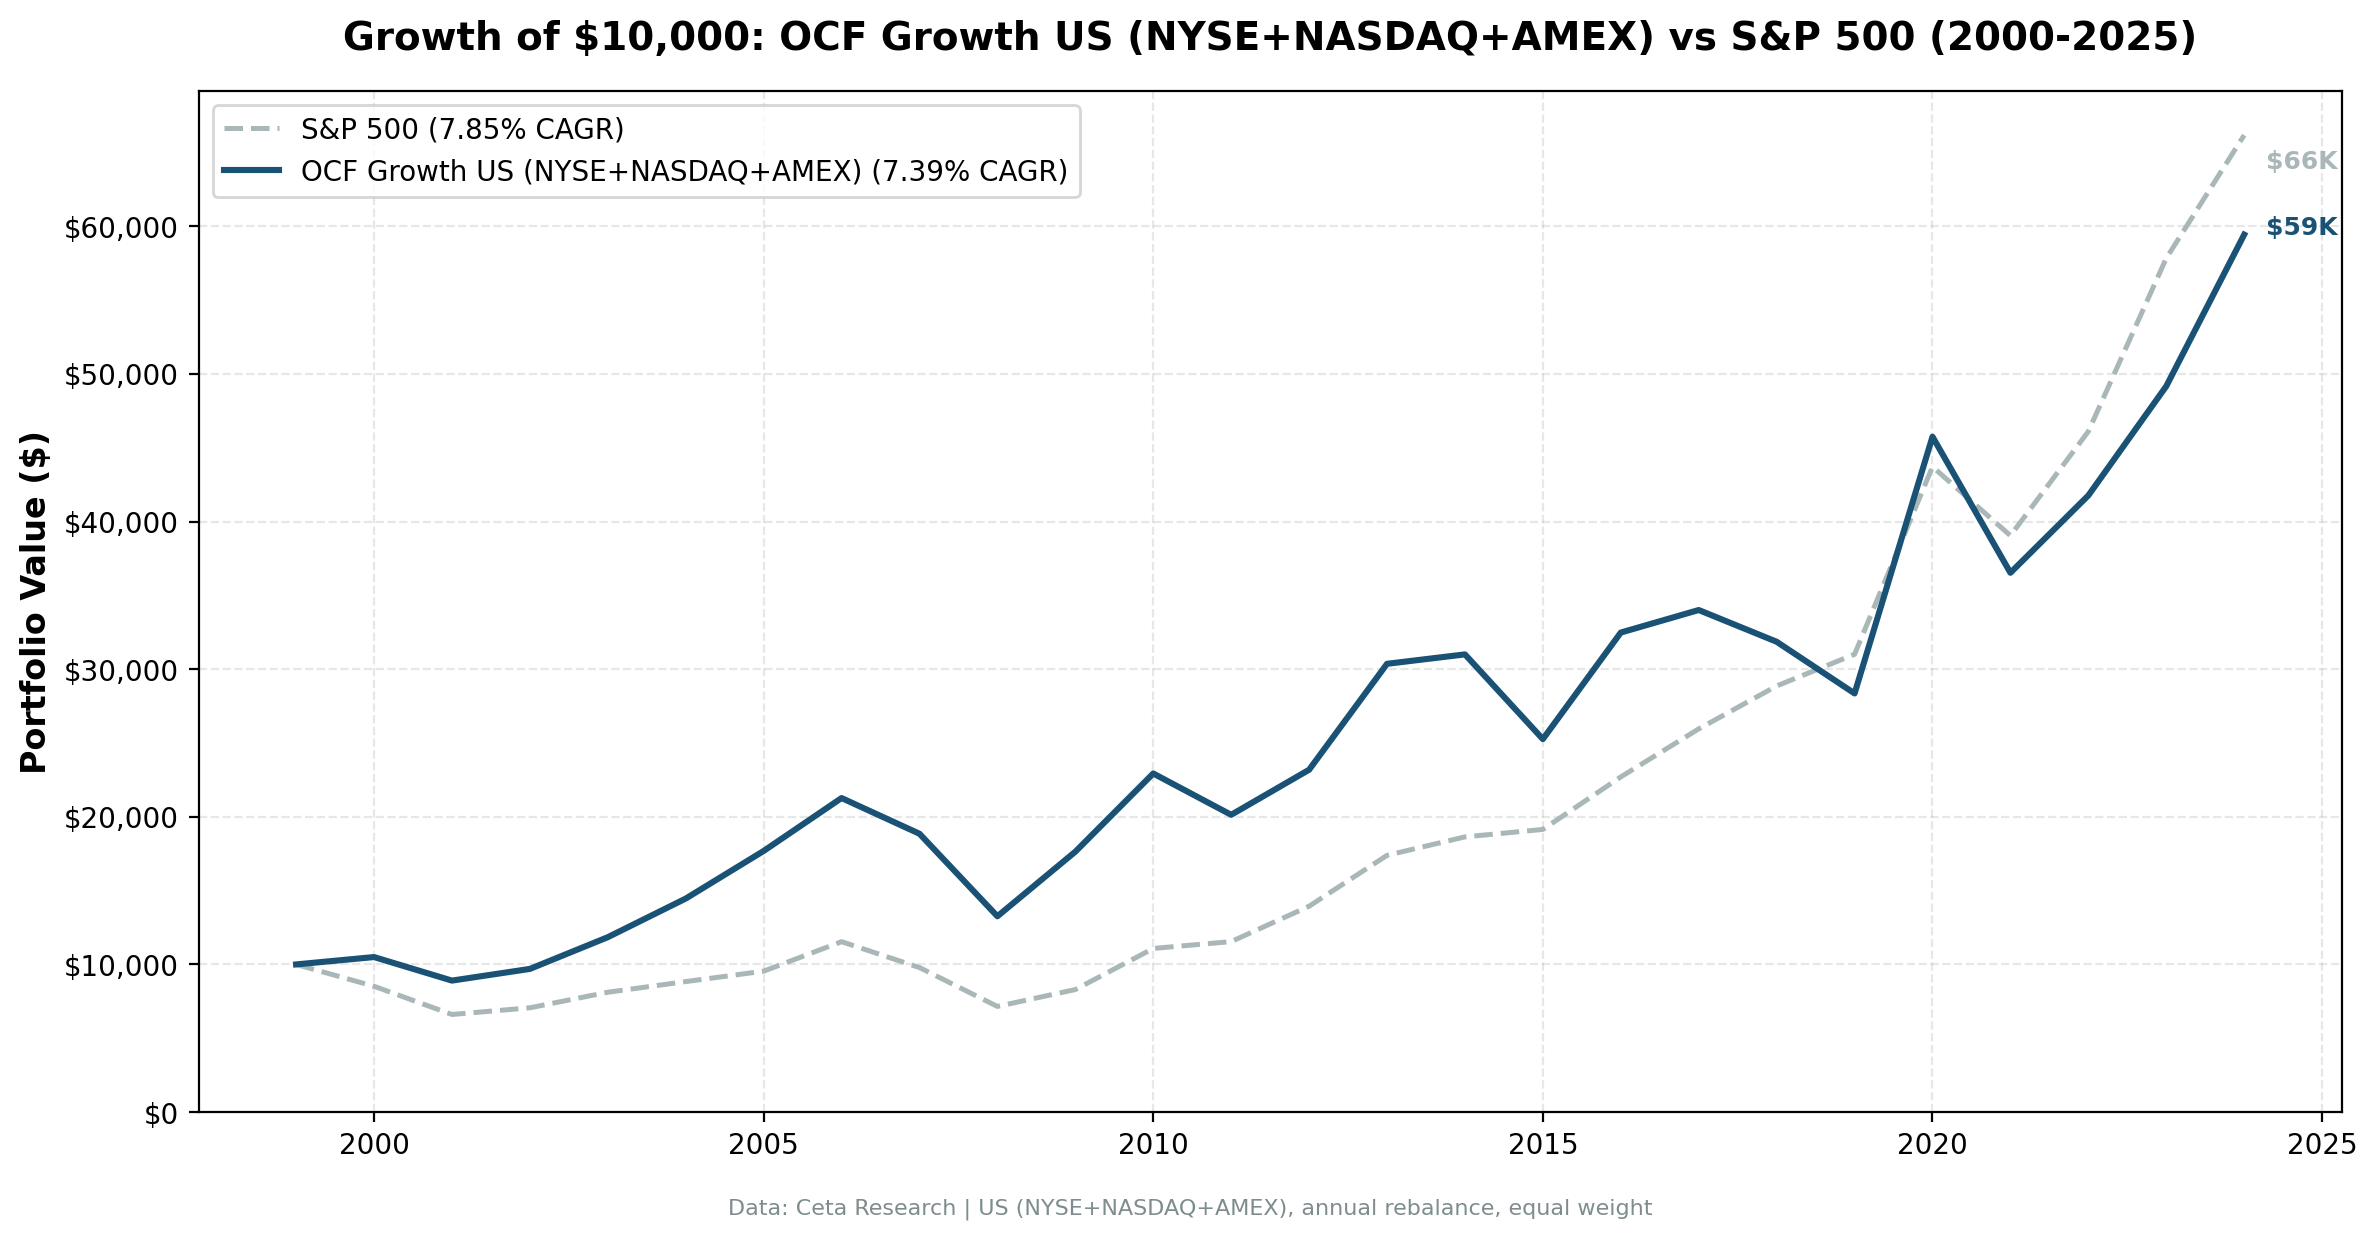
OCF Momentum turned $10,000 into $59,428. The S&P 500 turned it into $66,167. Over 25 years, the strategy trailed by about 0.5% annually. It was fully invested every single period (zero cash drag), with similar volatility on the downside (max drawdown -37.7% vs -38.0%) but higher total volatility (21.2% vs 16.6%).
The raw numbers don't tell the full story. This is a strategy with two distinct regimes: it dominated during fundamental-driven markets (2000-2010) and struggled during growth-dominated markets (2018-2024).
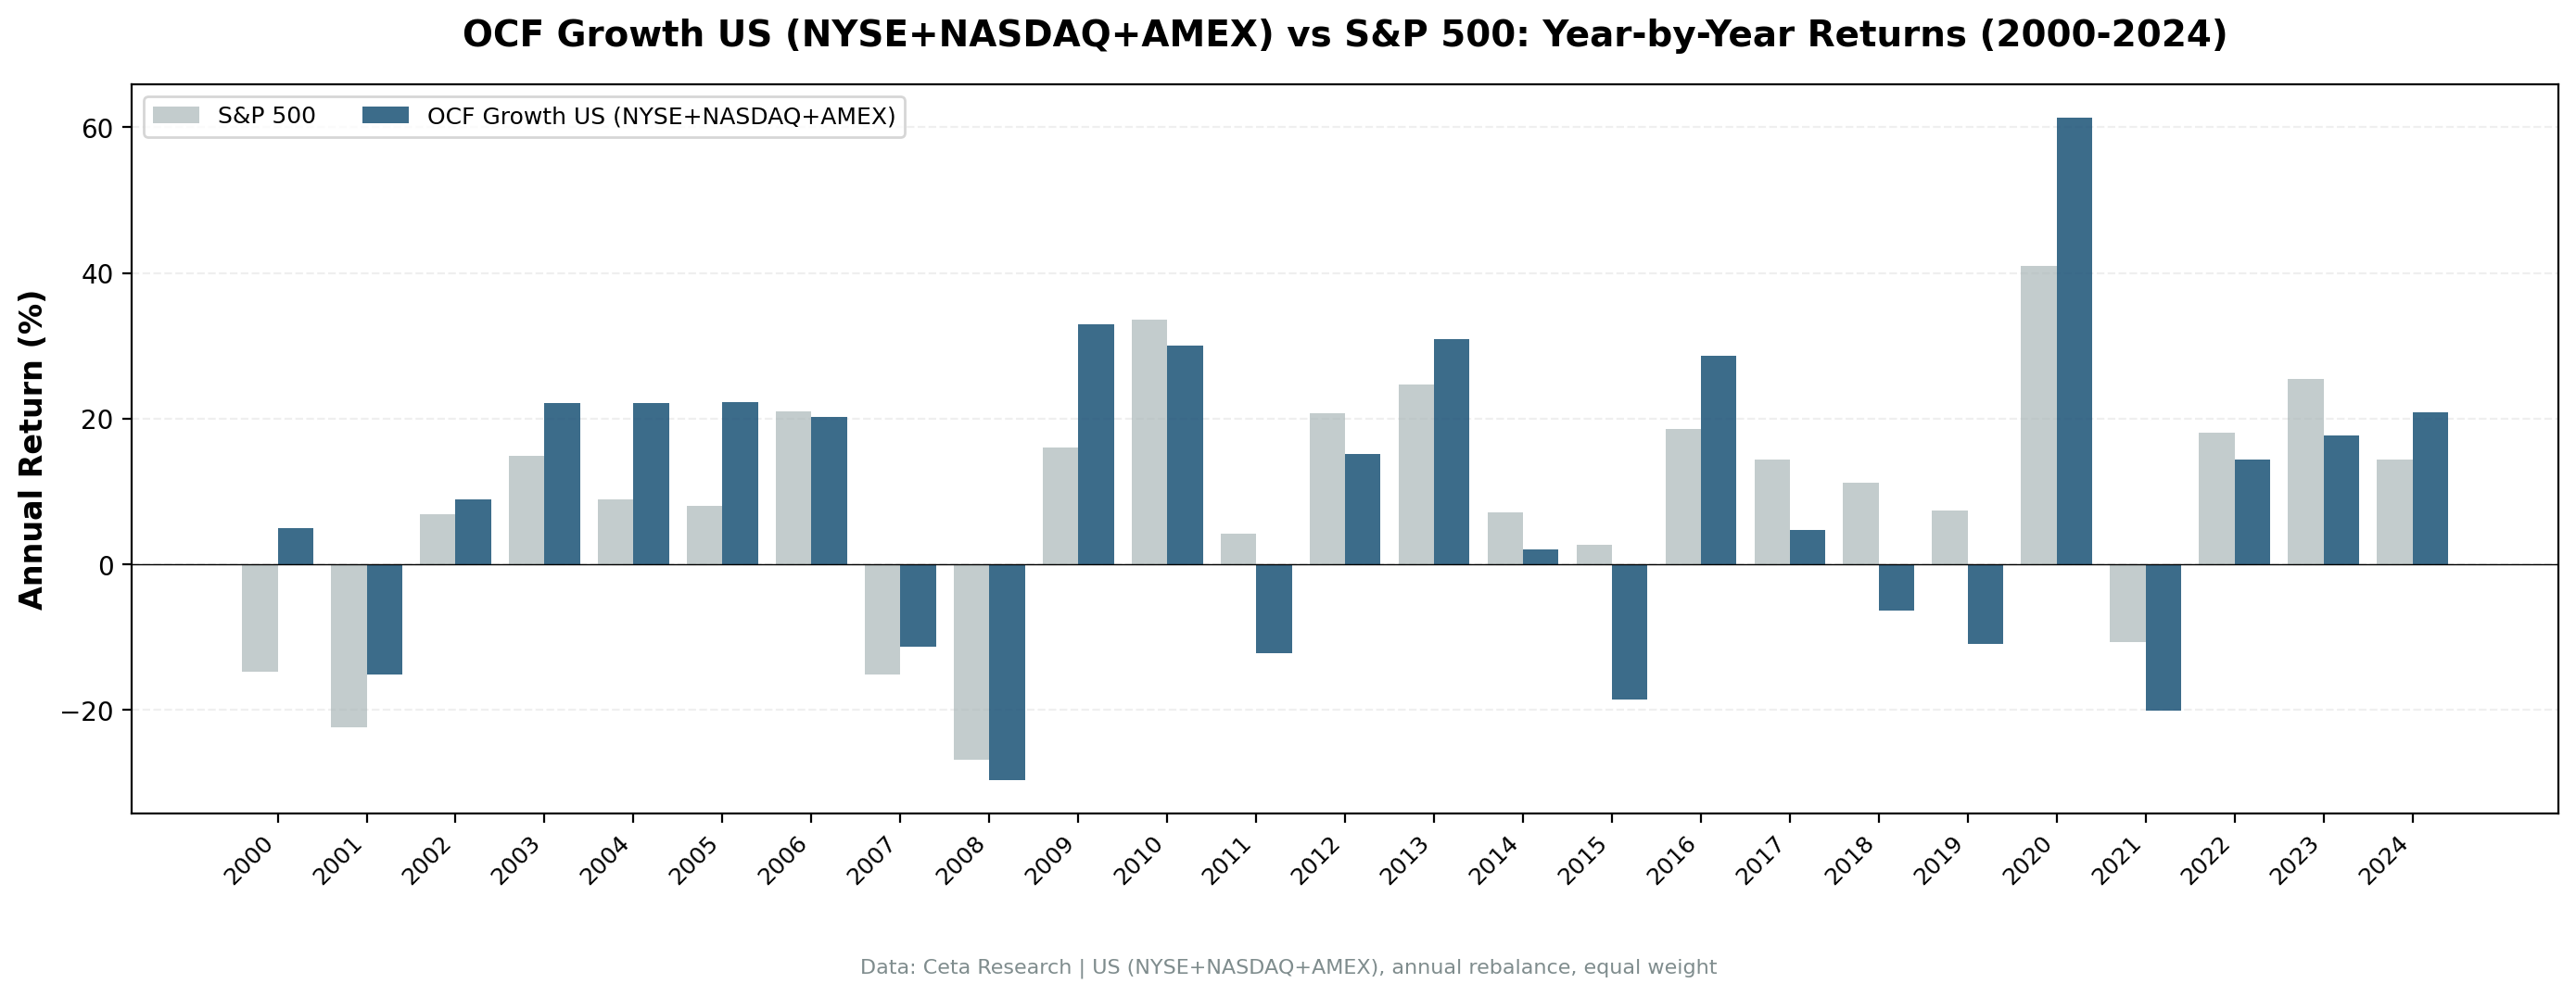
Year-by-year returns
| Year | OCF Momentum | S&P 500 | Excess |
|---|---|---|---|
| 2000 | +5.0% | -14.8% | +19.8% |
| 2001 | -15.2% | -22.4% | +7.3% |
| 2002 | +8.9% | +6.9% | +2.0% |
| 2003 | +22.2% | +14.9% | +7.2% |
| 2004 | +22.1% | +8.9% | +13.2% |
| 2005 | +22.3% | +8.0% | +14.3% |
| 2006 | +20.3% | +20.9% | -0.7% |
| 2007 | -11.4% | -15.2% | +3.8% |
| 2008 | -29.7% | -26.9% | -2.8% |
| 2009 | +33.0% | +16.0% | +17.0% |
| 2010 | +30.0% | +33.5% | -3.5% |
| 2011 | -12.2% | +4.2% | -16.4% |
| 2012 | +15.2% | +20.7% | -5.6% |
| 2013 | +30.9% | +24.7% | +6.2% |
| 2014 | +2.1% | +7.2% | -5.1% |
| 2015 | -18.5% | +2.7% | -21.2% |
| 2016 | +28.6% | +18.6% | +10.0% |
| 2017 | +4.7% | +14.3% | -9.6% |
| 2018 | -6.3% | +11.2% | -17.5% |
| 2019 | -11.0% | +7.4% | -18.4% |
| 2020 | +61.3% | +41.0% | +20.4% |
| 2021 | -20.1% | -10.7% | -9.5% |
| 2022 | +14.3% | +18.1% | -3.7% |
| 2023 | +17.7% | +25.4% | -7.7% |
| 2024 | +20.9% | +14.4% | +6.5% |
The dot-com era: OCF Momentum's best stretch
| Year | OCF Momentum | S&P 500 | Excess |
|---|---|---|---|
| 2000 | +5.0% | -14.8% | +19.8% |
| 2001 | -15.2% | -22.4% | +7.3% |
| 2002 | +8.9% | +6.9% | +2.0% |
| 2003 | +22.2% | +14.9% | +7.2% |
| Cumulative | +18.5% | -18.8% | +37.3% |
Over 2000-2003, OCF Momentum returned +18.5% cumulatively while the S&P 500 lost -18.8%. A 37-point swing. The cash flow divergence filter kept overvalued tech stocks out of the portfolio. Companies reporting explosive earnings growth with negative cash flow (most dot-com names) never made it past the ROE and operating margin filters.
2009 was another standout: +33.0% vs +16.0% for the S&P 500. The strategy loaded up on quality companies with improving cash flow quality that the market had beaten down during the financial crisis.
The 2017-2019 underperformance: what changed?
| Year | OCF Momentum | S&P 500 | Excess |
|---|---|---|---|
| 2017 | +4.7% | +14.3% | -9.6% |
| 2018 | -6.3% | +11.2% | -17.5% |
| 2019 | -11.0% | +7.4% | -18.4% |
| Cumulative | -12.7% | +36.5% | -49.2% |
Three years drove most of the recent underperformance. The strategy missed the late-cycle rally led by financial and tech stocks with poor near-term cash flow quality. OCF Momentum screened those high-flyers out because they carried extreme valuations or weak near-term cash flow. The strategy was structurally short growth and long value. That was the right call in 2000. It was the wrong call in 2017-2019. Two other single years stung for the same reason: 2011 (-16.4%) and 2015 (-21.2%).
When OCF Momentum Works
Fundamental-driven markets. When investors care about balance sheets and cash generation (2000-2003, 2007-2010), OCF divergence becomes a powerful sorting mechanism. Companies with genuine cash flow improvement separate from companies inflating earnings through accruals.
Quality rotations. When the market shifts from speculative growth back to fundamentals, cash flow quality becomes a flight-to-safety signal. The strategy outperformed sharply in 2020 (+20.4% excess) and again in 2024 (+6.5%) as investors rotated back to profitable, cash-generative businesses.
Value cycles. OCF Momentum is structurally a value signal. It tends to screen out high-growth, high-multiple stocks (because growth often requires cash reinvestment, which depresses OCF). When value outperforms growth, this strategy participates.
When OCF Momentum Struggles
Growth-dominated markets. When the market is pricing companies on future potential rather than current cash flow (2011-2012, 2017-2019), this strategy underperforms. High-growth tech companies often show negative or weak OCF in their expansion phase. They get screened out. The market doesn't care.
Post-crisis rallies. After major market crashes (2009-2010, 2020), the biggest gains often come from deeply beaten-down stocks that don't yet show improving cash flow quality. OCF Momentum is late to these recoveries because it requires at least one fiscal year of improving data.
Low-quality bounces. When junk rallies (as it did in parts of 2021), OCF Momentum sits out. The ROE and operating margin filters keep speculative names out of the portfolio. That's by design, but it means missing short-term sentiment-driven runs.
Limitations
OCF momentum is a quality signal, not a momentum signal. Despite the name, this isn't about riding upward price trends. It's about identifying companies with improving earnings quality. That quality improvement often takes time to be reflected in stock prices.
Single-year snapshots miss trends. One year of strong OCF growth doesn't establish a pattern. A company that delayed payments to suppliers shows higher OCF this year. Those payments come due next year. Multi-year analysis would be more robust.
The strategy is structurally short growth. High-growth companies often reinvest cash aggressively, which depresses OCF. They get screened out even if the business is fundamentally sound. Amazon in its early years would have failed every filter despite building enormous value.
Rebalancing annually is slow. By the time the signal flips (cash flow decelerates, divergence turns negative), the stock may have already underperformed for months. More frequent rebalancing (quarterly, using TTM data) could improve responsiveness.
Doesn't account for valuation. A company with 40% OCF growth trading at 80x free cash flow may still be overpriced. The screen identifies improving quality but doesn't tell you if the market has already priced in that improvement.
Data quality matters. FMP financial data has broad coverage but may contain errors, gaps, or delayed corrections in historical records. Results should be treated as indicative, not definitive.
Takeaway
Operating cash flow momentum worked when fundamentals mattered and struggled when sentiment overrode balance sheets. Over 25 years, it matched the S&P 500 but with higher volatility and a worse Sharpe ratio. That's not a failure. It's a reminder that cash flow quality is one lens, not the only lens.
The academic research is clear: when cash flow growth outpaces earnings growth, it's a bullish signal. When earnings growth outpaces cash flow, it's a warning. Sloan (1996), Dechow (1994), and Chan et al. (2006) all found persistent alpha from the divergence signal. Our 25-year backtest confirms the pattern exists but also shows its limitations: the signal works in some market regimes and fails in others.
If you believe the 2018-2024 period was an anomaly (driven by zero interest rates and FAANG dominance) and that markets will revert to caring about cash flow quality, this strategy is worth watching. If you believe markets have permanently shifted to pricing companies on narratives and growth optionality rather than current cash generation, OCF Momentum will keep underperforming.
Cash is harder to fake than earnings. But in the short run, markets don't always care.
References
- Ball, R. & Brown, P. (1968). "An Empirical Evaluation of Accounting Income Numbers." Journal of Accounting Research, 6(2), 159-178.
- Sloan, R. (1996). "Do Stock Prices Fully Reflect Information in Accruals and Cash Flows about Future Earnings?" The Accounting Review, 71(3), 289-315.
- Dechow, P. (1994). "Accounting Earnings and Cash Flows as Measures of Firm Performance: The Role of Accounting Accruals." Journal of Accounting and Economics, 18(1), 3-42.
- Chan, K., Chan, L., Jegadeesh, N. & Lakonishok, J. (2006). "Earnings Quality and Stock Returns." Journal of Business, 79(3), 1041-1082.
Data: Ceta Research (FMP financial data warehouse), 2000-2025. Full methodology: backtests/METHODOLOGY.md
Past performance does not guarantee future results. This is educational content, not investment advice.


