
UK: +4.0% Alpha Over the FTSE 100, The Signal Works
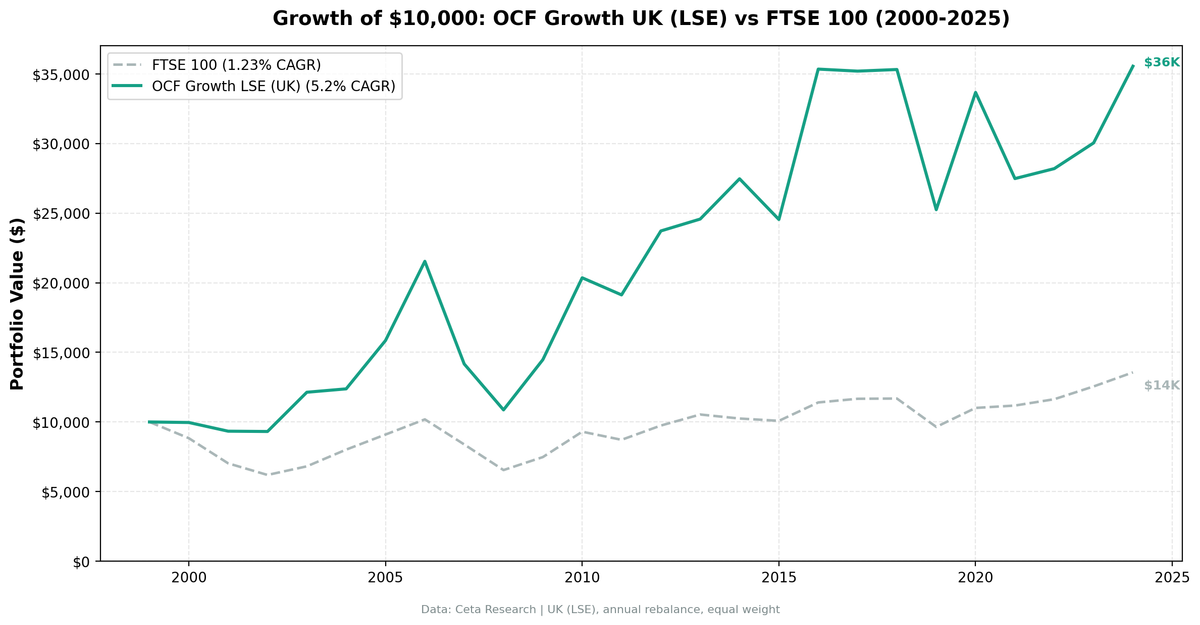
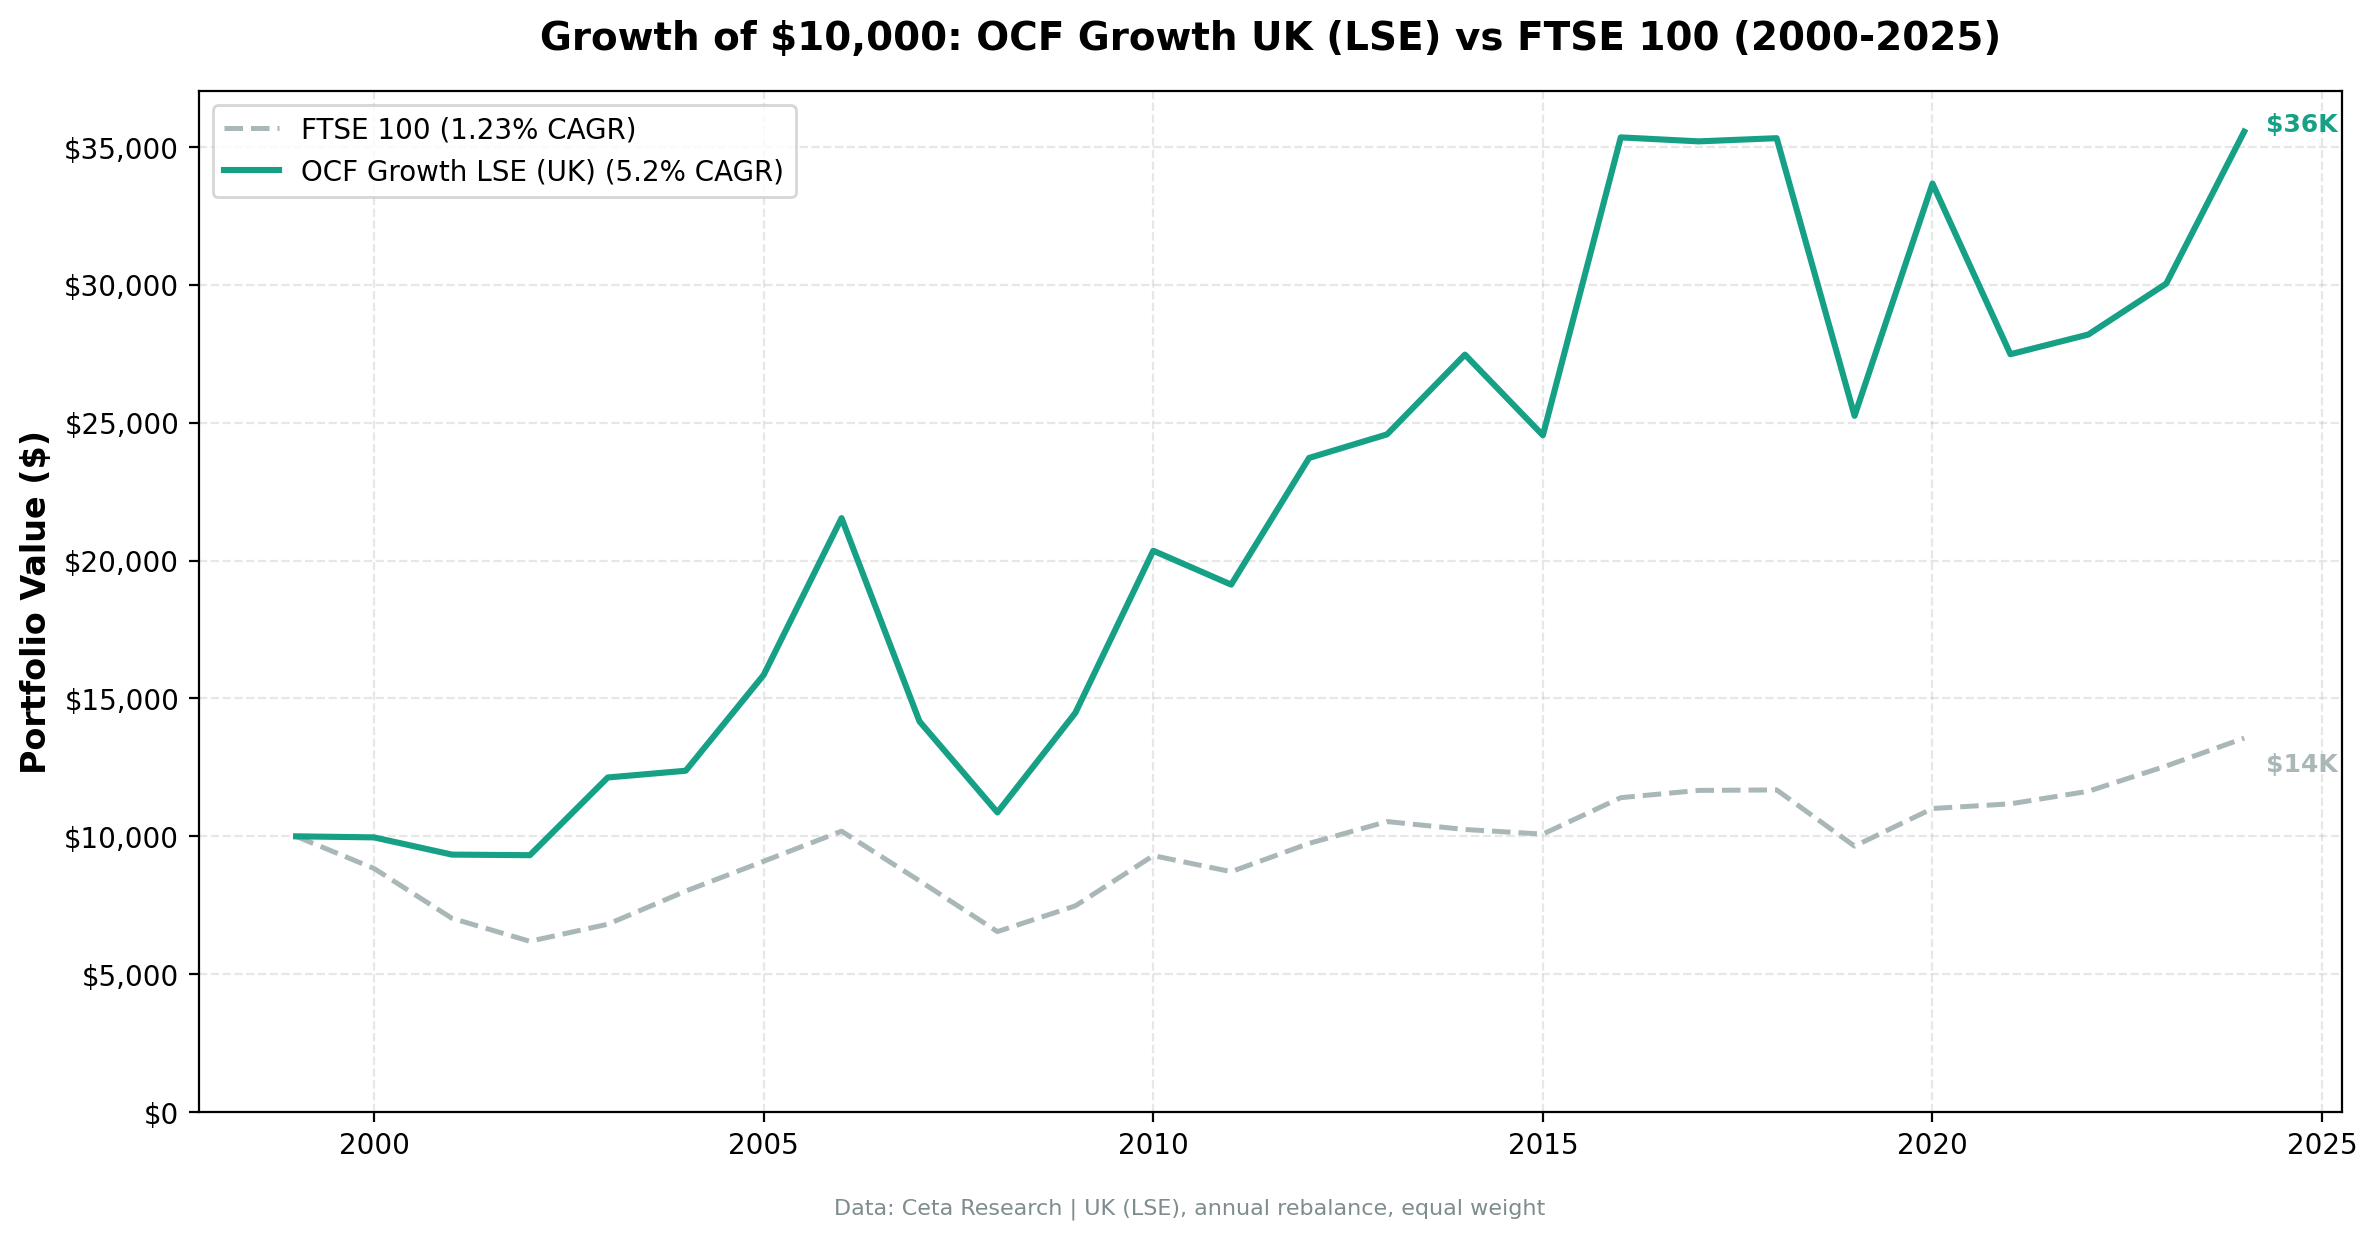
OCF momentum returned 5.2% annually on UK stocks vs the FTSE 100's 1.2%, a +4.0% alpha. A 60% win rate and a deep -49.5% drawdown make it volatile, but the signal works.

UK: +4.0% Alpha Over FTSE 100, The Signal Works
Operating cash flow momentum returned 5.2% annually on UK stocks from 2000 to 2025, beating the FTSE 100 by 4.0% per year. The FTSE 100 returned just 1.2% annually over the same period. $10,000 grew to $35,555. The strategy outperformed the FTSE in 15 of 25 years (60% win rate). While absolute returns were modest compared to US markets, the relative edge vs the local index is real. Cash flow divergence works in the UK, even with strong accounting standards and high analyst coverage, though the ride is volatile.
Contents
- Method
- What We Found
- 25 years of data. Beat FTSE 100 by 4.0% annually (+5.2% vs +1.2%).
- Year-by-year returns
- Why OCF Momentum Works in the UK
- Part of a Series
- Run It Yourself
- Takeaway
Data: FMP financial data warehouse, 2000–2025. Updated June 2026.
Method
Data source: Ceta Research (FMP financial data warehouse) Universe: LSE, market cap > £500M (~$635M USD) Period: 2000-2025 (25 years, annual rebalancing) Rebalancing: Annual (July), 45-day lag on FY financial data Benchmark: FTSE 100 (^FTSE, local currency)
Portfolio: Top 30 stocks by highest divergence (OCF growth minus NI growth), equal weight. Quality filters: ROE > 10%, operating margin > 5%.
What We Found
25 years of data. Beat FTSE 100 by 4.0% annually (+5.2% vs +1.2%).
| Metric | OCF Momentum (UK) | FTSE 100 |
|---|---|---|
| CAGR | 5.2% | 1.2% |
| Total Return | 256% | 36% |
| Volatility | 22.0% | - |
| Max Drawdown | -49.5% | -38.1% |
| Sharpe Ratio | 0.08 | - |
| Win Rate (vs FTSE) | 60% | - |
| Avg Stocks per Period | 12.4 | - |
| Cash Periods | 0 of 25 | - |
The UK strategy beat the FTSE 100 in 15 of 25 years, a 60% win rate. The FTSE 100 barely went anywhere over 25 years (1.2% CAGR, 36% total return). The cash flow quality screen identified the UK's actual value creators while the index stagnated, but the path was rough: a deep -49.5% drawdown and a 0.08 Sharpe.
Year-by-year returns
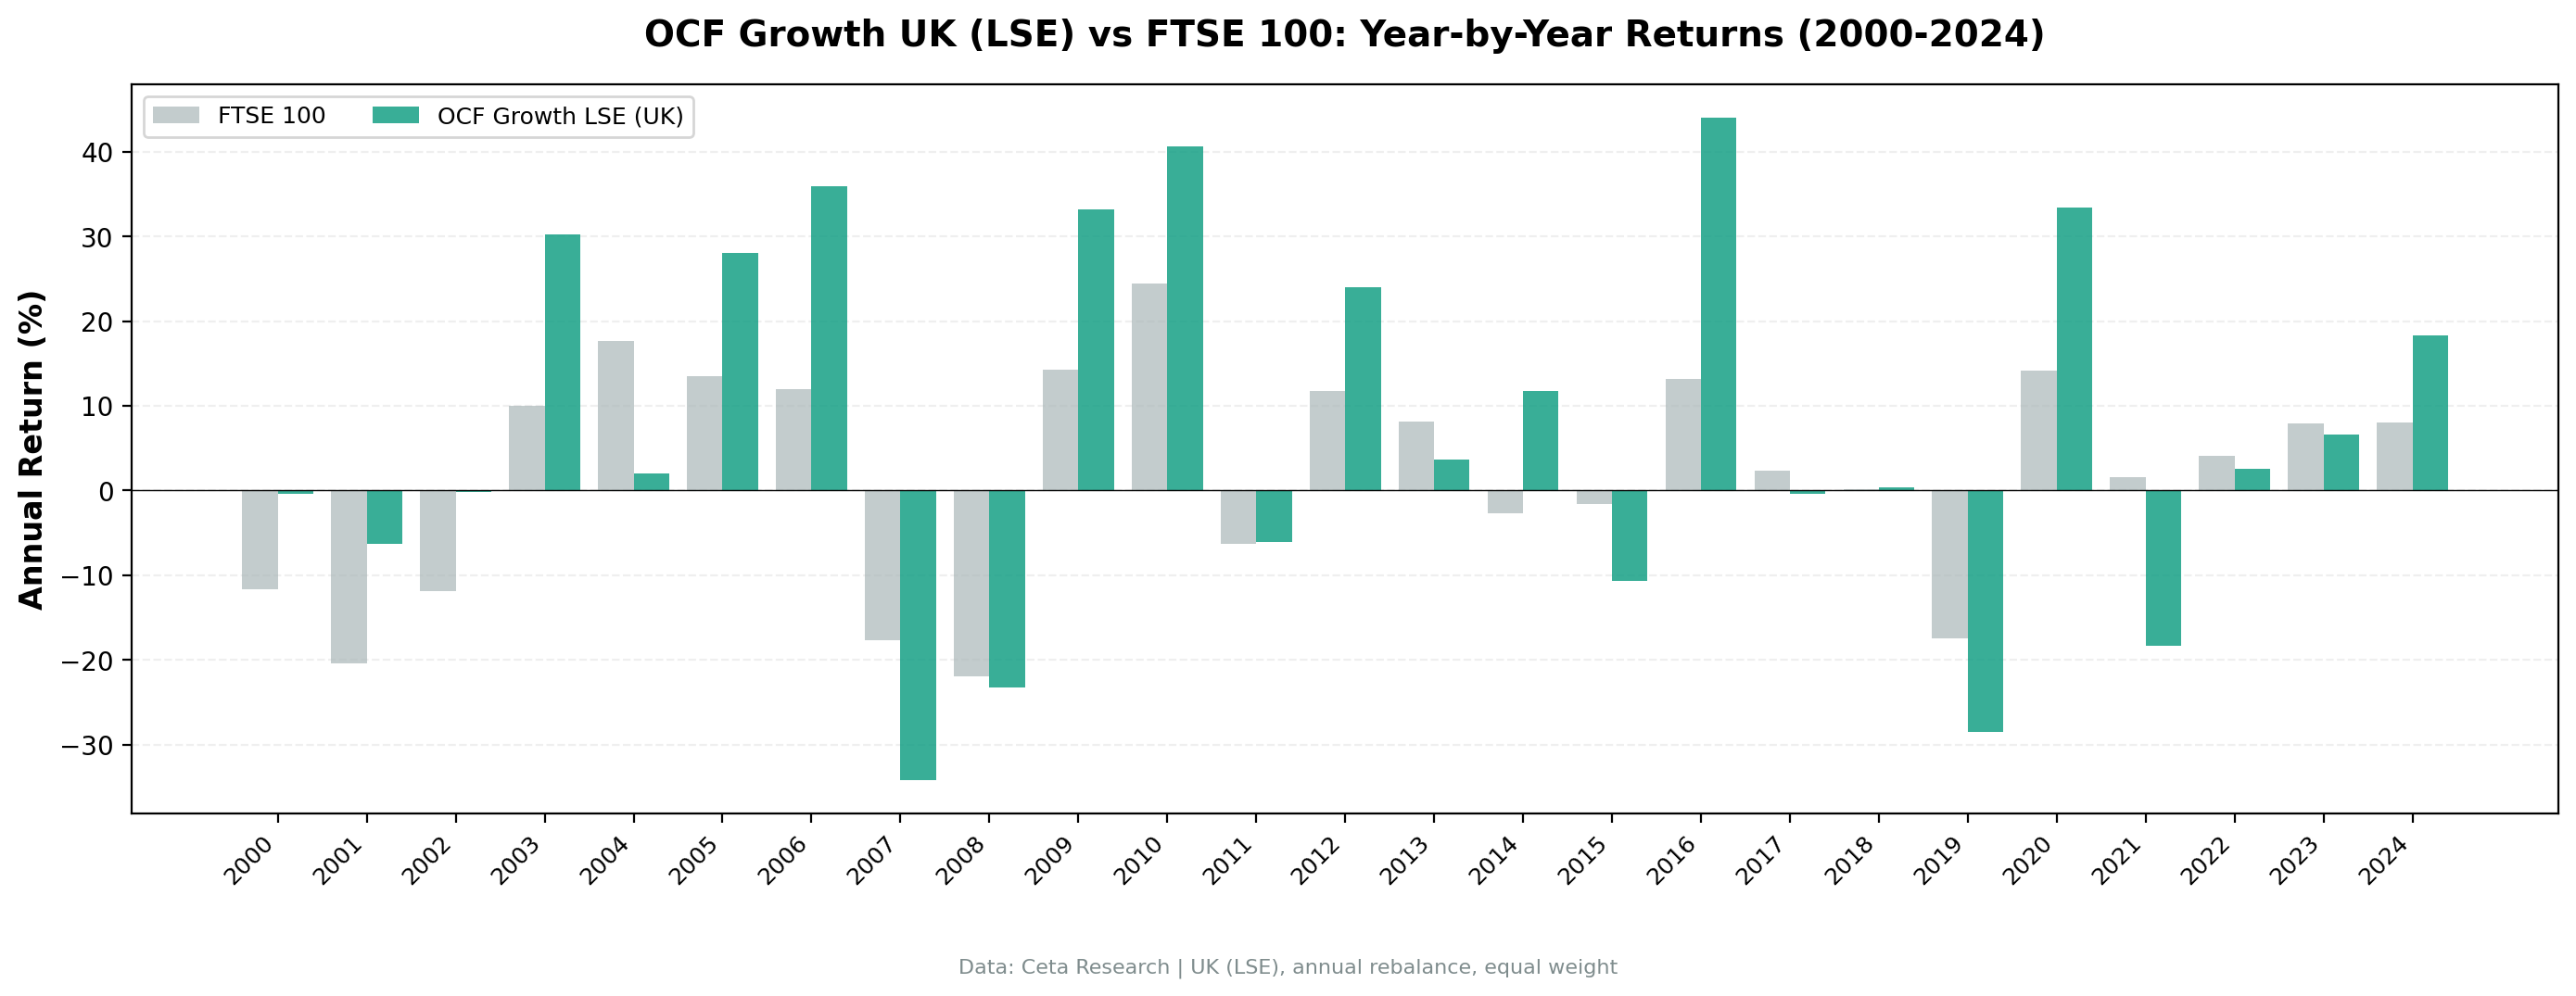
The strategy delivered +33.4% in 2020 (driven by COVID recovery in quality stocks) but also suffered -34.2% in 2007 and -28.5% in 2019. Despite year-to-year volatility, it beat the FTSE 100 in 15 of 25 years (60%). The strategy outperformed in several crises (2001, 2002, 2020) and in most bull markets (2003, 2005, 2006, 2012, 2016).
Why OCF Momentum Works in the UK
The FTSE 100 underperformed. UK equities barely moved for 25 years (1.2% CAGR). Brexit uncertainty, financial sector concentration, and poor capital allocation dragged the index. The OCF divergence filter identified companies actually generating cash, avoiding the FTSE's dead weight.
Quality matters when growth is scarce. In a stagnant market, earnings quality becomes the deciding factor. Companies with genuine cash generation beat companies inflating earnings through accruals. The 60% win rate reflects this: the signal identified the UK's handful of compounders.
Strong accounting doesn't eliminate divergence. Even with strict IFRS enforcement, earnings and cash flow still diverge for fundamental reasons (working capital, capex timing, depreciation schedules). The signal doesn't need manipulation to work. It just needs divergence driven by business model differences.
Part of a Series
For methodology and cross-market comparison: - Operating Cash Flow Momentum: US Results - India: matches the Sensex with lower drawdown - Canada: +4.9% alpha over the TSX Composite - Global comparison: 9 markets
Run It Yourself
-- OCF Momentum Screen for UK (LSE)
WITH latest_cg AS (
    SELECT symbol, growthOperatingCashFlow, dateEpoch,
        ROW_NUMBER() OVER (PARTITION BY symbol ORDER BY dateEpoch DESC) AS rn
    FROM cash_flow_statement_growth
    WHERE period = 'FY' AND growthOperatingCashFlow IS NOT NULL
),
latest_ig AS (
    SELECT symbol, growthNetIncome, dateEpoch,
        ROW_NUMBER() OVER (PARTITION BY symbol ORDER BY dateEpoch DESC) AS rn
    FROM income_statement_growth
    WHERE period = 'FY' AND growthNetIncome IS NOT NULL
)
SELECT
    cg.symbol, p.companyName,
    ROUND(cg.growthOperatingCashFlow * 100, 1) AS ocf_growth_pct,
    ROUND(ig.growthNetIncome * 100, 1) AS ni_growth_pct,
    ROUND((cg.growthOperatingCashFlow - ig.growthNetIncome) * 100, 1) AS divergence_pct,
    ROUND(k.returnOnEquityTTM * 100, 1) AS roe_pct,
    ROUND(f.operatingProfitMarginTTM * 100, 1) AS op_margin_pct
FROM latest_cg cg
JOIN latest_ig ig ON cg.symbol = ig.symbol AND ig.rn = 1
JOIN key_metrics_ttm k ON cg.symbol = k.symbol
JOIN financial_ratios_ttm f ON cg.symbol = f.symbol
JOIN profile p ON cg.symbol = p.symbol
WHERE cg.rn = 1
  AND cg.growthOperatingCashFlow > 0.10 AND cg.growthOperatingCashFlow < 5.0
  AND cg.growthOperatingCashFlow > ig.growthNetIncome
  AND k.returnOnEquityTTM > 0.10 AND f.operatingProfitMarginTTM > 0.05
  AND k.marketCap > 500000000 AND p.exchange = 'LSE'
ORDER BY (cg.growthOperatingCashFlow - ig.growthNetIncome) DESC
LIMIT 30
Run this query on Ceta Research
Takeaway
The UK signal beat the FTSE 100 by about 4.0% annually over 25 years, 5.2% CAGR vs 1.2%, turning $10,000 into $35,555 against the index's $13,561. Much of that edge comes from how weak the FTSE 100 was: a stagnant local index makes the relative alpha look large. The absolute numbers are honest about the cost: a deep -49.5% max drawdown and a 0.08 Sharpe mean this was a volatile, rough ride. Strong relative alpha against a flat benchmark, but you had to stomach the swings to capture it.
Data: Ceta Research, LSE 2000-2025. Full methodology: backtests/METHODOLOGY.md
Past performance does not guarantee future results. This is educational content, not investment advice.


