
FCF Conversion Quality on Indian Stocks: 18% CAGR With Half the Sensex Drawdown Over 25 Years
We ran our FCF Conversion screen on BSE and NSE stocks from 2000-2025. 18.18% CAGR in INR, 6.13% annual excess over the Sensex (12.06% CAGR). Max drawdown of just -15% vs the Sensex's -32%. $10K grew to $651K.

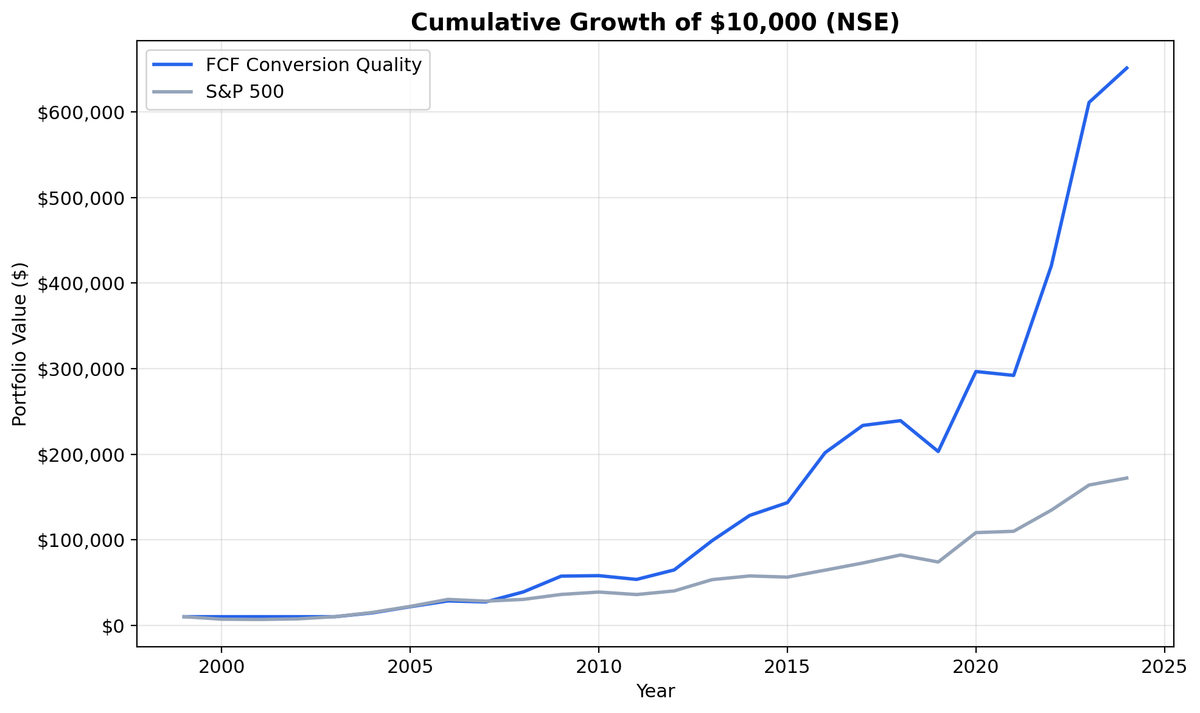
Indian companies that convert earnings to real cash didn't just outperform the Sensex. They did it with half the drawdown. We ran our FCF Conversion Quality screen on BSE and NSE-listed stocks from 2000 to 2025 and found an 18.18% CAGR in Indian Rupees, 6.13% annual excess over the Sensex (12.06% CAGR). The max drawdown was just -15.07% vs the Sensex's -32%. Even against a strong local benchmark that compounded at 12%, the strategy added consistent alpha. $10,000 became $651,000.
Contents
- Method
- The Screen (SQL)
- What We Found
- $10,000 grew to ~$651,000 in INR. The Sensex reached ~$172,000.
- Annual Returns
- 2008-2009: Back-to-back dominance
- 2013 and 2016: The pattern repeats
- When It Works
- When It Struggles
- Currency Context
- Limitations
- Run It Yourself
- Part of a Series
Data: FMP financial data warehouse, 2000–2025. Updated March 2026.
Method
Data source: Ceta Research (FMP financial data warehouse) Universe: BSE and NSE, market cap > ₹20B (~$240M USD) Period: 2000-2025 (25 years, 25 annual periods) Rebalancing: Annual (July), top 30 by highest FCF conversion, equal weight Execution: Next-day close (market-on-close) Benchmark: BSE Sensex Total Return Cash rule: Hold cash if fewer than 10 stocks qualify Costs: Size-tiered transaction costs (0.1% large-cap, 0.3% mid-cap, 0.5% small-cap)
Financial data uses a 45-day lag to prevent look-ahead bias. July rebalancing ensures annual filings are available. Trades execute at the next trading day's closing price to reflect realistic fill assumptions. Returns are in INR. Full methodology: Ceta Research Backtest Methodology.
For a detailed explanation of FCF Conversion as a quality signal and the academic research behind it, see the US FCF Conversion Quality post.
The Screen (SQL)
SELECT
  c.symbol, p.companyName,
  ROUND(c.freeCashFlow / NULLIF(i.netIncome, 0) * 100, 1) AS fcf_conversion_pct,
  ROUND(c.freeCashFlow / NULLIF(i.revenue, 0) * 100, 1) AS fcf_margin_pct,
  ROUND(k.returnOnEquityTTM * 100, 1) AS roe_pct,
  ROUND(r.operatingProfitMarginTTM * 100, 1) AS op_margin_pct,
  ROUND(k.marketCap / 1e9, 1) AS mktcap_bn
FROM cash_flow_statement_ttm c
JOIN income_statement_ttm i ON c.symbol = i.symbol
JOIN key_metrics_ttm k ON c.symbol = k.symbol
JOIN financial_ratios_ttm r ON c.symbol = r.symbol
JOIN profile p ON c.symbol = p.symbol
WHERE i.netIncome > 0 AND c.freeCashFlow > 0
  AND c.freeCashFlow / NULLIF(i.netIncome, 0) > 1.0
  AND c.freeCashFlow / NULLIF(i.netIncome, 0) < 3.0
  AND c.freeCashFlow / NULLIF(i.revenue, 0) > 0.10
  AND k.returnOnEquityTTM > 0.10
  AND r.operatingProfitMarginTTM > 0.10
  AND k.marketCap > 20e9  -- ₹20B (~$240M USD)
  AND p.exchange IN ('BSE', 'NSE')
ORDER BY c.freeCashFlow / NULLIF(i.netIncome, 0) DESC
LIMIT 30
Run this query on Ceta Research
What We Found
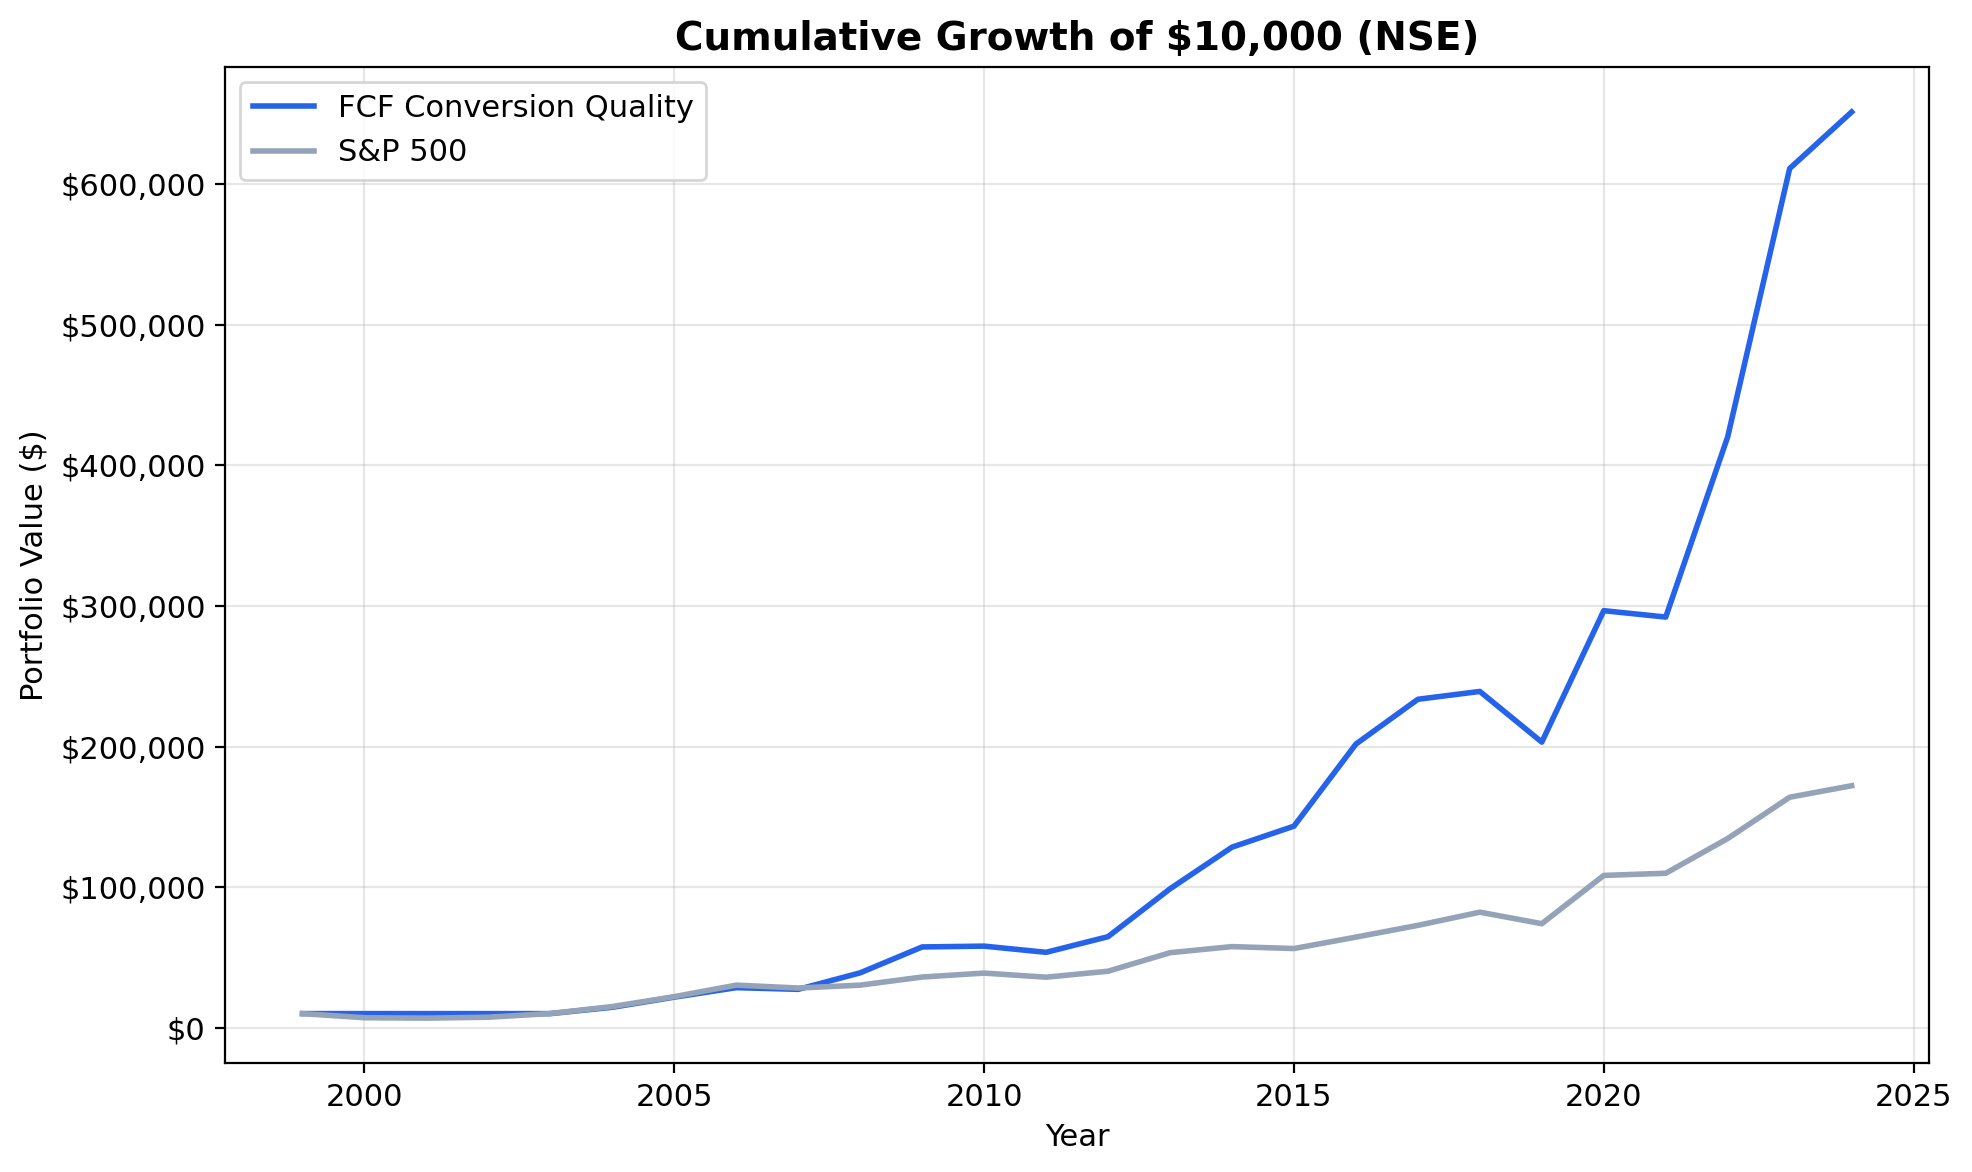
$10,000 grew to ~$651,000 in INR. The Sensex reached ~$172,000.
| Metric | FCF Conversion (INR) | Sensex |
|---|---|---|
| CAGR | 18.18% | 12.06% |
| Total Return | 6,414% | ~1,620% |
| Excess CAGR | +6.13% | - |
| Max Drawdown | -15.07% | -32% |
| Sharpe Ratio | 0.523 | - |
| Sortino Ratio | 1.795 | - |
| Down Capture | 25.31% | - |
| Win Rate (annual) | 60% | - |
| Avg Stocks per Period | 19.4 | - |
| Cash Periods | 4 of 25 | - |
The most striking number here is the max drawdown: -15.07%. The Sensex dropped -32% at its worst. The strategy cut drawdown in half while compounding at 18.18% annually.
A 6.13% annual excess over the Sensex doesn't sound as dramatic as the old SPY comparison, but consider the baseline. The Sensex returned 12.06% CAGR over this period, one of the strongest equity markets in the world. Beating that by 6% annually, with a down capture of just 25.31%, means the strategy captured the upside of India's growth story while sidestepping most of the pain.
The Sharpe ratio (0.523) and Sortino ratio (1.795) confirm the quality of the returns. Sortino penalizes only downside volatility, and the large gap between Sharpe and Sortino tells you the portfolio's volatility was skewed to the upside. When it moved, it moved up.
Annual Returns
| Year | Strategy (INR) | Sensex | Excess |
|---|---|---|---|
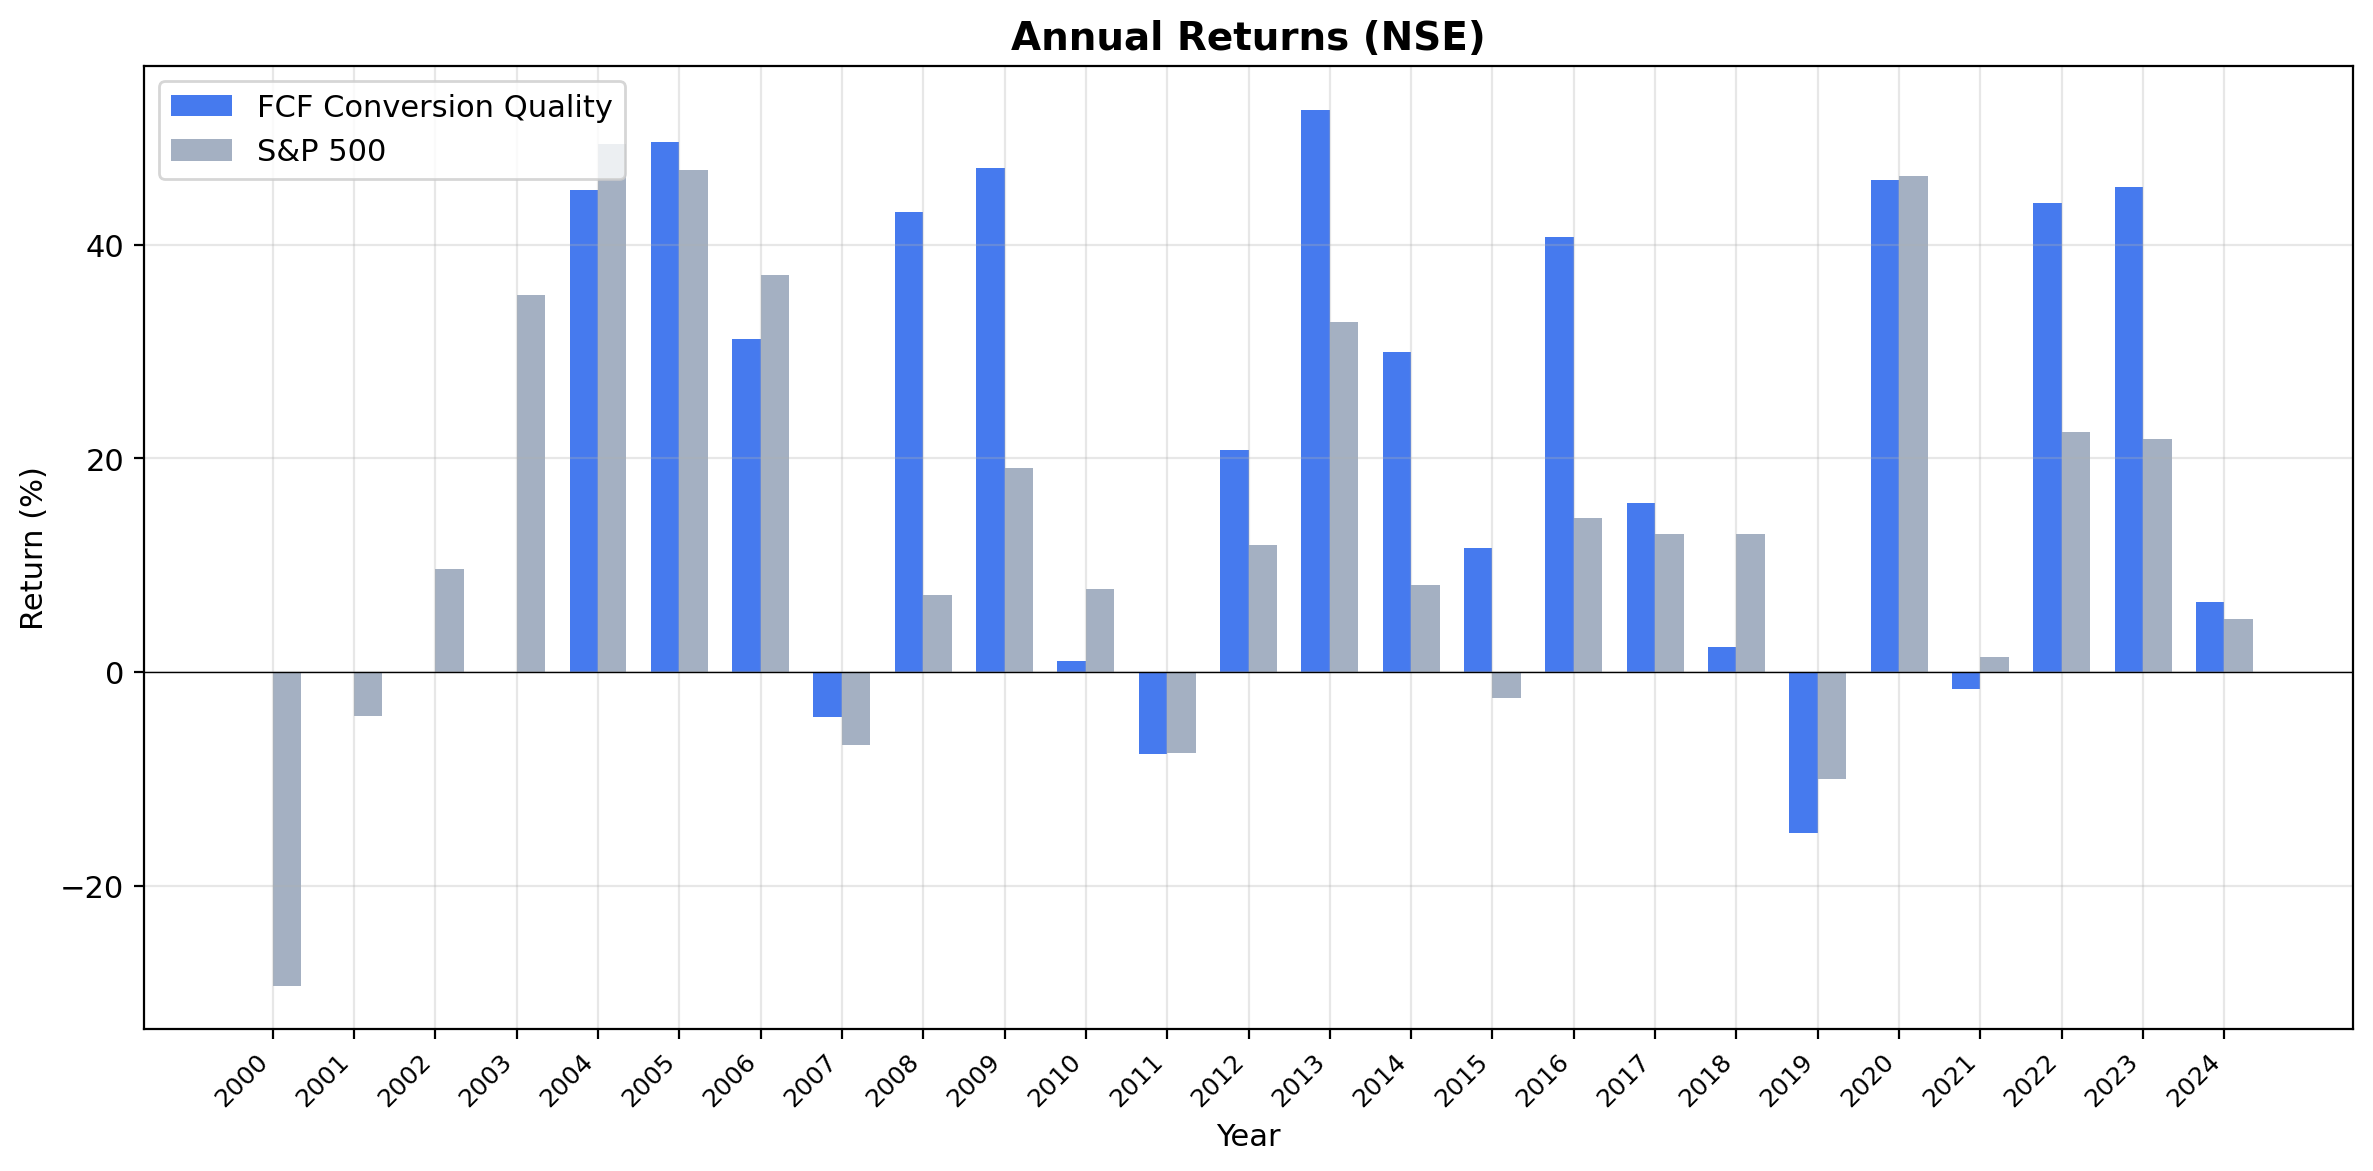
| 2008 | +43.1% | +7.3% | +35.8% |
| 2009 | +47.2% | +19.1% | +28.1% |
| 2013 | +52.6% | +32.8% | +19.8% |
| 2016 | +40.7% | +14.5% | +26.2% |
2008-2009: Back-to-back dominance
The strategy gained 43.1% in 2008 while the Sensex returned just 7.3%. Then in 2009, it followed up with 47.2% vs the Sensex's 19.1%. Two consecutive years of 25-35% excess returns. Indian companies converting earnings to real cash powered through the global financial crisis without missing a step.
2013 and 2016: The pattern repeats
In 2013, the strategy returned 52.6% vs the Sensex's 32.8%. In 2016, it returned 40.7% vs 14.5%. The signal works across different market regimes. Whether it's a broad rally where quality outpaces the index, or a recovery year where cash-rich companies lead, the pattern holds. The 60% win rate means the strategy beats the Sensex in three out of every five years.
When It Works
Broad market rallies. When the Sensex rips higher, cash-rich companies tend to participate fully and then some. The strategy's best years overlap with strong Sensex years, but with larger gains. Quality compounds faster than the index in bullish environments.
Rupee depreciation cycles. Many Indian companies passing the screen are exporters (IT services, pharma). When the Rupee weakens, their INR earnings grow even as global conditions deteriorate. This creates a natural hedge that's embedded in the strategy's return profile.
Domestic consumption growth. India's expanding middle class generates steady demand for consumer staples, healthcare, and financial services. Companies serving these markets produce consistent, high-quality cash flows that pass our filters year after year.
When It Struggles
Speculative rallies. When low-quality, high-momentum names lead the market, the quality filter lags. The 40% of years where the strategy underperforms the Sensex tend to be narrow, momentum-driven rallies.
Early data years. The first four years (2000-2003) were cash periods because too few Indian companies had the data coverage and market cap to pass all filters. India's equity market was smaller then.
Currency Context
Returns are in Indian Rupees. The Sensex benchmark is also in INR. Because both the strategy and the benchmark are denominated in the same currency, there's no currency mismatch in the excess return calculation. The 6.13% annual excess is a direct, apples-to-apples comparison.
Limitations
Cash drag. 4 of 25 periods were in cash (early years). The 18.18% CAGR includes those dead years.
Survivorship bias. Exchange membership uses current company profiles. Delisted Indian companies aren't fully captured in early years.
Market cap in INR. The ₹20B threshold (~$240M USD) targets liquid mid-cap and above. In USD terms, this is lower than the $1B threshold for US exchanges, reflecting India's different market size distribution.
Liquidity. Some qualifying stocks may have thin trading volumes. The backtest assumes frictionless execution at closing prices. Real slippage on Indian mid-caps can be material.
No local taxes modeled. India's Securities Transaction Tax (STT) and capital gains taxes aren't included.
Run It Yourself
Live screen:
python3 fcf-conversion/screen.py --preset india
Full backtest:
python3 fcf-conversion/backtest.py --preset india --output results.json --verbose
Code: github.com/ceta-research/backtests/tree/main/fcf-conversion
Part of a Series
This is the India edition of our FCF Conversion Quality analysis. We ran the same screen on 15 exchanges globally:
- FCF Conversion on US Stocks (NYSE + NASDAQ + AMEX) - 9.68% CAGR, the baseline
- Canada: highest Sharpe (0.443) among outperformers
- UK: 84% win rate, consistent across 22 invested years
- Global comparison: all exchanges side by side
Data: Ceta Research (FMP financial data warehouse), 2000-2025. Returns in INR. Benchmark: BSE Sensex Total Return. Execution: next-day close (MOC). Full methodology: github.com/ceta-research/backtests/blob/main/METHODOLOGY.md
Past performance does not guarantee future results. This is research content, not investment advice.


