
Germany: Roughly Matches the DAX, -50% Max Drawdown
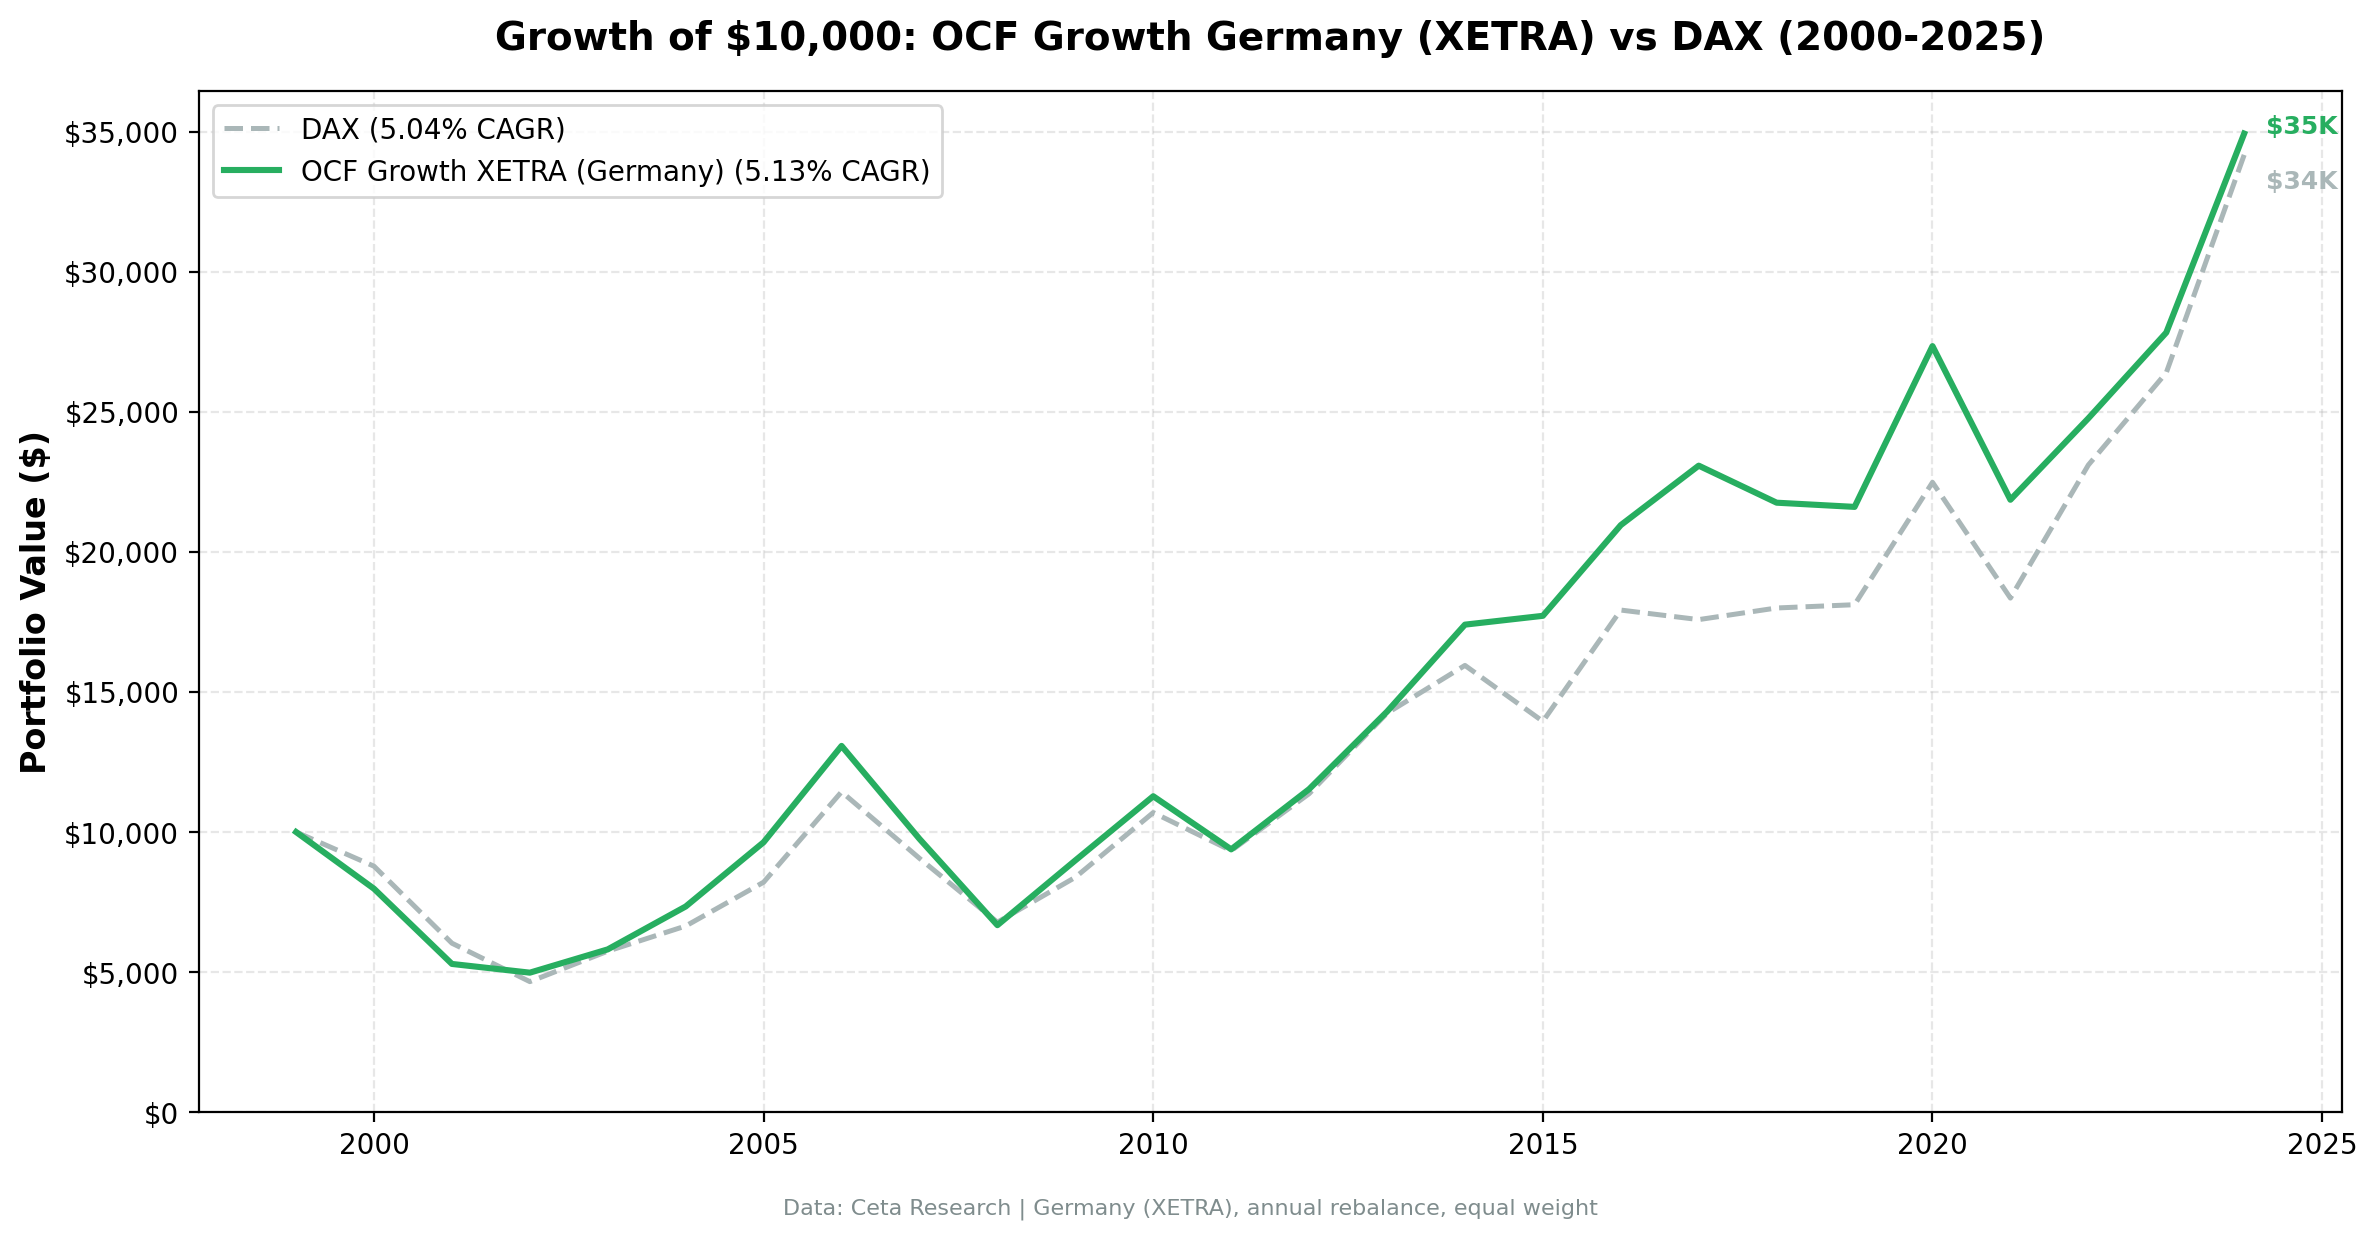
OCF momentum returned 5.1% annually on German stocks vs the DAX's 5.0%, essentially a match (+0.1%). A 36% win rate and a -50.2% max drawdown make it a rough ride for no edge.

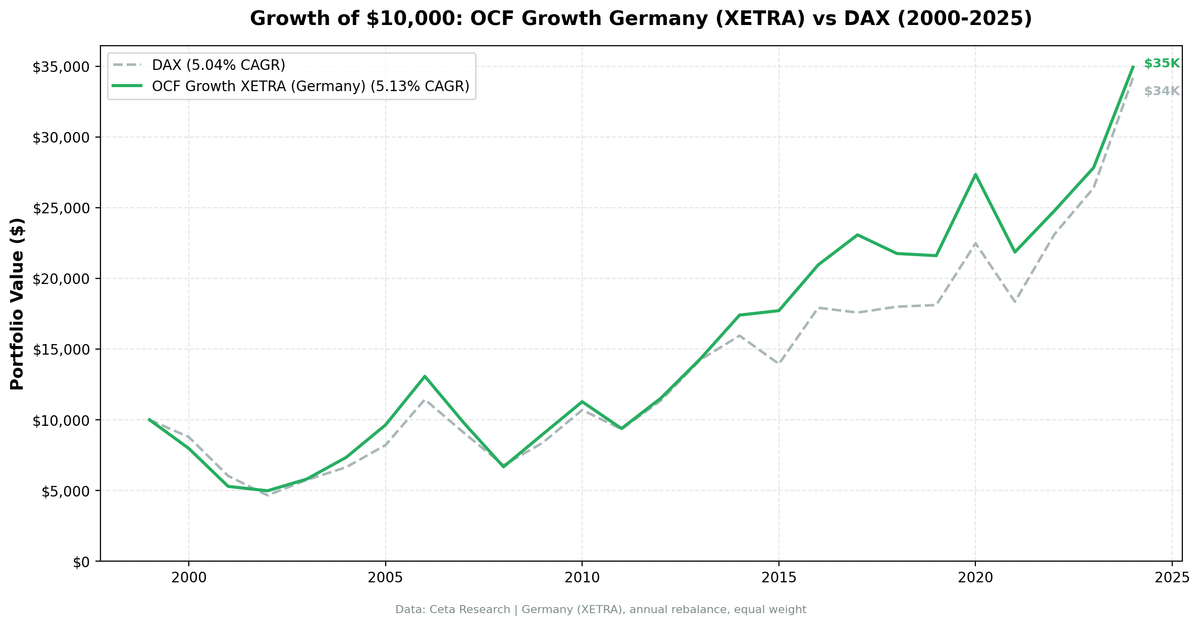
Operating cash flow momentum returned 5.1% annually on German stocks from 2000 to 2025, roughly matching the DAX (+0.1% per year). The DAX returned 5.0% annually. The strategy suffered a -50% max drawdown (worst among developed markets tested) and outperformed the DAX in 9 of 25 years (36% win rate). $10,000 grew to $34,946. The signal tracks the index in Germany but faces extreme cyclical swings in export-heavy industrials.
Contents
Data: FMP financial data warehouse, 2000–2025. Updated June 2026.
What We Found
| Metric | Germany (XETRA) | DAX |
|---|---|---|
| CAGR | 5.1% | 5.0% |
| Volatility | 21.7% | - |
| Max Drawdown | -50.2% | -53.4% |
| Sharpe | 0.14 | - |
| Win Rate (vs DAX) | 36% | - |
| Avg Stocks | 16.9 | - |
The -50% drawdown came from compounded underperformance in 2008-2014, not a single crash year. The strategy consistently picked the wrong German stocks during the eurozone crisis.
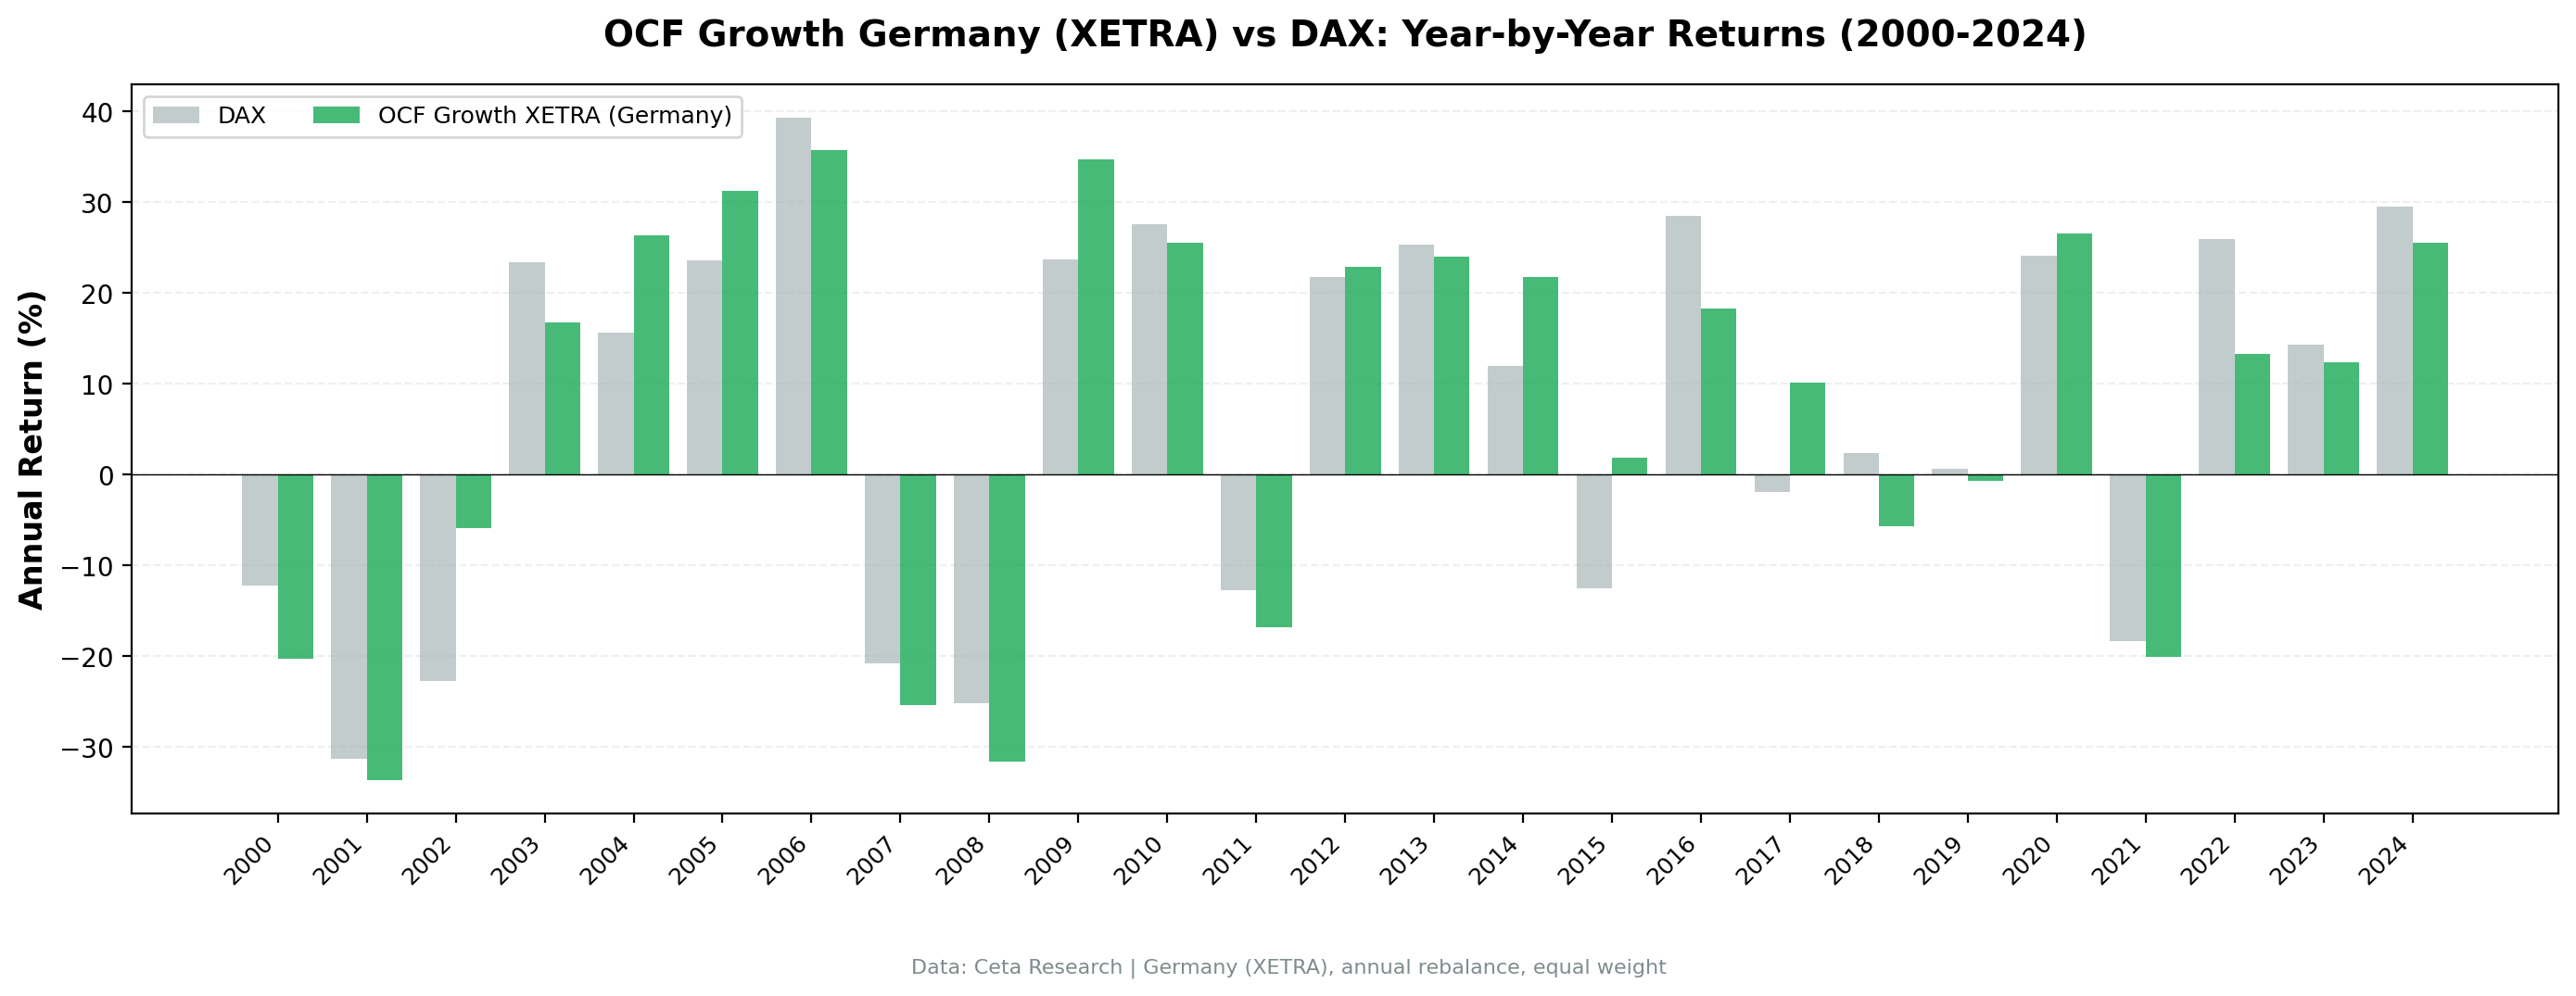
Why it struggled: German industrial companies (autos, machinery, chemicals) showed volatile OCF driven by working capital swings. The divergence signal misfired when earnings were more stable than cash flows.
Part of a Series: US Results | India Results | Canada Results | Global Comparison
Run It Yourself
Screen German stocks with OCF momentum on Ceta Research
Market cap threshold: €500M (~$545M USD), ROE > 10%, operating margin > 5%, OCF growth > NI growth.
Takeaway: Germany roughly matched the DAX (+0.1%) with brutal drawdowns (-50%). The signal tracks the index but cyclical swings in export-heavy industrials make it a rough ride. A 36% win rate shows it lagged the DAX in most years even as the totals converged.
Data: Ceta Research, XETRA 2000-2025. Full methodology: backtests/METHODOLOGY.md
Past performance does not guarantee future results. This is educational content, not investment advice.

