value investing
Value-Momentum on Indian Stocks: 15.87% CAGR Over 21 Years of NSE Data
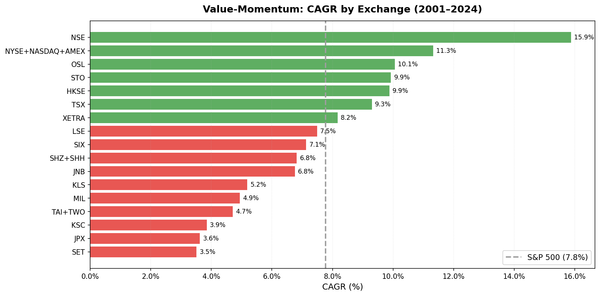
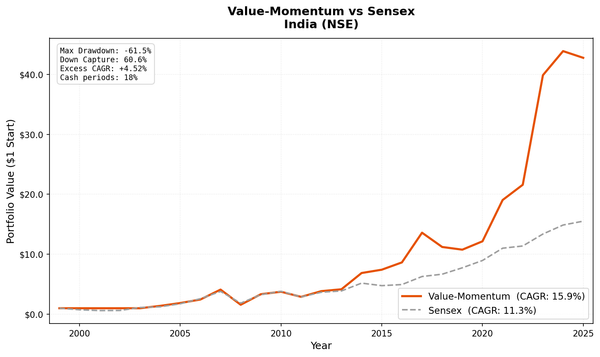
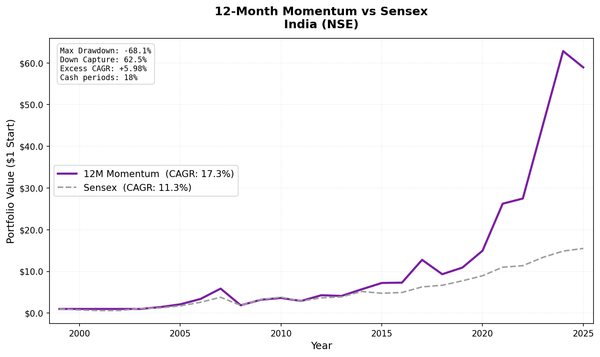
Value-momentum composite on NSE from 2004 to 2025. 15.87% CAGR, 4,176% total return. 61% down capture, 110% up capture, 5.67% annual alpha vs Sensex.
value investing
Value-momentum composite on NSE from 2004 to 2025. 15.87% CAGR, 4,176% total return. 61% down capture, 110% up capture, 5.67% annual alpha vs Sensex.
value investing
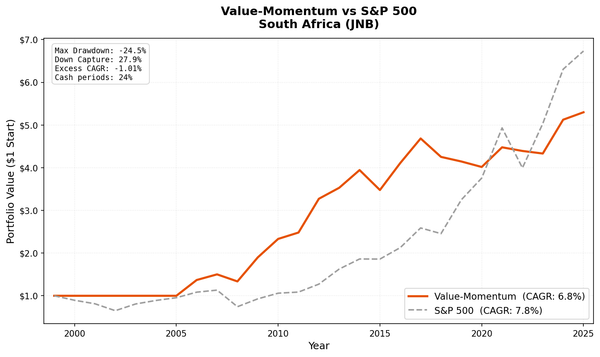
Value-momentum on JNB from 2006 to 2025. 6.76% CAGR with the shallowest drawdown of any exchange (-24.47%), but the strategy now trails SPY by 1.01% annually after data quality filtering.
value investing
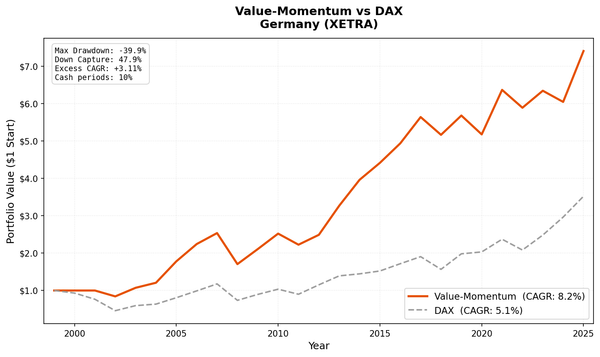
Value-momentum composite on XETRA from 2002 to 2025. 8.17% CAGR with +3.11% excess over DAX and 47.86% down capture against the local index. Mittelstand industrials fit the screen.
value investing
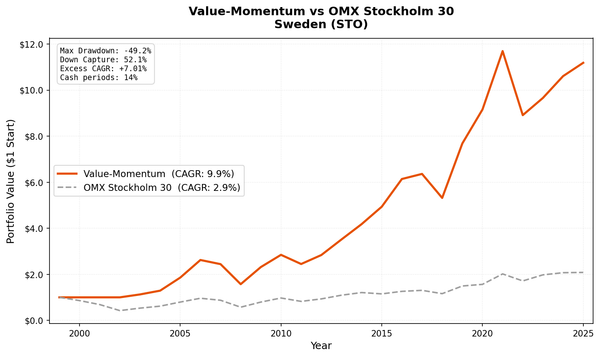
Value-momentum composite on Stockholm Exchange from 2003 to 2025. 9.93% CAGR with +7.01% excess return vs the OMX30, 52% down capture, and a 0.753 Sortino ratio.
value investing
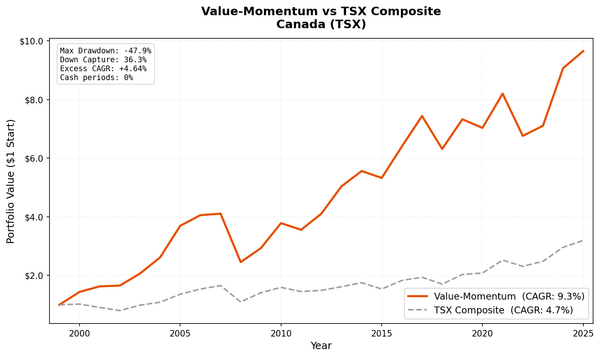
Value-momentum composite on Toronto Stock Exchange from 2000 to 2025. 9.30% CAGR with zero cash periods, 36% down capture vs TSX Composite, and a 66.67% win rate.
value investing
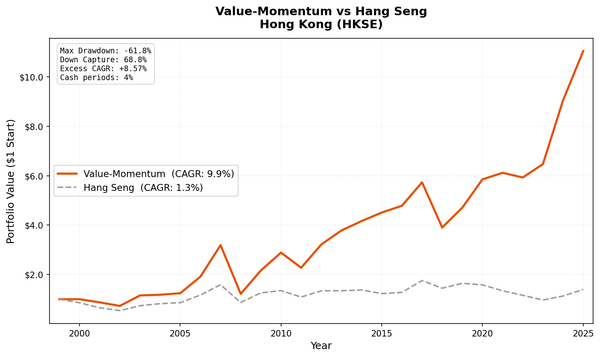
Value-momentum composite on HKSE from 2001 to 2025. 9.88% CAGR with +8.57% excess over Hang Seng. Deep drawdowns (-61.79%) but strong recoveries. Only 2 cash periods.
momentum investing
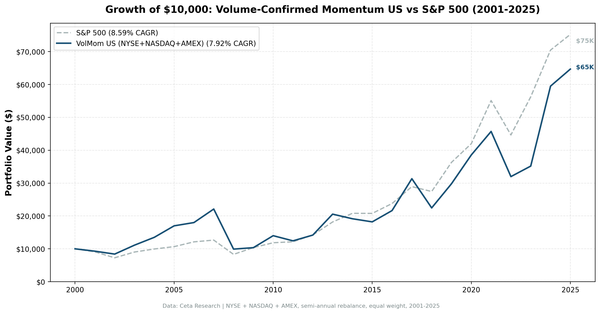
We added volume confirmation to 12-month momentum on US stocks: rising 3-month volume, positive earnings, positive cash flow. From 2001 to 2025, the strategy returned 7.66% annually vs 8.59% for SPY — with 148.3% down capture. Volume signals are noise in the world's most traded market.
momentum investing
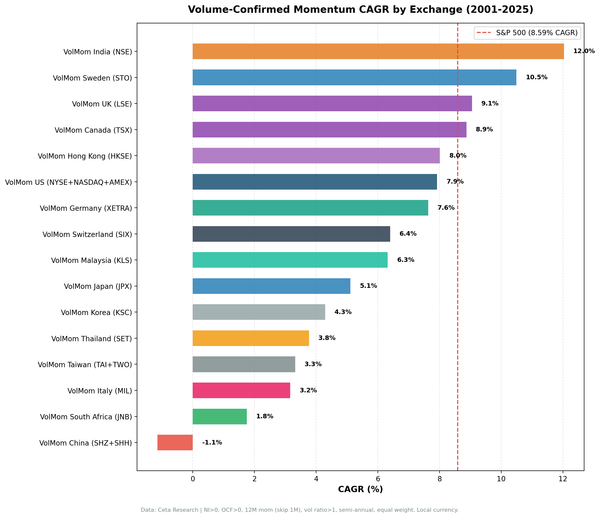
Volume-confirmed momentum on Swedish stocks returned 11.02% annually from 2001 to 2025, +7.34% over the OMX Stockholm 30 (3.68% CAGR). Sharpe ratio of 0.487 — highest of 17 global exchanges. Down capture of 34.75% and 29% cash periods define the strategy: defensive in crises, strong when invested.
momentum investing
Volume-confirmed momentum on Indian equities from 2001 to 2025: 12.21% CAGR with 70.6% down capture. Strong absolute returns, but the Sensex returned 13.18% over the same period. The factor provides downside protection but doesn't beat the index.
momentum investing
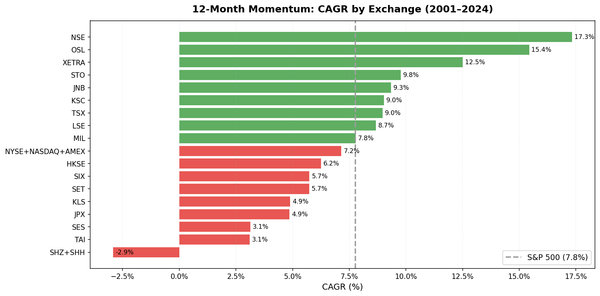
Same strategy, 17 global exchanges, 25 years. Volume-confirmed momentum returned +7.34% excess vs OMX Stockholm 30, +6.0% vs FTSE 100, but -0.97% vs Sensex in India and -0.92% vs S&P 500 in the US. The factor works where institutional volume is informative — and fails where it's noise.
momentum investing
Volume-confirmed momentum on Canadian equities from 2001 to 2025: 9.25% CAGR vs 4.75% for the TSX Composite, +4.49% annual excess return, Sharpe 0.428, and 32.4% down capture — the lowest of any exchange in this study. The commodity-driven TSX provides natural decorrelation.
momentum investing
We combined quality filters (ROE>15%, low debt, positive cash flow) with 12-month price momentum to screen US stocks from 2000 to 2025. The strategy returned 8.27% annually vs 7.75% for the S&P 500 — with 0% cash periods but 106.7% down capture.