
Value-Momentum on South African Stocks: Shallowest Drawdown, No Alpha
Value-momentum on JNB from 2006 to 2025. 6.76% CAGR with the shallowest drawdown of any exchange (-24.47%), but the strategy now trails SPY by 1.01% annually after data quality filtering.

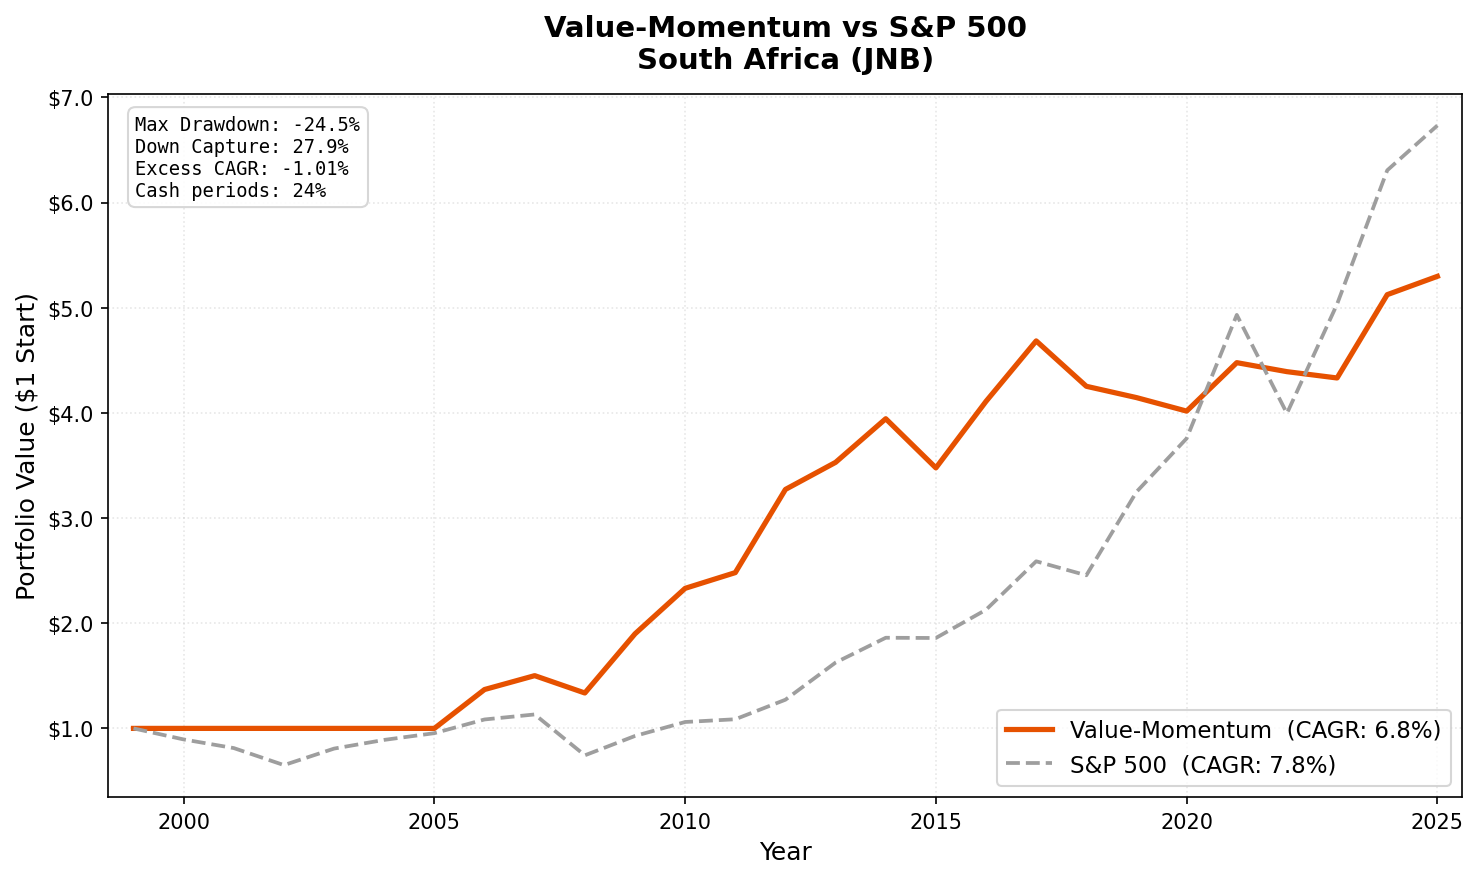
South Africa is the cleanest counter-example in our 17-exchange study. The value-momentum screen produced a -24.47% max drawdown over 25 years, the shallowest of any exchange. But the strategy doesn't beat the market anymore. 6.76% CAGR in ZAR vs SPY's 7.77%. After tightening the data quality filters, the JNB result lost most of the alpha previous runs reported.
Contents
The story isn't "crisis-proof alpha." It's "thin universe, lower volatility, no edge."
Data: FMP financial data warehouse, 2000–2025. Updated May 2026.
Method
| Parameter | Value |
|---|---|
| Universe | JNB (Johannesburg Stock Exchange) |
| Filters | P/E 0-20, ROE > 10%, D/E < 1.0 |
| Ranking | 12-month momentum, composite percentile |
| Rebalancing | Semi-annual (January, July) |
| Holding period | 6 months |
| Max positions | 30 stocks, equal weight |
| Cash rule | Fewer than 10 qualifying stocks |
| Market cap | > R10B (~$550M USD) |
| Data source | FMP via Ceta Research warehouse |
| Execution | Next-day close (MOC execution model) |
| Transaction costs | Size-tiered (0.1-0.5% one-way) |
| Data quality | Oscillation filter + 200% return cap + $1 minimum entry |
| Benchmark | S&P 500 (SPY) |
| Period | 2000-2025 (effective: 2006-2025) |
Note: FMP does not have a JSE All Share index (^J203.JO) in its stock_eod table. SPY is used as benchmark. Returns are in ZAR, so the comparison is cross-currency.
Based on Asness, Moskowitz, and Pedersen (2013). For the full methodology, see our US flagship post.
The Screen
-- Value-Momentum South Africa (JNB) Screen
-- Run at: cetaresearch.com/data-explorer?q=Sxsp_EN0WA

SELECT
    k.symbol,
    p.companyName,
    f.priceToEarningsRatioTTM as pe_ratio,
    k.returnOnEquityTTM * 100 as roe_pct,
    f.debtToEquityRatioTTM as debt_to_equity,
    p.marketCap / 1e9 as market_cap_billions
FROM key_metrics_ttm k
JOIN financial_ratios_ttm f ON k.symbol = f.symbol
JOIN profile p ON k.symbol = p.symbol
WHERE f.priceToEarningsRatioTTM > 0
    AND f.priceToEarningsRatioTTM < 20
    AND k.returnOnEquityTTM > 0.10
    AND f.debtToEquityRatioTTM >= 0
    AND f.debtToEquityRatioTTM < 1.0
    AND p.marketCap > 10e9
    AND p.exchange IN ('JNB')
  AND p.isFund = false
  AND p.isEtf = false
  AND p.isActivelyTrading = true
QUALIFY ROW_NUMBER() OVER (PARTITION BY p.companyName
                           ORDER BY p.averageVolume DESC) = 1
ORDER BY f.priceToEarningsRatioTTM ASC
LIMIT 100
What We Found
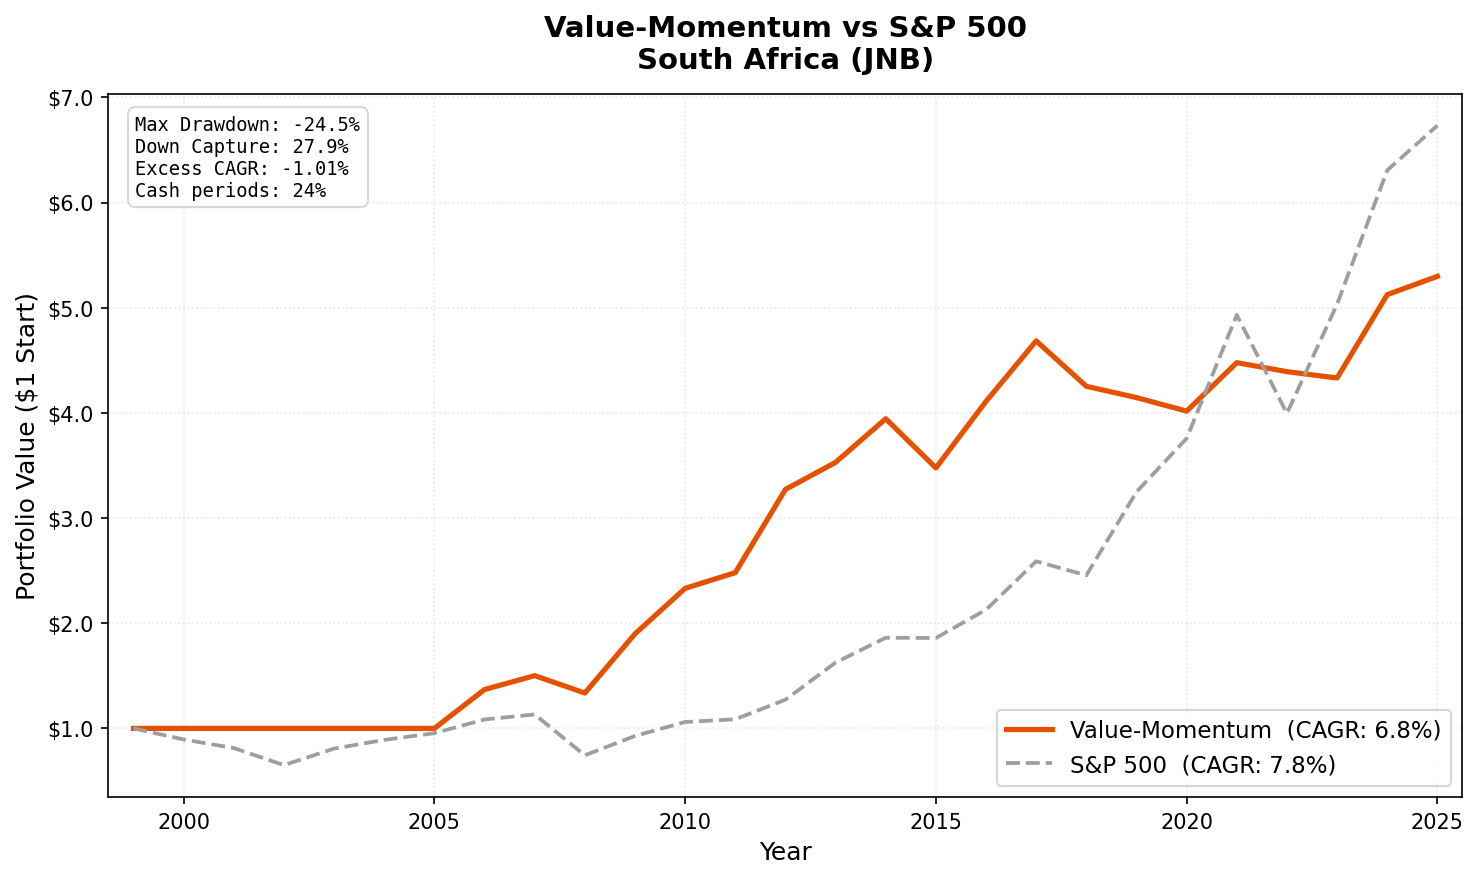
Full period summary (2006-2025):
| Metric | Value-Momentum | S&P 500 (SPY) |
|---|---|---|
| CAGR | 6.76% | 7.77% |
| Total Return | 429.84% | 573.34% |
| Max Drawdown | -24.47% | -38.01% |
| Volatility | 12.84% | 15.32% |
| Sharpe Ratio | -0.175 | -0.081 |
| Sortino Ratio | -0.246 | -0.107 |
| Calmar Ratio | 0.276 | 0.204 |
| Up Capture | 63.81% | 100% |
| Down Capture | 27.85% | 100% |
| Beta | 0.436 | 1.0 |
| Alpha | -1.70% | — |
| Win Rate | 50.98% | — |
| Cash Periods | 12 of 51 | — |
| Avg Stocks | 19.3 | — |
The drawdown profile is still the standout. -24.47% over 25 years is the shallowest of any exchange in the study. Volatility of 12.84% is also among the lowest. The portfolio absorbs only 28% of SPY's down periods.
But the absolute return is just 6.76% CAGR, below SPY's 7.77%. Excess return is -1.01% annualized. The Sharpe ratio is negative because South Africa's risk-free rate averaged around 9% through most of this period, well above the portfolio's actual return.
Why the numbers changed. Our previous run reported 11.61% CAGR with +3.85% excess. That figure didn't survive tighter data quality filtering. The current backtest applies an oscillation filter (removes phantom holiday rows and broken split adjustments) and caps single-period returns at 200% to reject FMP price artifacts. JNB has known adjClose oscillation issues in older periods, and removing them drops several stocks per rebalance. The average portfolio dropped from 25.4 stocks to 19.3, cash periods rose from 9 to 12, and a number of inflated single-stock returns disappeared. The honest figure is 6.76%.
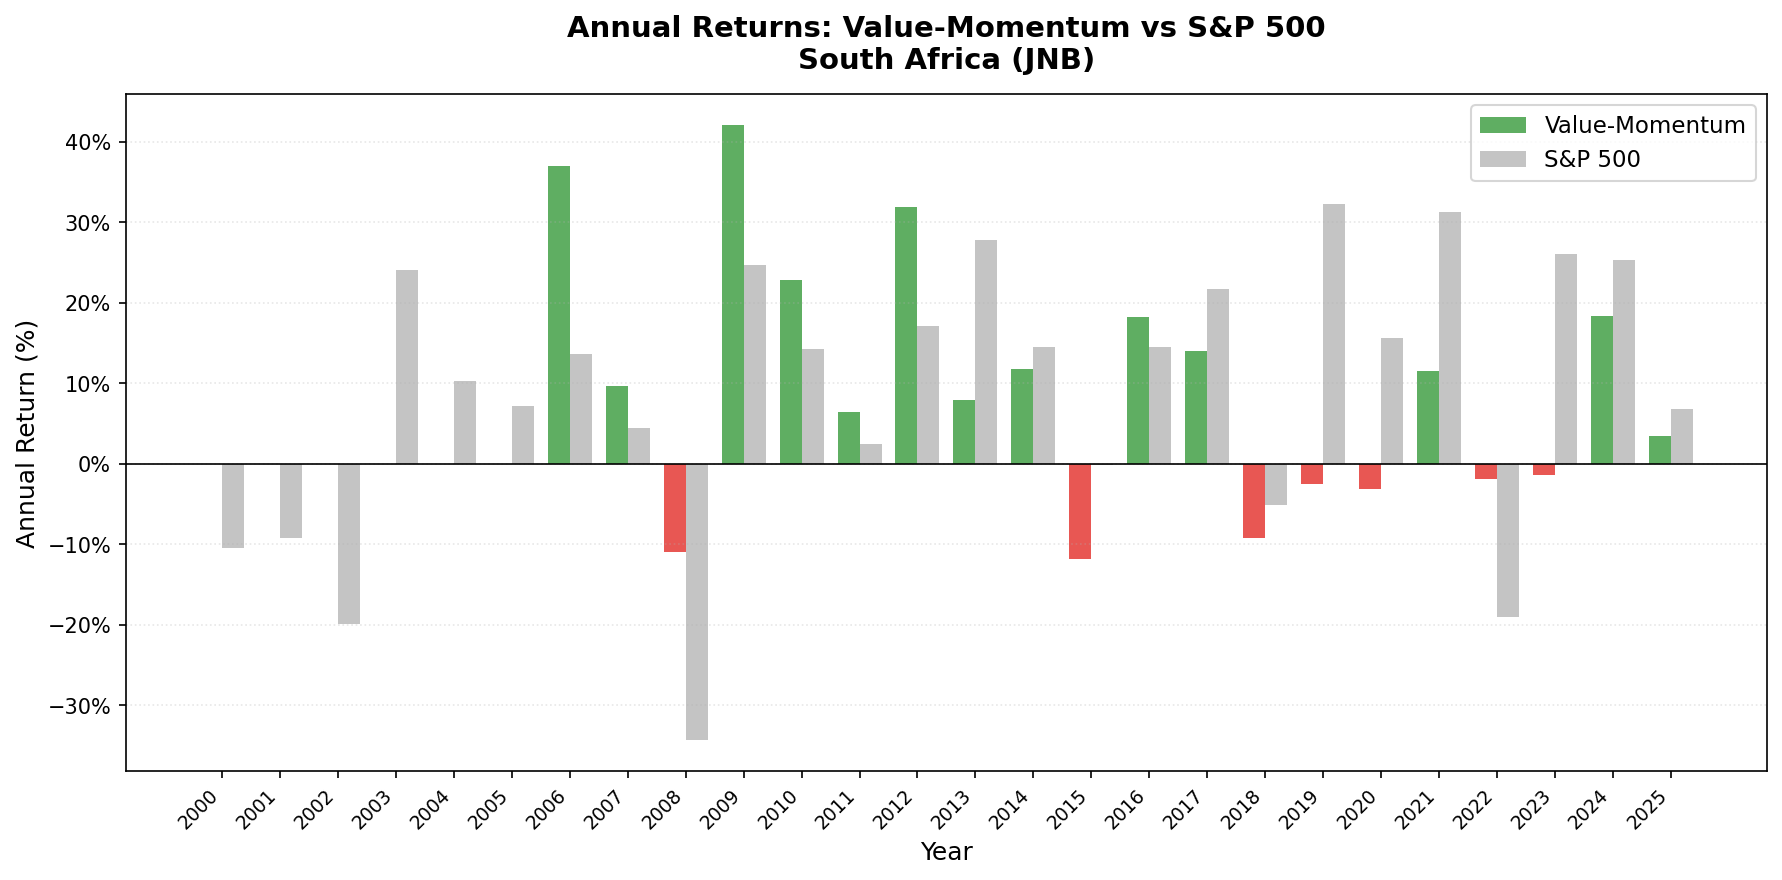
Year-by-year results:
| Year | Value-Momentum | SPY | Notes |
|---|---|---|---|
| 2000 | 0.00% | -10.50% | Cash |
| 2001 | 0.00% | -9.17% | Cash |
| 2002 | 0.00% | -19.92% | Cash |
| 2003 | 0.00% | +24.12% | Cash |
| 2004 | 0.00% | +10.24% | Cash |
| 2005 | 0.00% | +7.17% | Cash |
| 2006 | +36.97% | +13.65% | First invested year |
| 2007 | +9.63% | +4.40% | |
| 2008 | -10.99% | -34.31% | Crisis protection |
| 2009 | +42.09% | +24.73% | Strong bounce |
| 2010 | +22.78% | +14.31% | |
| 2011 | +6.41% | +2.46% | |
| 2012 | +31.88% | +17.09% | |
| 2013 | +7.87% | +27.77% | Trailed during US growth rally |
| 2014 | +11.75% | +14.50% | |
| 2015 | -11.85% | -0.12% | |
| 2016 | +18.20% | +14.45% | |
| 2017 | +13.98% | +21.64% | |
| 2018 | -9.21% | -5.15% | |
| 2019 | -2.53% | +32.31% | Trailed badly |
| 2020 | -3.10% | +15.64% | COVID, SA lockdowns |
| 2021 | +11.47% | +31.26% | Trailed US growth |
| 2022 | -1.91% | -18.99% | Near-flat while US fell |
| 2023 | -1.37% | +26.00% | Trailed badly |
| 2024 | +18.29% | +25.28% | |
| 2025 | +3.40% | +6.76% | YTD |
Key Observations
The 2008 result still holds. -10.99% vs SPY's -34.31%. South Africa's value universe, after filtering for low P/E, high ROE, and low leverage, skews toward domestic consumer businesses, retailers, and financial services. Mining and commodity companies, the names most correlated with global risk-off events, often trade above a P/E of 20 during boom cycles, so the value filters naturally exclude them. The 27.85% down capture confirms the portfolio absorbs much less than the average market's losses.
The 2019-2023 trail is the new problem. SPY returned +32.31%, +15.64%, +31.26%, -18.99%, +26.00%. The JNB portfolio returned -2.53%, -3.10%, +11.47%, -1.91%, -1.37%. Four out of five years negative or near-zero. Loadshedding (rolling power blackouts), political uncertainty, and sustained rand weakness weighed on domestic businesses. The strategy can't protect against sustained local macro headwinds, and the gap to SPY widened during exactly the years US growth stocks led.
12 cash periods. The thin filtered universe means the screen runs into the under-10-stocks rule frequently, especially in years when even the qualifying names couldn't pass the data quality guards. Average portfolio is 19.3 stocks per period, well below the 30-stock target.
Limitations
Returns are in ZAR. The rand depreciated heavily against the US dollar over this period. International investors would see lower returns after currency conversion. The 6.76% CAGR is a ZAR figure.
Cross-currency benchmark. SPY is used as benchmark because FMP lacks JSE All Share index data. ZAR returns vs USD SPY is an imperfect comparison. The low down capture partly reflects currency divergence during crises.
Thin universe. Average of 19.3 stocks per period (target is 30). 12 cash periods. South Africa's exchange is smaller than the US, India, or European markets, and the data quality filters tighten it further.
Negative Sharpe. South Africa's risk-free rate (averaged ~9%) makes any return below 9% produce a negative Sharpe ratio. The Calmar of 0.276 (CAGR divided by max drawdown) is the better risk-adjusted metric here, and it remains above SPY's 0.204.
No alpha. The -1.01% excess CAGR and -1.70% Jensen's alpha mean the portfolio isn't generating excess return over its market beta exposure. The case for JNB is now entirely about risk reduction, not return enhancement.
Takeaway
Value-momentum on JNB delivers the best drawdown profile in our 17-exchange study (-24.47% max DD, 27.85% down capture vs SPY), but at a real cost: it underperforms SPY by 1.01% annually and posts a negative Sharpe against a 9% local risk-free rate. The 2006-2012 stretch was strong; the 2019-2023 stretch destroyed the alpha story. If you want the lowest-drawdown exposure in a global value portfolio, JNB still does the job. If you want alpha, this isn't the market.
The previous version of this analysis showed +3.85% excess over SPY. Tighter data quality filtering (oscillation removal and single-stock return capping) removed enough inflated returns to drop the CAGR by nearly 5 percentage points. That correction is the honest result.
Part of a Series
Data: Ceta Research. FMP financial data warehouse, 2000-2025.
Past performance does not guarantee future results. This is research content, not investment advice.

