
One Composite Screen, 17 Exchanges: Where Value-Momentum Works Around the World
We backtested value-momentum on 17 exchanges over 25 years with local benchmarks. 12 of 17 beat their reference benchmark. India leads at 15.87% CAGR. Hong Kong has the highest alpha (+8.57% vs Hang Seng).

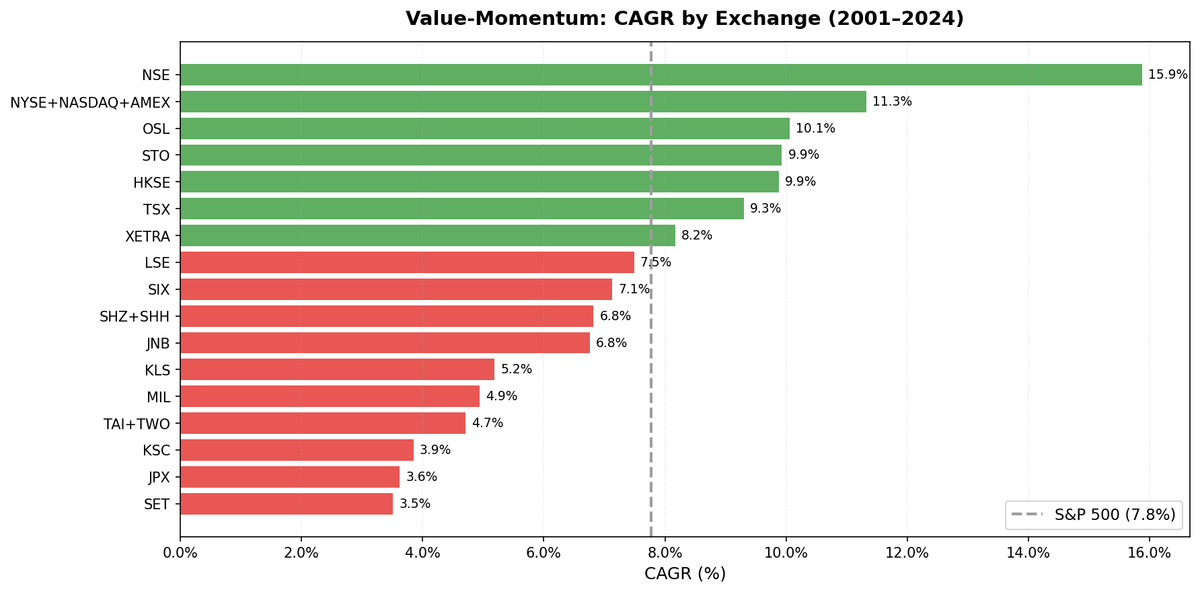
We ran a single value-momentum composite on 17 stock exchanges spanning 25 years. Same filters, same ranking, same rebalancing everywhere. Each exchange is measured against its own local index where one exists, otherwise SPY. 12 of the 17 beat their reference benchmark. India led at 15.87% CAGR, but the more striking finding is how consistently this strategy generated within-market alpha in developed markets.
Contents
- The Screen
- Full Results: All 17 Exchanges
- The Top Tier: High Alpha vs Local Benchmarks
- Marginal Results
- Underperformers: Five Exchanges That Lost to Their Benchmark
- Key Insights
- Currency Warning
- Takeaway
- Part of a Series
Data: FMP financial data warehouse, 2000–2025. Updated May 2026.
The Screen
P/E between 0 and 20. ROE above 10%. D/E below 1.0. Stocks that pass get ranked by a composite percentile score combining value and 12-month momentum. Top 30, equal weight, rebalanced semi-annually. Entry uses next-day close (MOC execution model). Transaction costs are size-tiered (0.1-0.5% one-way). Single-stock returns are capped at 200% and entries below $1 are excluded as data quality guards. The approach follows the Asness, Moskowitz, and Pedersen (2013) finding that value and momentum, combined, produce more stable alpha than either factor alone.
Full methodology and US-specific analysis: Value-Momentum US.
Full Results: All 17 Exchanges
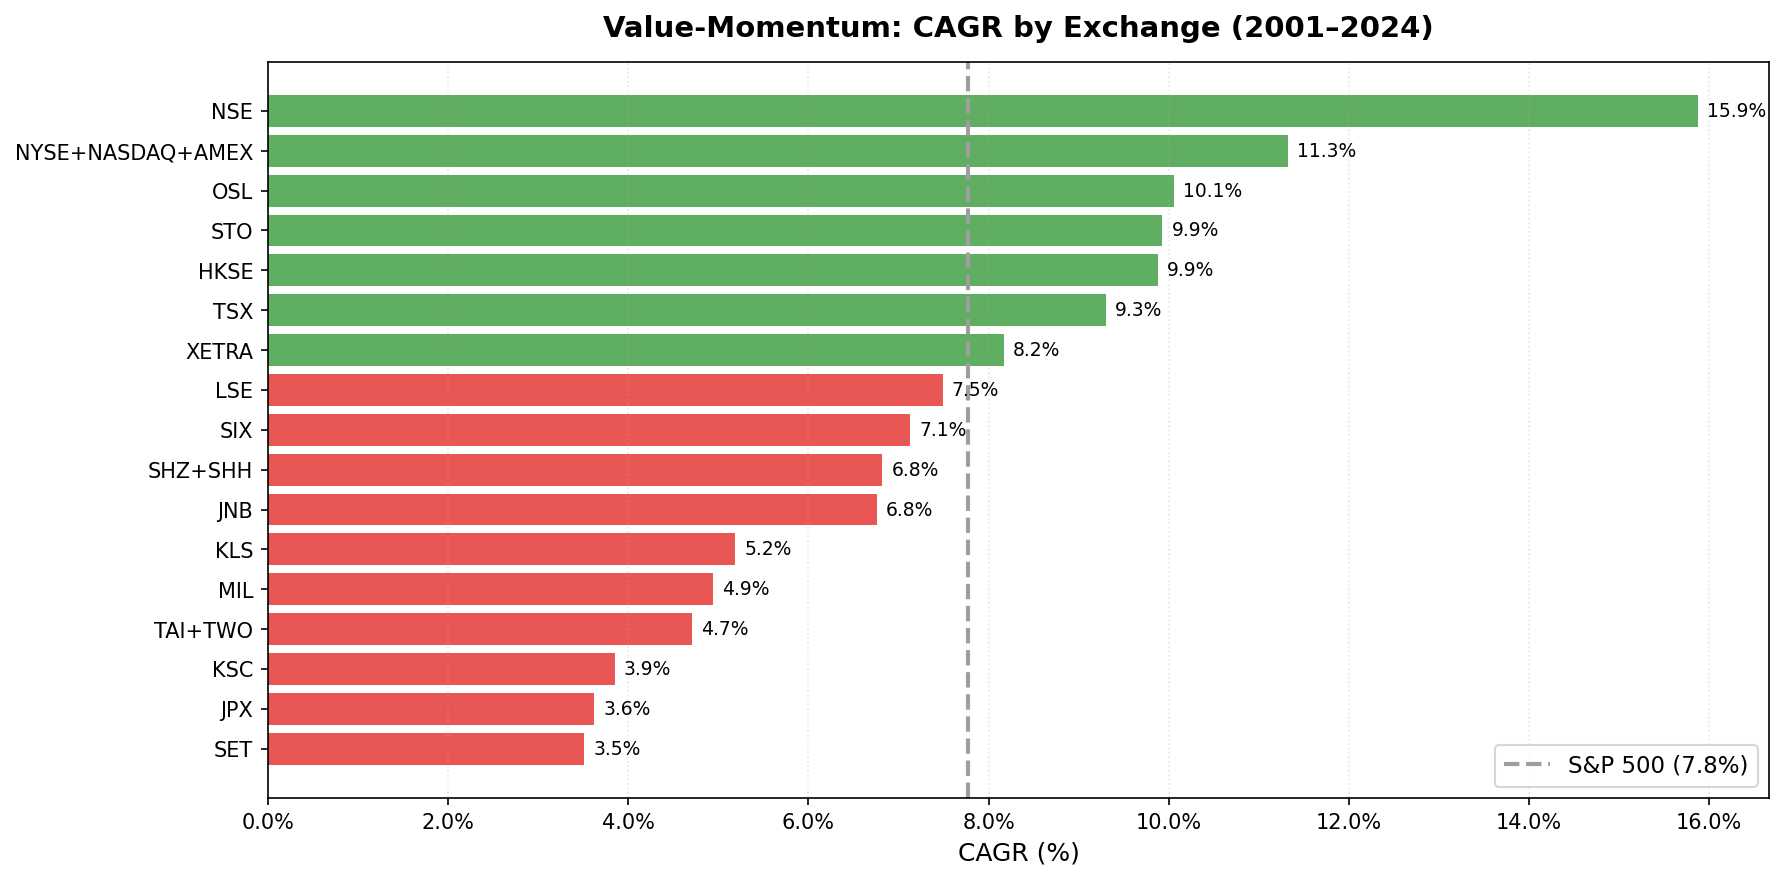
Each exchange is compared to its local index in the same currency where available. This gives a more honest measure of alpha than a cross-currency SPY comparison. Exchanges without a local index in the dataset (JNB, MIL, KLS) fall back to SPY.
| Exchange | CAGR | Benchmark | Excess | Sharpe | Max DD | Cash% | Avg Stocks |
|---|---|---|---|---|---|---|---|
| NSE (India) | 15.87% | Sensex | +4.52% | 0.327 | -61.53% | 18% | 29.3 |
| NYSE+NASDAQ+AMEX (US) | 11.32% | S&P 500 | +3.56% | 0.436 | -53.95% | 0% | 29.6 |
| OSL (Norway) | 10.06%** | Oslo All Share | -1.14% | 0.681 | -14.72% | 57% | 12.8 |
| STO (Sweden) | 9.93% | OMX Stockholm 30 | +7.01% | 0.425 | -49.23% | 14% | 27.0 |
| HKSE (Hong Kong) | 9.88% | Hang Seng | +8.57% | 0.270 | -61.79% | 4% | 25.0 |
| TSX (Canada) | 9.30% | TSX Composite | +4.64% | 0.411 | -47.91% | 0% | 28.5 |
| XETRA (Germany) | 8.17% | DAX | +3.11% | 0.387 | -39.90% | 10% | 28.0 |
| LSE (UK) | 7.49% | FTSE 100 | +6.40% | 0.223 | -36.74% | 0% | 28.2 |
| SIX (Switzerland) | 7.13% | SMI | +5.15% | 0.431 | -44.87% | 14% | 26.2 |
| SHZ+SHH (China) | 6.82% | SSE Composite | +3.11% | 0.116 | -60.66% | 0% | 27.3 |
| JNB (South Africa) | 6.76% | SPY* | -1.01% | -0.175 | -24.47% | 24% | 19.3 |
| KLS (Malaysia) | 5.19% | SPY* | -2.57% | 0.223 | -33.61% | 25% | 22.9 |
| MIL (Italy) | 4.94% | SPY* | -2.82% | 0.117 | -49.46% | 37% | 14.9 |
| TAI+TWO (Taiwan) | 4.71% | TAIEX | +0.93% | 0.191 | -45.67% | 22% | 28.4 |
| KSC (Korea) | 3.85% | KOSPI | -0.42% | 0.050 | -37.87% | 29% | 29.0 |
| JPX (Japan) | 3.62% | Nikkei 225 | +0.69% | 0.159 | -67.55% | 18% | 29.2 |
| SET (Thailand) | 3.51% | SET Index | +0.30% | 0.058 | -49.69% | 18% | 28.5 |
* No local index in FMP dataset. SPY used as cross-currency benchmark. ** Norway benchmark (^OSEAX) only has data from 2013. Results cover 12 years, not 25. Not directly comparable.
The Top Tier: High Alpha vs Local Benchmarks
Hong Kong (HKSE): +8.57% vs Hang Seng, 9.88% CAGR. The largest excess return of any exchange. Down capture of 68.78% against the Hang Seng means real protection in local terms. The -61.79% max drawdown is severe in absolute terms, but the Hang Seng itself was worse. Beta of 1.071 against the local index tells a different story than a cross-currency comparison: the portfolio tracks the local market closely but with strong alpha on top. Full analysis: Value-Momentum Hong Kong.
Sweden (STO): +7.01% vs OMX Stockholm 30, 9.93% CAGR. The second-largest alpha when measured against local benchmarks. Down capture of 52.15% shows genuine downside protection that wasn't visible in older cross-currency comparisons. Sweden's industrial base produces exactly the kind of companies this screen targets. Sortino of 0.753 confirms the return distribution is favorably skewed. Full analysis: Value-Momentum Sweden.
UK (LSE): +6.40% vs FTSE 100, 7.49% CAGR. The UK is the cleanest "within-market alpha" story. Win rate of 72.55% is the highest of any exchange. Down capture of 52.63% and up capture of 151.74% against the FTSE 100. The FTSE 100 has been one of the weakest developed-market indices over 25 years; value-momentum stocks within the UK comfortably beat the UK index even if they couldn't match the S&P 500.
Switzerland (SIX): +5.15% vs SMI, 7.13% CAGR. Sharpe of 0.431 is the highest among non-US developed markets. Down capture of 58.91% against the SMI is strong. The SMI is concentrated in a few mega-caps (Nestle, Novartis, Roche). The broader value-momentum portfolio diversifies away from that concentration.
Canada (TSX): +4.64% vs TSX Composite, 9.30% CAGR. Zero cash periods and 36.29% down capture make Canada the most consistent non-US result. The portfolio absorbed about a third of the TSX Composite's losses while participating fully in its gains. Full analysis: Value-Momentum Canada.
India (NSE): +4.52% vs Sensex, 15.87% CAGR. Still the highest CAGR by a wide margin. 4.52% annual excess over a strong local index for 21 effective years is a genuinely impressive result. Down capture of 60.60% vs the Sensex provides meaningful protection. Full analysis: Value-Momentum India.
US (NYSE+NASDAQ+AMEX): +3.56% vs S&P 500, 11.32% CAGR. The deepest universe (0% cash, 29.6 avg stocks) and the highest Sharpe among the alpha-positive group at 0.436. Down capture of 79.35% is moderate. Full analysis: Value-Momentum US.
China (SHZ+SHH): +3.11% vs SSE Composite, 6.82% CAGR. Positive alpha, but with -60.66% max drawdown. The SSE Composite is volatile enough that even modest stock selection beats the index.
Germany (XETRA): +3.11% vs DAX, 8.17% CAGR. Down capture of 47.86% against the DAX is among the lowest. The DAX returned about 5% CAGR over the same window, so 3.11% excess is meaningful in relative terms. Full analysis: Value-Momentum Germany.
Marginal Results
Taiwan (TAI+TWO): +0.93% vs TAIEX, 4.71% CAGR. Barely positive against the local index. Taiwan's tech-heavy market doesn't produce enough qualifying value stocks. 22% cash periods.
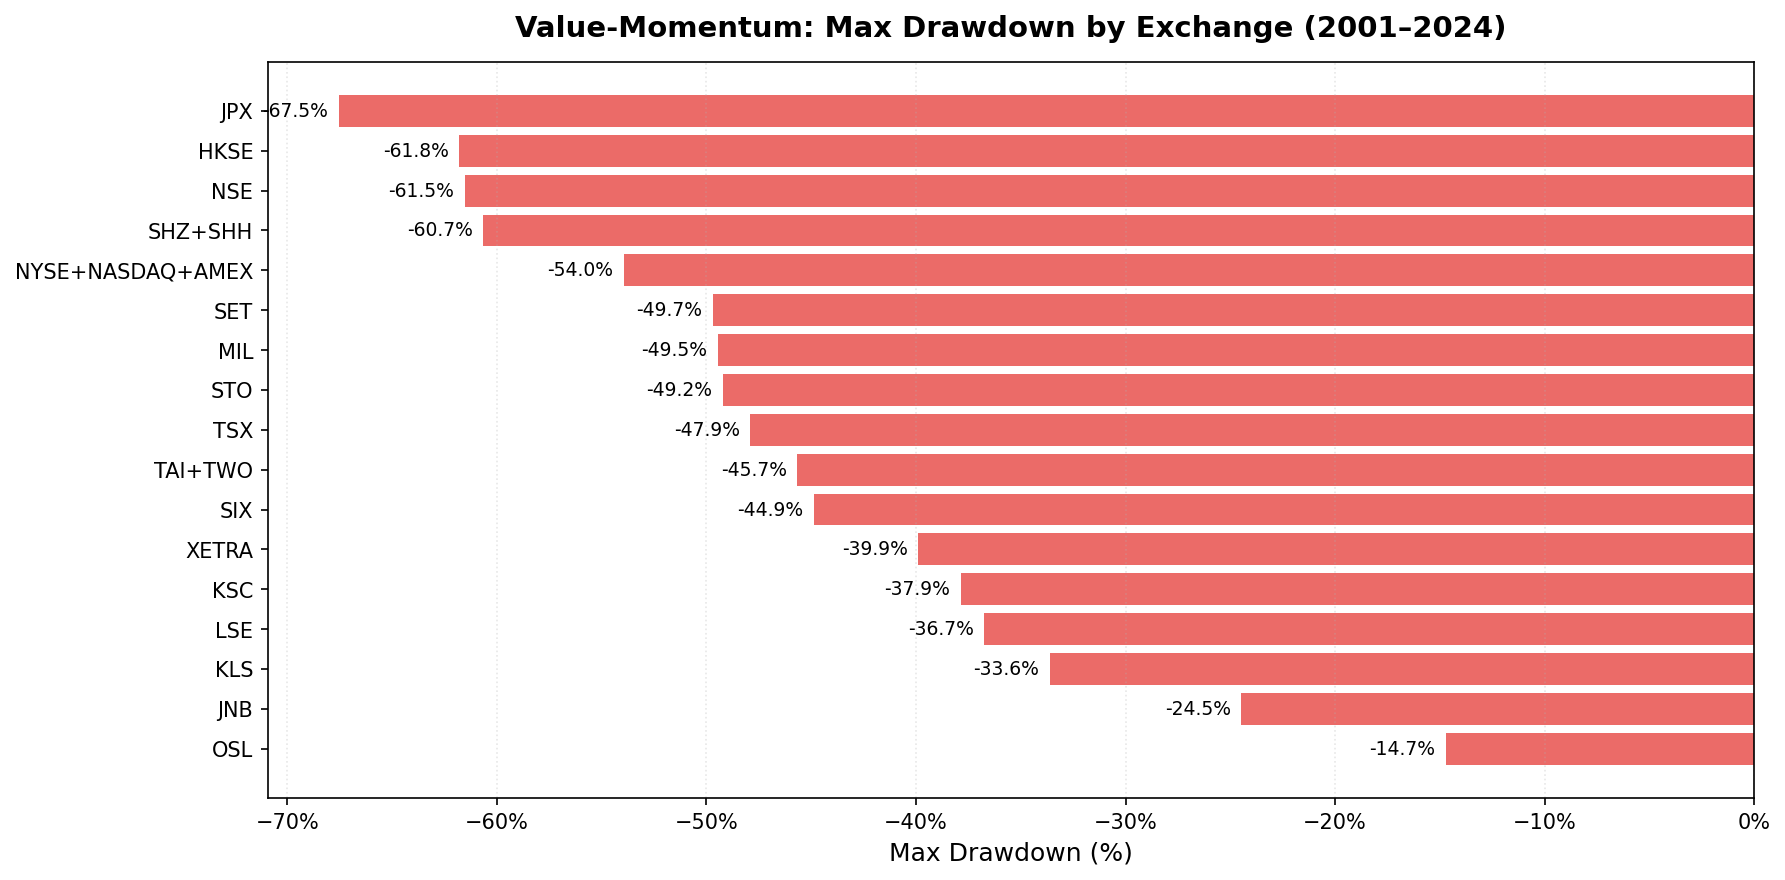
Japan (JPX): +0.69% vs Nikkei, 3.62% CAGR. Barely positive excess. -67.55% max drawdown is the worst of all 17 exchanges. Japan's deflation cycle punished value screens, but the strategy at least kept pace with the Nikkei. The 2023-2024 surge suggests the environment may be shifting.
Thailand (SET): +0.30% vs SET Index, 3.51% CAGR. Essentially flat vs the local index. Thin coverage and a Sharpe near zero.
Underperformers: Five Exchanges That Lost to Their Benchmark
| Exchange | CAGR | Benchmark | Excess | Key Issue |
|---|---|---|---|---|
| OSL (Norway) | 10.06%** | Oslo All Share | -1.14% | 57% cash, benchmark only from 2013 |
| JNB (South Africa) | 6.76% | SPY* | -1.01% | Thin universe (19 stocks avg), no local benchmark, cross-currency |
| KSC (Korea) | 3.85% | KOSPI | -0.42% | 29% cash, chaebol structure fails D/E filter |
| KLS (Malaysia) | 5.19% | SPY* | -2.57% | Cross-currency benchmark, small market |
| MIL (Italy) | 4.94% | SPY* | -2.82% | 37% cash, only 15 stocks avg, cross-currency |
JNB and MIL moved from "marginal" in earlier runs to underperformers after tighter data quality filtering. Both have thin filtered universes that suffer when the oscillation and return-cap guards remove additional stocks. Full analysis of the JNB drop: Value-Momentum South Africa.
Korea is the closest to neutral. The -0.42% shortfall might reverse with a few years of different data. The structural issue is that chaebols (Samsung, Hyundai, SK) carry higher leverage than the D/E < 1.0 filter allows, so the screen misses the companies that drive the KOSPI.
Norway has a structural mismatch: 57% cash means the screen couldn't find enough qualifying stocks more than half the time. The -1.14% excess should be treated with caution since benchmark data only starts in 2013.
Key Insights
12 of 17 beat their reference benchmark. That's a 71% hit rate. When measured against local benchmarks (where available), value-momentum produces alpha in most developed markets and several emerging ones.
Local benchmarks reveal real within-market alpha. Several exchanges (HKSE +8.57%, STO +7.01%, LSE +6.40%, SIX +5.15%) produce strong excess returns against their own indices that wouldn't show up in a cross-currency SPY comparison. The strategy generates alpha within markets. The question is whether the market itself keeps up with the S&P 500.
Down capture separates the top tier. Norway (-9.77%), Canada (36.29%), Germany (47.86%), Switzerland (58.91%), Sweden (52.15%), and UK (52.63%) all absorbed less than 60% of their local index's drawdowns. South Africa's 27.85% vs SPY is the lowest absolute number but uses a cross-currency benchmark.
Asia-Pacific: alpha exists but drawdowns are severe. Japan (+0.69%), Taiwan (+0.93%), and China (+3.11%) all generated positive excess vs their local indices. But max drawdowns of -67.55%, -45.67%, and -60.66% make the ride brutal.
Data quality matters. JNB dropped from a previous 11.61% CAGR to 6.76% after the oscillation filter and single-stock return cap removed inflated price moves. MIL fell from 9.15% to 4.94% for the same reason. Markets with known FMP data quality issues see returns drop when those issues are filtered out. The drop is the honest result.
Currency Warning
All returns are in local currency. An investor buying Indian stocks in INR would face currency conversion. India's 15.87% CAGR in INR terms won't translate directly to 15.87% in USD. The same applies to every non-US exchange. The excess returns shown here measure the strategy's effectiveness in its home market vs its home index where available, not what a US-based investor would actually receive.
These benchmarks leave dividends out. Portfolio returns here use dividend-adjusted prices, so they include dividends. Most of the indices we measure against do not. The FTSE 100, Hang Seng, KOSPI, Nikkei 225, OMX Stockholm 30, Oslo All Share, SET Index, SMI, SSE Composite, Sensex, TAIEX and TSX Composite are price indices, so excess return against them is overstated by roughly the local dividend yield, which has run between about 1.3% and 3.5% in these markets. Those comparisons are like for like: the S&P 500 figure runs through SPY, which is dividend-adjusted; the DAX is a performance index. Subtract the yield and only 9 of those 12 keep a positive edge. The ones that do not survive it are Taiwan, Japan and Thailand.
Takeaway
Value-momentum composites work in most markets. 12 of 17 exchanges beat their reference benchmark. Only 9 of those 12 keep the edge once you allow for the dividends those price indices leave out. The strategy generates genuine within-market alpha, especially across developed European markets and India.
The standout finding: Hong Kong's +8.57% excess and Sweden's +7.01% are the largest alpha figures when measured against local indices. India combines the highest absolute CAGR (15.87%) with strong alpha (+4.52% vs Sensex). For downside protection, Canada's 36% down capture and South Africa's -24.47% max drawdown are in a class of their own.
Five out of 17 lost to their reference index (Norway, South Africa, Korea, Malaysia, Italy). The pattern is consistent: thin universes after filtering, cross-currency benchmarks, or structural screening mismatches with the local market's dominant sectors.
Part of a Series
- Value-Momentum: US Stocks (11.32% CAGR)
- Value-Momentum: India (15.87% CAGR)
- Value-Momentum: Sweden (9.93% CAGR)
- Value-Momentum: South Africa (6.76% CAGR)
- Value-Momentum: Hong Kong (9.88% CAGR)
- Value-Momentum: Canada (9.30% CAGR)
- Value-Momentum: Germany (8.17% CAGR)
Data: FMP warehouse via Ceta Research. 2000-2025 backtest, semi-annual rebalancing, next-day close execution, oscillation filter + return cap data quality guards. Full methodology in the US deep-dive.
Past performance does not guarantee future results. This is research content, not investment advice.

