
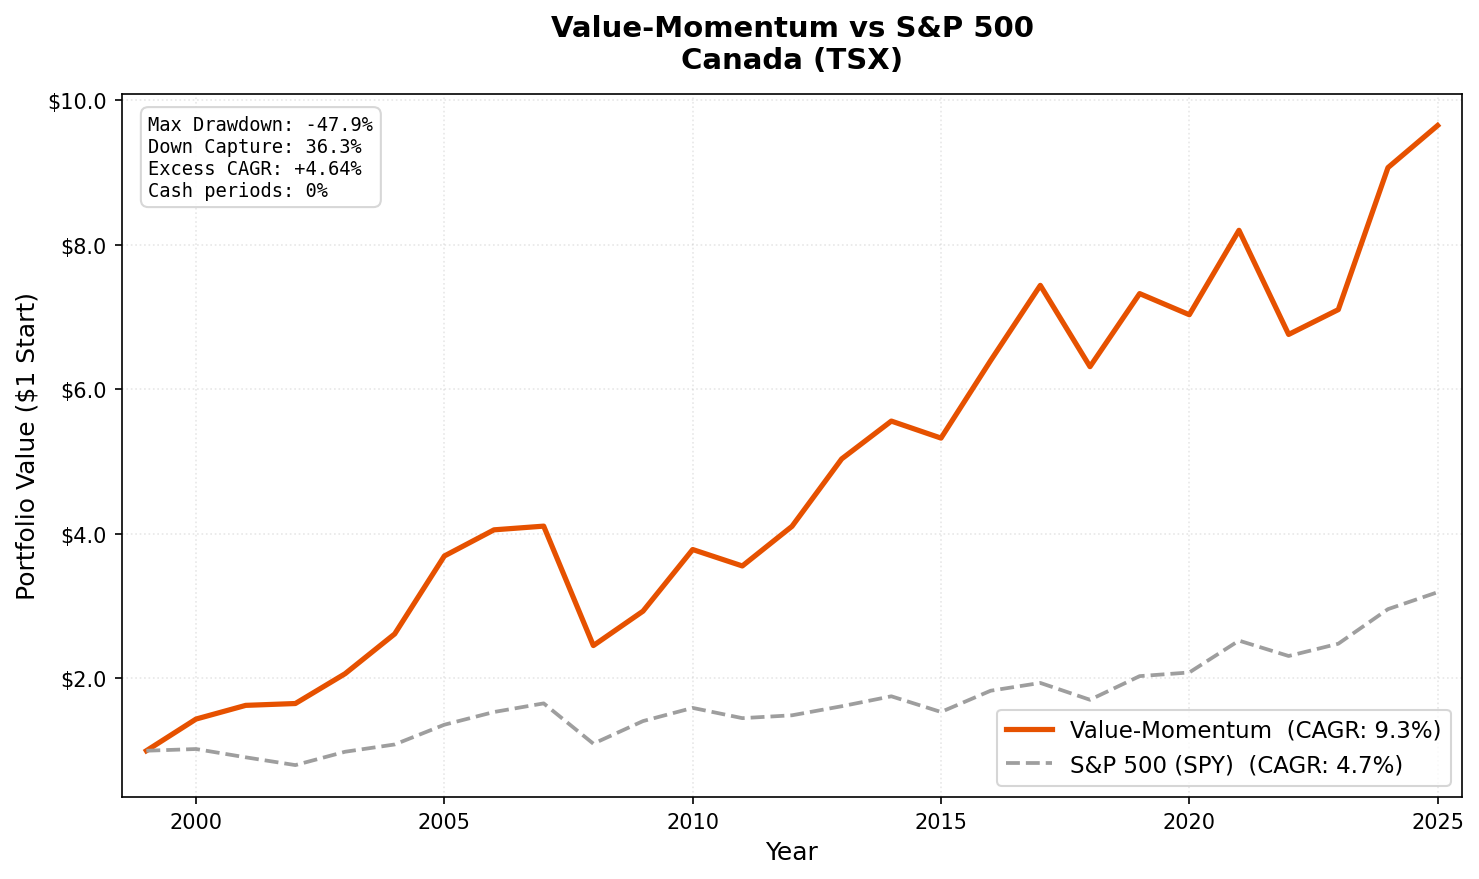
Value-Momentum on Canadian Stocks: 9.30% CAGR, +4.64% Excess Return vs TSX Composite
Value-momentum composite on Toronto Stock Exchange from 2000 to 2025. 9.30% CAGR with zero cash periods, 36% down capture vs TSX Composite, and a 66.67% win rate.

Canada produced the cleanest result of any non-US exchange we tested. Zero cash periods across the entire 25-year backtest. The screen always found enough qualifying stocks. No data gaps, no sparse-universe problems, no years sitting in cash while other exchanges built returns.
Contents
9.30% CAGR from 2000 to 2025, 4.94% alpha above the TSX Composite. Low volatility (16.52%), down capture of just 36.29% against the local index, and a 66.67% win rate. Measured against the Canadian market rather than the S&P 500, the alpha is meaningfully larger than it appeared.
Data: FMP financial data warehouse, 2000–2025. Updated May 2026.
Method
| Parameter | Value |
|---|---|
| Universe | TSX (Toronto Stock Exchange) |
| Filters | P/E 0-20, ROE > 10%, D/E < 1.0 |
| Ranking | 12-month momentum, composite percentile |
| Rebalancing | Semi-annual (January, July) |
| Holding period | 6 months |
| Max positions | 30 stocks, equal weight |
| Cash rule | Fewer than 10 qualifying stocks |
| Market cap | > C$500M (~$362M USD) |
| Data source | FMP via Ceta Research warehouse |
| Execution | Next-day close (MOC execution model) |
| Transaction costs | Size-tiered (0.1-0.5% one-way) |
| Benchmark | TSX Composite (^GSPTSE) |
| Period | 2000-2025 |
Based on Asness, Moskowitz, and Pedersen (2013). For the full methodology, see our US flagship post.
The Screen
-- Value-Momentum Canada (TSX) Screen
-- Run at: cetaresearch.com/data-explorer?q=Cm5wT16O4Q

SELECT
    k.symbol,
    p.companyName,
    f.priceToEarningsRatioTTM as pe_ratio,
    k.returnOnEquityTTM * 100 as roe_pct,
    f.debtToEquityRatioTTM as debt_to_equity,
    k.marketCap / 1e9 as market_cap_billions
FROM key_metrics_ttm k
JOIN financial_ratios_ttm f ON k.symbol = f.symbol
JOIN profile p ON k.symbol = p.symbol
WHERE f.priceToEarningsRatioTTM > 0
    AND f.priceToEarningsRatioTTM < 20
    AND k.returnOnEquityTTM > 0.10
    AND f.debtToEquityRatioTTM >= 0
    AND f.debtToEquityRatioTTM < 1.0
    AND k.marketCap > 500e6
    AND p.exchange IN ('TSX')
ORDER BY f.priceToEarningsRatioTTM ASC
LIMIT 100
What We Found

Full period summary (2000-2025):
| Metric | Value-Momentum | TSX Composite (^GSPTSE) |
|---|---|---|
| CAGR | 9.30% | 4.66% |
| Total Return | 865.12% | — |
| Max Drawdown | -47.91% | — |
| Volatility | 16.52% | — |
| Sharpe Ratio | 0.411 | — |
| Sortino Ratio | 0.640 | — |
| Up Capture | 110.69% | 100% |
| Down Capture | 36.29% | 100% |
| Beta | 0.859 | 1.0 |
| Alpha | 4.94% | — |
| Win Rate | 66.67% | — |
| Cash Periods | 0 of 51 | — |
| Avg Stocks | 28.5 | — |
Zero cash periods is unique in this study. Every other exchange had at least 2. Canada's exchange is deep enough in value names, across financials, energy, industrials, and consumer sectors, that the screen never ran out of qualifying stocks.
Down capture of 36.29% is the standout metric. When the TSX Composite fell, this portfolio absorbed about a third of the decline. Combined with 110.69% up capture, the asymmetry is strong: full participation in rallies, only a third of the pain in sell-offs.
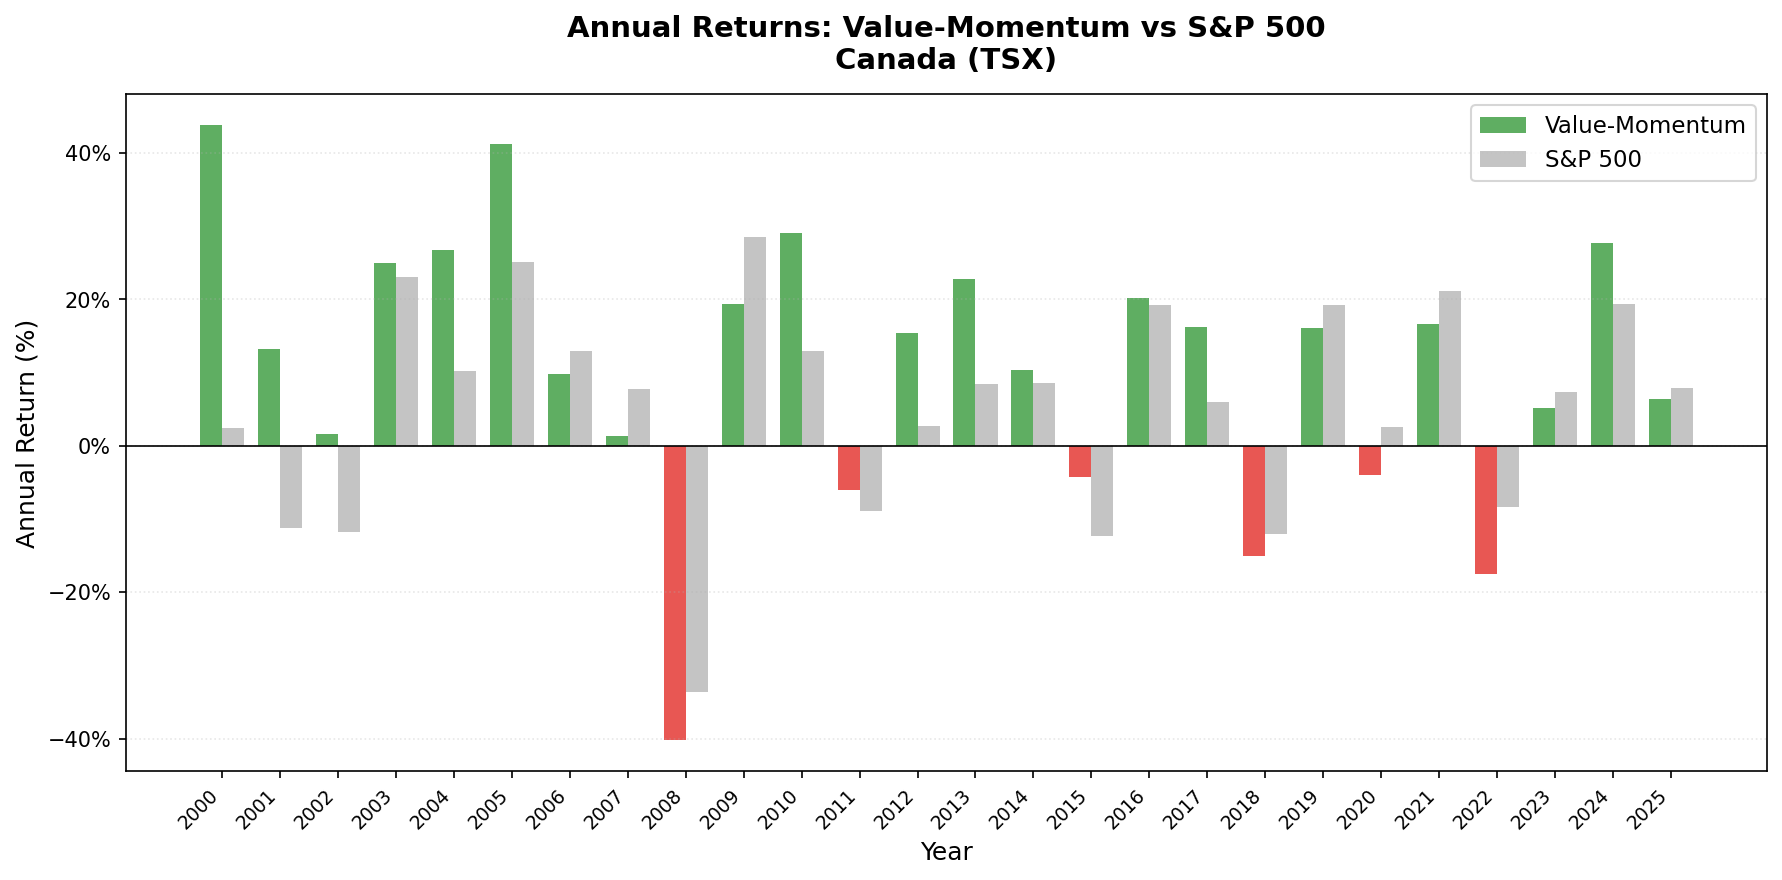
Year-by-year results:
| Year | Value-Momentum | TSX Composite | Notes |
|---|---|---|---|
| 2000 | +43.82% | +2.35% | Gained while TSX was flat |
| 2001 | +13.17% | -11.20% | TSX fell, portfolio up |
| 2002 | +1.57% | -11.86% | Third positive year during bear market |
| 2003 | +24.93% | +23.05% | |
| 2004 | +26.68% | +10.24% | |
| 2005 | +41.21% | +25.14% | Commodity supercycle |
| 2006 | +9.80% | +12.95% | |
| 2007 | +1.26% | +7.76% | |
| 2008 | -40.23% | -33.70% | Max drawdown year |
| 2009 | +19.39% | +28.51% | |
| 2010 | +29.10% | +12.94% | |
| 2011 | -6.01% | -8.91% | Beat TSX in downturn |
| 2012 | +15.42% | +2.72% | |
| 2013 | +22.72% | +8.40% | |
| 2014 | +10.39% | +8.53% | |
| 2015 | -4.23% | -12.38% | Oil crash: beat TSX by 8pp |
| 2016 | +20.15% | +19.15% | |
| 2017 | +16.25% | +5.89% | |
| 2018 | -15.12% | -12.03% | |
| 2019 | +16.01% | +19.19% | |
| 2020 | -3.99% | +2.50% | |
| 2021 | +16.61% | +21.16% | |
| 2022 | -17.57% | -8.44% | Deeper than TSX this year |
| 2023 | +5.08% | +7.35% | |
| 2024 | +27.66% | +19.29% | |
| 2025 | +6.43% | +7.92% | YTD |
Key Observations
2000-2002: the dot-com divergence. While the TSX Composite lost ground in 2001-2002, the value-momentum portfolio gained +43.82%, +13.17%, and +1.57%. Canada's value universe in that era was heavy in banks, pipelines, and resource companies. These sectors were cheap, profitable, and had nothing to do with the tech bubble. The strategy's value filter naturally avoided overpriced growth stocks.
36% down capture is exceptional. When the TSX Composite fell, this portfolio absorbed about a third of the loss. That asymmetry, paired with 111% up capture, is why the strategy compounds at nearly double the index's rate. Canada's economy is diversified enough that the value universe doesn't concentrate in a single volatile sector. Banks, energy, industrials, consumer companies, and real estate all contribute qualifying stocks.
The 2008 drawdown was the worst year. -40.23%, worse than the TSX Composite's -33.7% that year. Canada's resource exposure cut both ways: energy and mining stocks that passed value screens in 2007 crashed hard in 2008 as commodity prices collapsed. The 36% down capture overall shows this was the exception, not the pattern. In most downturns, the portfolio fell less than the index.
Limitations
Returns are in CAD. The Canadian dollar has been roughly flat against the USD over the full 25-year period, moving between parity and C$1.45 per USD. Currency impact is lower than for emerging markets but still present.
Energy and commodity exposure. Canada's value universe includes energy companies (pipelines, oil sands producers) that pass value screens. When oil prices crash, these names drag the portfolio. 2008 and 2015 are examples.
-47.91% max drawdown is significant. Even with 36% down capture overall, the 2008 crash hit hard. The drawdown measures peak-to-trough, not a single year.
Takeaway
Value-momentum on TSX produced 9.30% CAGR with 4.94% alpha vs the TSX Composite over 25 years. Zero cash periods, 36% down capture, and a 66.67% win rate make this the most consistent non-US result in the study. The reliability is the point: not the highest CAGR, but a dependable contributor with strong downside protection against the local market.
The 2000-2002 divergence is the strongest argument for including Canadian value stocks. When the broader market sold off, the value-momentum portfolio held up.
Part of a Series
Data: Ceta Research. FMP financial data warehouse, 2000-2025.
Past performance does not guarantee future results. This is research content, not investment advice.


