
Value-Momentum on Indian Stocks: 15.87% CAGR Over 21 Years of NSE Data
Value-momentum composite on NSE from 2004 to 2025. 15.87% CAGR, 4,176% total return. 61% down capture, 110% up capture, 5.67% annual alpha vs Sensex.

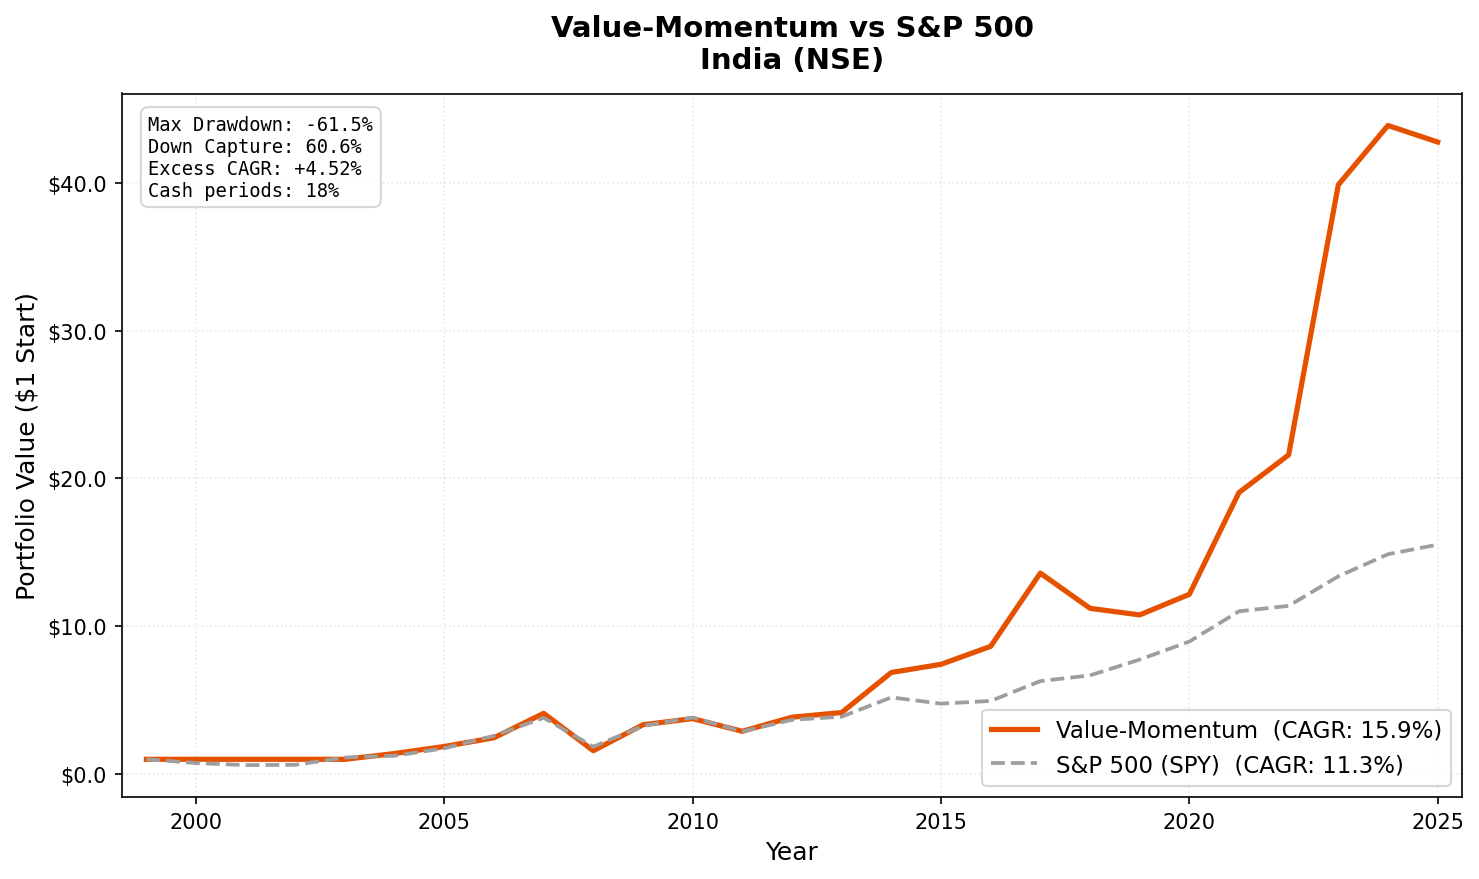
A value-momentum composite on India's National Stock Exchange returned 15.87% annually from 2004 to 2025, producing 4,176% total return. Compared to the Sensex, the portfolio captured 110% of upside while absorbing only 61% of the downside. That combination of participation and protection is uncommon for a systematic strategy.
Contents
We ran the backtest on NSE only, excluding BSE. Many Indian companies are listed on both exchanges. Including both would create duplicate positions in the same underlying business, inflating returns with an artificial diversification benefit that doesn't exist.
Data: FMP financial data warehouse, 2000–2025. Updated May 2026.
Method
| Parameter | Value |
|---|---|
| Universe | NSE (National Stock Exchange) |
| Filters | P/E 0-20, ROE > 10%, D/E < 1.0 |
| Ranking | 12-month momentum, composite percentile |
| Rebalancing | Semi-annual (January, July) |
| Holding period | 6 months |
| Max positions | 30 stocks, equal weight |
| Cash rule | Fewer than 10 qualifying stocks |
| Market cap | > 20B INR (~$240M USD) |
| Data source | FMP via Ceta Research warehouse |
| Execution | Next-day close (MOC execution model) |
| Transaction costs | Size-tiered (0.1-0.5% one-way) |
| Benchmark | Sensex (^BSESN) |
| Period | 2000-2025 (effective: 2004-2025) |
This is based on the value-momentum composite described by Asness, Moskowitz, and Pedersen (2013). For the full methodology, see our US flagship post.
The Screen
-- Value-Momentum India (NSE) Screen
-- Run at: cetaresearch.com/data-explorer?q=jnw4vZr_8t

SELECT
    k.symbol,
    p.companyName,
    f.priceToEarningsRatioTTM as pe_ratio,
    k.returnOnEquityTTM * 100 as roe_pct,
    f.debtToEquityRatioTTM as debt_to_equity,
    k.marketCap / 1e9 as market_cap_billions
FROM key_metrics_ttm k
JOIN financial_ratios_ttm f ON k.symbol = f.symbol
JOIN profile p ON k.symbol = p.symbol
WHERE f.priceToEarningsRatioTTM > 0
    AND f.priceToEarningsRatioTTM < 20
    AND k.returnOnEquityTTM > 0.10
    AND f.debtToEquityRatioTTM >= 0
    AND f.debtToEquityRatioTTM < 1.0
    AND k.marketCap > 20e9
    AND p.exchange IN ('NSE')
ORDER BY f.priceToEarningsRatioTTM ASC
LIMIT 100
What We Found

Full period summary (2004-2025):
| Metric | Value-Momentum | Sensex (^BSESN) |
|---|---|---|
| CAGR | 15.87% | 11.35% |
| Total Return | 4,176% | 1,452% |
| Max Drawdown | -61.53% | -51.34% |
| Volatility | 28.66% | 26.15% |
| Sharpe Ratio | 0.327 | 0.186 |
| Sortino Ratio | 0.659 | 0.347 |
| Up Capture | 109.65% | 100% |
| Down Capture | 60.60% | 100% |
| Beta | 0.761 | 1.0 |
| Alpha | 5.67% | — |
| Win Rate | 60.78% | — |
| Cash Periods | 9 of 51 | — |
| Avg Stocks | 29.3 | — |
$10,000 invested at the start would have grown to roughly $428,000. The 60.60% down capture means that when the Sensex fell, this portfolio absorbed about three-fifths of the decline. Combined with 109.65% up capture, the strategy participated fully in rallies while providing meaningful downside cushioning.
Year-by-year results:
| Year | Value-Momentum | Sensex | Notes |
|---|---|---|---|
| 2000 | 0.00% | -25.23% | Cash |
| 2001 | 0.00% | -18.65% | Cash |
| 2002 | 0.00% | +2.93% | Cash |
| 2003 | 0.00% | +79.09% | Cash |
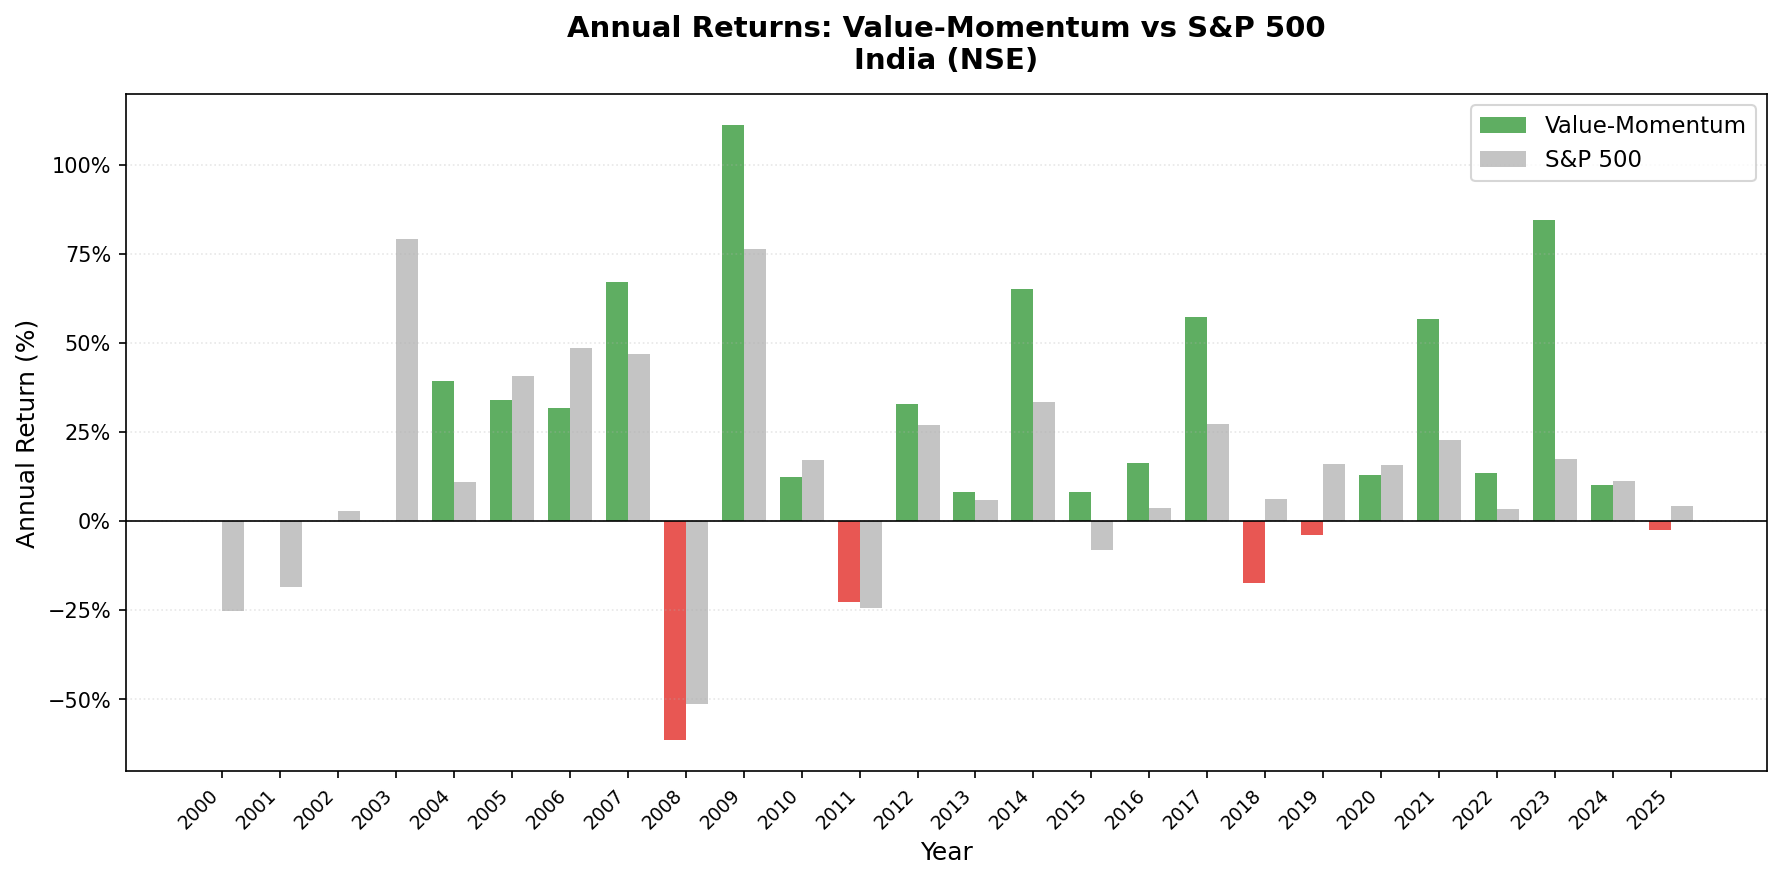
| 2004 | +39.38% | +10.83% | First invested year |
| 2005 | +34.04% | +40.59% | |
| 2006 | +31.62% | +48.48% | |
| 2007 | +67.13% | +46.79% | Pre-crisis peak |
| 2008 | -61.53% | -51.34% | Max drawdown |
| 2009 | +111.24% | +76.32% | Strongest recovery year |
| 2010 | +12.39% | +17.10% | |
| 2011 | -22.81% | -24.53% | |
| 2012 | +32.92% | +27.04% | |
| 2013 | +8.09% | +5.96% | |
| 2014 | +65.15% | +33.51% | Modi election rally |
| 2015 | +8.03% | -8.12% | |
| 2016 | +16.35% | +3.79% | |
| 2017 | +57.35% | +27.14% | GST, broad bull market |
| 2018 | -17.51% | +6.15% | |
| 2019 | -4.00% | +15.98% | |
| 2020 | +12.95% | +15.74% | |
| 2021 | +56.62% | +22.85% | India post-COVID boom |
| 2022 | +13.37% | +3.35% | Positive while markets fell |
| 2023 | +84.61% | +17.53% | Best year |
| 2024 | +10.07% | +11.20% | |
| 2025 | -2.55% | +4.34% | YTD |
Key Observations
2023 was the standout year. +84.61% in a single year. India's mid-cap universe exploded that year. The Nifty Midcap 100 was up over 40%. A concentrated 30-stock portfolio of value names with strong momentum amplified that. The strategy's P/E < 20 filter kept it out of overheated growth stocks and into the value names that led the rally.
The asymmetry is real, if not extreme. 60.78% win rate, 110% up capture, 61% down capture. That combination produced 5.67% annual alpha vs the Sensex. India's value universe includes consumer staples, private banks, and industrials that grow with the domestic economy. The value filter (P/E < 20) keeps the portfolio away from speculative names that crash hardest, though the downside protection is less dramatic when measured against the local index than against a foreign benchmark.
2008 was brutal, 2009 was the payoff. The -61.53% drawdown is the worst of any year. But the portfolio returned +111.24% the following year. Value stocks with strong balance sheets (D/E < 1.0) survived the crash and were the first to recover. If you held through the drawdown, you were whole within 18 months.
Limitations
Returns are in INR. The Indian rupee depreciated roughly 60% against the US dollar over this period. International investors would see meaningfully lower returns after currency conversion. Indian investors would see the full 15.87% CAGR.
9 cash periods. All in 2000-2003, when FMP coverage of Indian stocks was sparse. The effective backtest starts in 2004. The headline CAGR includes those flat years.
-61.53% max drawdown is severe. Even with 61% down capture over the full period, the 2008 crash hit hard. India had large foreign institutional inflows during the 2004-2007 bull market that reversed sharply. You need the ability to hold through a 62% drawdown to capture the subsequent recovery.
Transaction costs are size-tiered (0.1-0.5% one-way). Indian equities have STT (securities transaction tax), GST on brokerage, and exchange charges. These are modeled as size-tiered costs and reduce raw returns.
Takeaway
Value-momentum on Indian stocks produced 15.87% CAGR with 5.67% annual alpha vs the Sensex over 21 years of effective data. The 61% down capture shows the strategy provides meaningful, if not extreme, downside cushioning against the local market. The market's structural composition, dominated by domestically oriented consumer, financial, and industrial companies that pass value screens, creates a natural buffer during drawdowns.
The 2008 drawdown and INR depreciation are the honest caveats. This is a strong result for rupee-denominated investors who can tolerate the volatility.
Part of a Series
Data: Ceta Research. FMP financial data warehouse, 2000-2025.
Past performance does not guarantee future results. This is research content, not investment advice.


