
Volume-Confirmed Momentum on US Stocks: 7.92% CAGR vs 8.59% for the Index
We added volume confirmation to 12-month momentum on US stocks: rising 3-month volume, positive earnings, positive cash flow. From 2001 to 2025 it returned 7.92% annually vs 8.59% for SPY, with 145.7% down capture. The paper cited for the idea found high-volume winners reverse faster.

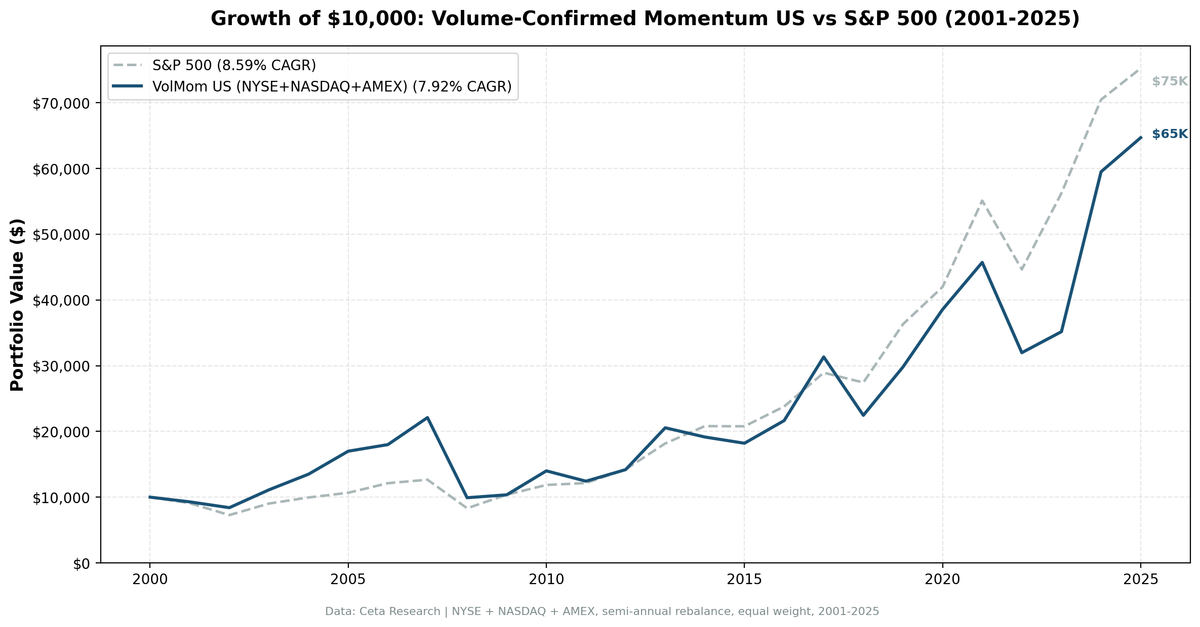
Volume confirmation does nothing for momentum in US equities. We filtered the top 30 momentum stocks using a rising-volume signal, 3-month average daily volume exceeding the 12-month average, plus basic quality screens. From 2001 to 2025, the strategy returned 7.92% annually against 8.59% for SPY. The 145.7% down capture tells the real story: when the market falls, this portfolio falls 46% harder.
Contents
- Method
- What the cited paper actually says
- What We Found
- Backtest Methodology
- Limitations
- Takeaway
- Part of a Series
- References
Data: FMP financial data warehouse, 2000–2025. Rerun September 2026.
Method
| Parameter | Value |
|---|---|
| Universe | NYSE, NASDAQ, AMEX |
| Rebalancing | Semi-annual (January, July) |
| Signal | 12-month return, skip last month (T-1M to T-12M) |
| Volume filter | 3-month avg daily volume > 12-month avg (vol_ratio > 1.0) |
| Quality filter | netIncome > 0 AND operatingCashFlow > 0 (FY, 45-day lag) |
| Selection | Top 30 by momentum, equal weight |
| Min threshold | 10 qualifying stocks to deploy capital |
| Data source | FMP via Ceta Research warehouse |
| Benchmark | S&P 500 (SPY) |
| Period | 2001–2025 |
| Academic reference | Lee & Swaminathan (2000), Journal of Finance 55(5) |
The volume filter is the key addition over pure momentum. The quality filter removes stocks with negative earnings or negative operating cash flow, cutting speculative names from the pool.
What the cited paper actually says
Volume confirmation is usually justified by Lee & Swaminathan (2000), and the justification runs backwards. Measuring volume as turnover on NYSE and AMEX stocks, they report that "high (low) volume winners (losers) experience faster reversals," and that "among winners, low volume stocks show greater persistence in price momentum." Their momentum life cycle framework classes high-volume winners as late-stage momentum: popular, expensive, and closer to turning than a winner nobody is watching. A long-only portfolio of high-volume winners, which is exactly what this screen builds, buys the leg the paper flags as late.
One finding does cut the other way. At intermediate horizons the winners-minus-losers spread is wider among high-volume stocks. That is a long-short result, it leans on the loser leg, and the authors state plainly that it "is not because volume 'fuels' price momentum."
Our signal is not theirs either. We use a 3-month over 12-month raw-volume ratio across NYSE, NASDAQ and AMEX, not turnover deciles on NYSE and AMEX. So this backtest doesn't test Lee & Swaminathan. It tests the practitioner version of the idea, and the US result lands on the same side as the paper.
What We Found
The strategy underperforms SPY by 0.67% annually. Over 24.5 years, that compounds: $1 grew to roughly 6.5x vs 7.5x for SPY. Volume confirmation doesn't just fail to add alpha, it adds crash risk.
24.5-year summary (2001–2025):
| Metric | Volume-Confirmed Momentum | S&P 500 (SPY) |
|---|---|---|
| CAGR | 7.92% | 8.59% |
| Total Return | 546.7% | 652.4% |
| Sharpe Ratio | 0.243 | n/a |
| Max Drawdown | -61.11% | -38.01% |
| Down Capture | 145.7% | 100% |
| Up Capture | 124.8% | 100% |
| Cash Periods | 0 of 49 (0%) | n/a |
| Avg Stocks Held | 29.4 | n/a |
Down capture of 145.7% means the portfolio falls 1.46x harder than SPY during down periods. Up capture of 124.8% means it captures more of the upside. But the downside penalty is bigger than the upside benefit, and it shows in the 24.5-year return gap.
Year-by-year standouts:
| Year | Portfolio | SPY | Notes |
|---|---|---|---|
| 2002 | -9.5% | -19.9% | Outperformed during dot-com crash |
| 2003 | +32.4% | +24.1% | Recovery led by quality names |
| 2004 | +21.4% | +10.2% | Continued outperformance |
| 2005 | +25.9% | +7.2% | Strongest relative year of the mid-2000s |
| 2006 | +5.9% | +13.7% | Momentum stalled, 7.8pp miss |
| 2007 | +22.9% | +4.4% | Pre-crisis strength |
| 2008 | -55.2% | -34.3% | Down capture problem exposed |
| 2009 | +4.5% | +24.7% | Missed the recovery by 20.3pp |
| 2013 | +44.9% | +27.8% | Strong post-crisis year, +17.1pp |
| 2017 | +44.8% | +21.6% | Largest relative gap outside 2024, +23.2pp |
| 2018 | -28.4% | -5.2% | Rate shock, leveraged names hit hard |
| 2024 | +69.2% | +25.3% | AI and semiconductor momentum, best absolute year |
| 2025 | +8.7% | +6.8% | Continued outperformance |
2008 and 2009 together define the US result. The portfolio lost 55.2% in 2008, 20.8 percentage points worse than SPY. That's the down capture problem in one year. Then in 2009, while SPY recovered 24.7%, this portfolio captured only 4.5%. The stocks with the strongest volume-confirmed momentum entering 2009 were the defensive names that hadn't fallen far. The beaten-down financials and cyclicals that led the recovery weren't in the portfolio. Two bad years in sequence cost compounding that the strategy never recovered.
2006 and the momentum stall. The portfolio returned 5.9% against SPY's 13.7%. This was a period when value and cyclicals led, breaking momentum's narrative. Rising-volume names had run hard through 2003-2005 and then consolidated while the broader market kept climbing.
2024 was the best year. At +69.2%, AI and semiconductor momentum drove exceptional returns. We can't attribute that to the volume filter from this backtest: we didn't run a no-volume-filter control, so we can't say whether pure momentum would have done as well or better in 2024. What the year shows is that the strategy is a concentrated bet on whatever is trending, and 2024 had a strong trend to be concentrated in. One year doesn't fix the 24.5-year gap.
Why the US result looks like this. Two explanations fit, and they aren't exclusive. The first is the paper's own: high-volume winners are late-stage momentum, and a portfolio built from them should underperform low-volume winners and carry more reversal risk. The 145.7% down capture is what that looks like in a return series. The second is market structure. Retail flows, ETF rebalancing, options hedging and algorithmic trading all generate US volume with no directional view attached, so a raw-volume ratio measures participation rather than accumulation. We can't separate the two from this backtest. What we can say is that the filter selects the high-volume leg, and the high-volume leg is the one the literature associates with faster reversals.
Live screen. The current US volume-confirmed momentum screen is live on Ceta Research: cetaresearch.com/data-explorer?q=zNOXQq44eF
Backtest Methodology
- Data: FMP financial data via Ceta Research warehouse. Price data from
stock_eod(adjusted closes). - Point-in-time: Quality filters use annual FY filings with 45-day reporting lag. No look-ahead bias.
- Signal: Price at T-12M to T-1M. Skip last month avoids short-term reversal contamination per Jegadeesh & Titman (1993).
- Volume ratio: 63-day avg daily volume divided by 252-day avg daily volume, computed at each rebalance date.
- Data quality: Stocks with an entry price under $1 are excluded, and any single-period return above 200% is dropped as a price artifact. Phantom holiday rows and broken split adjustments are removed from the price series before any lookup.
- Equal weight: 30 positions, 3.33% each. No intraperiod rebalancing.
- Transaction costs: Modeled as size-tiered commissions. See methodology.
- Benchmark: SPY ETF total return, dividends reinvested.
- Execution: Next-day close (market-on-close model). Entry prices use the trading day after the rebalance signal date.
Limitations
Negative alpha in the world's most efficient market. The -0.67% annual drag over 24.5 years is consistent with a crowded factor. Academic papers have documented US momentum since 1993. Systematic funds have been trading it for 30 years. The volume overlay adds complexity without adding returns.
Down capture is the structural problem. 145.7% down capture means this strategy makes portfolios more vulnerable to market crashes, not less. The quality filter (positive income, positive operating cash flow) doesn't prevent large drawdowns, it just removes the worst speculative stocks from a pool that still concentrates in high-beta momentum names.
The strategy is not a test of the cited paper. Lee & Swaminathan ranked on turnover across NYSE and AMEX and measured horizons out to five years. We rank on a raw 3-month over 12-month volume ratio across NYSE, NASDAQ and AMEX and hold for six months. A reader should not treat this result as confirming or refuting their work. It evaluates the practitioner rule that grew out of it.
Semi-annual rebalancing misses momentum decay. The strategy rebalances only in January and July. Momentum is a faster-moving signal. A holding period of six months means the portfolio carries stale momentum signals through much of the year.
Takeaway
Volume-confirmed momentum underperforms a simple SPY investment in the US. The 7.92% CAGR vs 8.59%, 145.7% down capture, and Sharpe of 0.243 don't make a case for running this strategy in US equities. The volume filter adds screening complexity without adding return.
The result is also the one the cited paper points to. Lee & Swaminathan found high-volume winners reverse faster than low-volume winners, and a long-only portfolio of high-volume winners underperforming its index with 145.7% down capture is consistent with that.
Other markets went the other way. The same strategy on the London Stock Exchange returned 9.05% annually against 1.44% for the FTSE 100, and in Sweden 10.49% against 3.68% for the OMX Stockholm 30. We don't have an explanation for that divergence that we can defend with this data. Lee & Swaminathan is a US study, both local indices are price indices that exclude dividends, and we didn't measure trading composition in any of these markets. The exchange comparison sets out what each market did without claiming to know why.
Part of a Series
This is part of a multi-exchange volume-confirmed momentum study:
- Volume-Confirmed Momentum: US Stocks
- Volume-Confirmed Momentum: UK Stocks
- Volume-Confirmed Momentum: India
- Volume-Confirmed Momentum: Canada
- Volume-Confirmed Momentum: Sweden
- Volume-Confirmed Momentum: 17-Exchange Comparison
References
- Lee, C. & Swaminathan, B. (2000). Price Momentum and Trading Volume. Journal of Finance, 55(5), 2017-2069.
- Jegadeesh, N. & Titman, S. (1993). Returns to Buying Winners and Selling Losers. Journal of Finance, 48(1), 65-91.
- Daniel, K. & Moskowitz, T. (2016). Momentum Crashes. Journal of Financial Economics.
Past performance does not guarantee future results. This is educational content, not investment advice.

