
P/E Compression in India: When Value Traps Outnumber Value

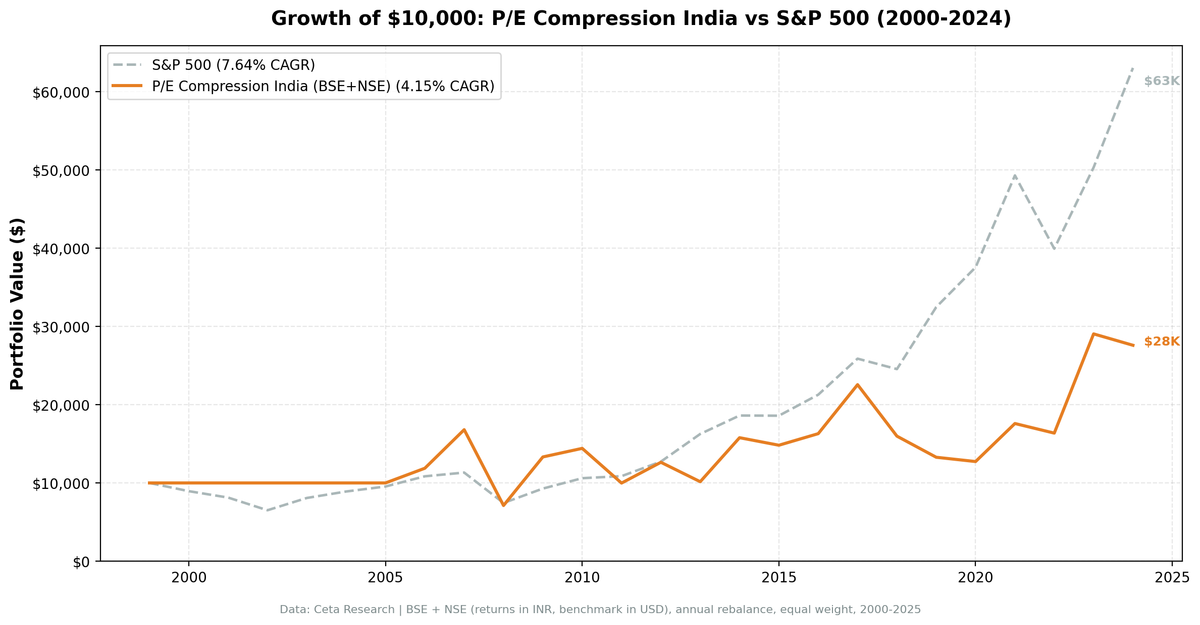
We ran our P/E compression screen on BSE and NSE for 25 years. The result: 4.15% CAGR, a negative Sharpe ratio of -0.071, and 101.8% down capture. The portfolio absorbed more of the S&P 500's losses during down years than the S&P 500 itself. In India's structurally high-growth market, stocks trade on growth expectations, and a compressed P/E often means the growth story has ended, not that it's temporarily misunderstood.
Contents
- Method
- The Strategy
- Screen
- Results
- When It Works
- When It Fails
- Why India Is Different
- Full Annual Returns
- Limitations
- Run It Yourself
- Part of a Series
Method
- Data source: Ceta Research (FMP financial data warehouse)
- Universe: BSE + NSE (Bombay Stock Exchange + National Stock Exchange), market cap > ₹40B (~$480M USD)
- Period: 2000-2025 (25 annual rebalance periods)
- Rebalancing: Annual (January), equal weight top 30 by compression score
- Benchmark: S&P 500 Total Return (SPY)
- Cash rule: Hold cash if fewer than 10 stocks qualify
- Transaction costs: Size-tiered model
- Currency note: Returns are in INR (local currency). Benchmark is SPY in USD.
Historical financial data with 45-day lag to prevent look-ahead bias. Full methodology: backtests/METHODOLOGY.md
The Strategy
Same screen as the US, UK, Canada, and Germany versions: find BSE/NSE-listed stocks where the current annual P/E has compressed 15%+ below the company's own 5-year historical average, with quality filters confirming the business still earns decent returns on equity.
| Criterion | Threshold |
|---|---|
| P/E compression | Current P/E < 85% of 5-year average |
| P/E range | 5 – 40 |
| Return on equity | > 10% |
| Debt-to-equity | < 2.0 |
| Market cap | > ₹40B (~$480M USD) |
| PE history | 3+ prior annual data points |
Ranking: Top 30 by most compressed (lowest current/average ratio), equal weight.
Screen
WITH fy_pe AS (
 SELECT r.symbol, r.priceToEarningsRatio AS pe, r.dateEpoch,
 ROW_NUMBER() OVER (PARTITION BY r.symbol ORDER BY r.dateEpoch DESC) AS rn,
 AVG(r.priceToEarningsRatio) OVER (
 PARTITION BY r.symbol ORDER BY r.dateEpoch
 ROWS BETWEEN 5 PRECEDING AND 1 PRECEDING
 ) AS avg_pe_5yr,
 COUNT(r.priceToEarningsRatio) OVER (
 PARTITION BY r.symbol ORDER BY r.dateEpoch
 ROWS BETWEEN 5 PRECEDING AND 1 PRECEDING
 ) AS n_prior
 FROM financial_ratios r
 JOIN profile p ON r.symbol = p.symbol
 WHERE r.period = 'FY' AND r.priceToEarningsRatio > 0 AND r.priceToEarningsRatio < 100
 AND p.exchange IN ('BSE', 'NSE')
)
SELECT f.symbol, p.companyName, p.sector,
 ROUND(f.pe, 2) AS current_fy_pe,
 ROUND(f.avg_pe_5yr, 2) AS pe_5yr_avg,
 ROUND(f.pe / f.avg_pe_5yr, 3) AS pe_ratio_to_avg,
 ROUND((1 - f.pe / f.avg_pe_5yr) * 100, 1) AS compression_pct,
 ROUND(k.returnOnEquityTTM * 100, 1) AS roe_pct,
 ROUND(f2.debtToEquityRatioTTM, 2) AS debt_to_equity,
 ROUND(k.marketCap / 1e9, 2) AS mktcap_b
FROM fy_pe f
JOIN key_metrics_ttm k ON f.symbol = k.symbol
JOIN financial_ratios_ttm f2 ON f.symbol = f2.symbol
JOIN profile p ON f.symbol = p.symbol
WHERE f.rn = 1
 AND f.avg_pe_5yr IS NOT NULL
 AND f.n_prior >= 3
 AND f.pe > 5
 AND f.pe < 40
 AND f.pe / f.avg_pe_5yr < 0.85
 AND k.returnOnEquityTTM > 0.10
 AND (f2.debtToEquityRatioTTM IS NULL OR (f2.debtToEquityRatioTTM >= 0 AND f2.debtToEquityRatioTTM < 2.0))
 AND k.marketCap > 40000000000
ORDER BY f.pe / f.avg_pe_5yr ASC
LIMIT 30
Results
| Metric | Portfolio | S&P 500 |
|---|---|---|
| CAGR | 4.15% | 7.64% |
| Total Return | 176.0% | 530.7% |
| Max Drawdown | -57.67% | -34.90% |
| Volatility (ann.) | 33.20% | 17.51% |
| Sharpe Ratio | -0.071 | 0.322 |
| Sortino Ratio | -0.125 | — |
| Beta | 0.951 | 1.00 |
| Alpha | -3.44% | — |
| Up Capture | 99.5% | — |
| Down Capture | 101.8% | — |
| Win Rate (vs SPY) | 48.0% | — |
| Cash Periods | 6/25 | — |
| Avg Stocks | 24.3 | — |
The negative Sharpe ratio (-0.071) is the blunt summary: risk-adjusted returns fell below the risk-free rate. With 33.2% annualized volatility, this portfolio was nearly twice as volatile as the S&P 500. While earning less than half its return. The 101.8% down capture means it didn't offer even the modest defensive quality that compressed P/E screens produced elsewhere.
Six of the 25 periods were cash (2000-2005), which reflects the limited FMP financial data available for India in those early years rather than a strategy-level cash signal. The effective track record runs 2006-2025.
When It Works
India's best years are dramatic. When the compression signal fires correctly, the reversion is sharp.
| Year | Portfolio | S&P 500 | Excess |
|---|---|---|---|
| 2007 | +41.5% | +4.4% | +37.1% |
| 2009 | +87.2% | +24.7% | +62.5% |
| 2012 | +26.6% | +17.1% | +9.5% |
| 2014 | +55.4% | +14.5% | +40.9% |
| 2017 | +38.4% | +21.6% | +16.8% |
| 2021 | +38.2% | +31.3% | +6.9% |
| 2022 | -7.0% | -19.0% | +12.0% |
| 2023 | +77.5% | +26.0% | +51.5% |
2009 (+87.2%) and 2023 (+77.5%) are real outlier years. Post-crisis recovery and the broad India equity rally of 2023 both produced enormous absolute gains. 2014 was election-driven: Modi's win triggered a re-rating of Indian equities, and compressed-P/E companies with intact fundamentals participated.
The problem is the distribution. Great years are exceptional. Bad years can be catastrophic.
When It Fails
| Year | Portfolio | S&P 500 | Excess |
|---|---|---|---|
| 2008 | -57.7% | -34.3% | -23.4% |
| 2011 | -30.8% | +2.5% | -33.2% |
| 2013 | -19.6% | +27.8% | -47.4% |
| 2018 | -29.2% | -5.2% | -24.0% |
| 2019 | -16.9% | +32.3% | -49.2% |
| 2024 | -5.0% | +25.3% | -30.3% |
2013 and 2019 are the worst: -47.4% and -49.2% excess return in a single year. Both followed years of strong absolute gains (2012 +26.6%, 2017 +38.4%). The strategy's momentum works until it doesn't.
2008 produced -57.7%, a drawdown that took years to fully recover. The 101.8% down capture means India's compressed-P/E portfolio amplified losses relative to SPY during the worst periods.
Why India Is Different
India is a growth market. Companies listed on BSE and NSE have historically commanded premium multiples (sometimes 25-40x earnings) because the market expects continued expansion in revenues and profitability. A compressed P/E in this context doesn't mean what it means in the UK or Germany.
In a mature market, a company that traded at 18x for five years and now trades at 13x has likely faced a temporary headwind, rate fears, sector rotation, short-term earnings miss. The business's normalized earnings power hasn't changed. The P/E compression is noise.
In a high-growth market, the same compression often means the growth rate has slowed permanently. A company that earned 25% ROE when the economy was growing at 8% may now earn 14% ROE in a more competitive environment. The market correctly re-rates it. The 5-year average P/E reflects what the market paid for a faster-growing version of the company. "Cheap vs history" is sometimes just "right price for slower growth."
This is the value trap problem, and India amplifies it. The ROE filter (> 10%) doesn't fully protect against it, a company can maintain 12% ROE while its growth rate falls from 20% to 8%, and still deserve a much lower multiple.
High inflation compounds the issue. India's structural inflation means real earnings growth often overstates nominal growth. The P/E history becomes a less reliable anchor when the general price level has shifted. A stock that traded at 20x five years ago may fairly trade at 14x today for reasons that have nothing to do with temporary mispricing.
The short data history matters too. With limited FMP coverage before 2006, the strategy only has 19 genuine invested years. The sample size is smaller than it looks, and six of the early years are cash.
Full Annual Returns
| Year | Portfolio | S&P 500 | Excess |
|---|---|---|---|
| 2000 | 0.0% | -10.5% | +10.5% [cash] |
| 2001 | 0.0% | -9.2% | +9.2% [cash] |
| 2002 | 0.0% | -19.9% | +19.9% [cash] |
| 2003 | 0.0% | +24.1% | -24.1% [cash] |
| 2004 | 0.0% | +10.2% | -10.2% [cash] |
| 2005 | 0.0% | +7.2% | -7.2% [cash] |
| 2006 | +18.8% | +13.7% | +5.2% |
| 2007 | +41.5% | +4.4% | +37.1% |
| 2008 | -57.7% | -34.3% | -23.4% |
| 2009 | +87.2% | +24.7% | +62.5% |
| 2010 | +8.2% | +14.3% | -6.1% |
| 2011 | -30.8% | +2.5% | -33.2% |
| 2012 | +26.6% | +17.1% | +9.5% |
| 2013 | -19.6% | +27.8% | -47.4% |
| 2014 | +55.4% | +14.5% | +40.9% |
| 2015 | -6.1% | -0.1% | -6.0% |
| 2016 | +10.0% | +14.4% | -4.5% |
| 2017 | +38.4% | +21.6% | +16.8% |
| 2018 | -29.2% | -5.2% | -24.0% |
| 2019 | -16.9% | +32.3% | -49.2% |
| 2020 | -4.1% | +15.6% | -19.8% |
| 2021 | +38.2% | +31.3% | +6.9% |
| 2022 | -7.0% | -19.0% | +12.0% |
| 2023 | +77.5% | +26.0% | +51.5% |
| 2024 | -5.0% | +25.3% | -30.3% |
Limitations
Negative Sharpe on a 33% vol strategy. The combination of high volatility and below-risk-free risk-adjusted returns makes this portfolio hard to justify as a standalone strategy. The big up years are real, but so are the -50%+ relative drawdowns.
Value trap prevalence. India's growth orientation means compressed P/Es frequently reflect genuine re-rating of future earnings expectations, not temporary mispricing. The quality filters don't distinguish between the two scenarios reliably.
Short data history. FMP data for India is limited before 2006. The 6/25 cash periods in 2000-2005 reflect data absence rather than strategy-level signals. The effective sample is 19 invested years.
Currency comparison. Returns are in INR. Benchmark is SPY in USD. INR has depreciated against USD over the study period, which makes the relative comparison unfavorable beyond what stock selection can explain.
Annual rebalancing in a volatile market. India's intra-year swings are large, 30%+ in some years. A January rebalance date misses substantial mid-year moves in both directions.
Part of a Series: Japan | Global | US | UK | UK | Thailand | Thailand | Switzerland
Run It Yourself
git clone https://github.com/ceta-research/backtests.git
cd backtests

python3 pe-compression/backtest.py --preset india --output results.json --verbose
python3 pe-compression/screen.py --preset india
Part of a Series
- Global comparison. How the strategy performs across 19 markets and why the East-West divide matters
- US analysis, 9.97% CAGR, +2.32% excess, 68.6% down capture
- UK analysis, +1.38% excess with 59.7% down capture
- Canada analysis. The defensiveness story: 23.7% down capture
Run It Yourself
Explore the data behind this analysis on Ceta Research. Query our financial data warehouse with SQL, build custom screens, and run your own backtests across 70,000+ stocks on 20 exchanges.
Data: Ceta Research (FMP financial data warehouse), 2000-2025. Universe: BSE + NSE. Returns in INR. Benchmark: SPY (USD). Full methodology: METHODOLOGY.md. Past performance doesn't guarantee future results.


