
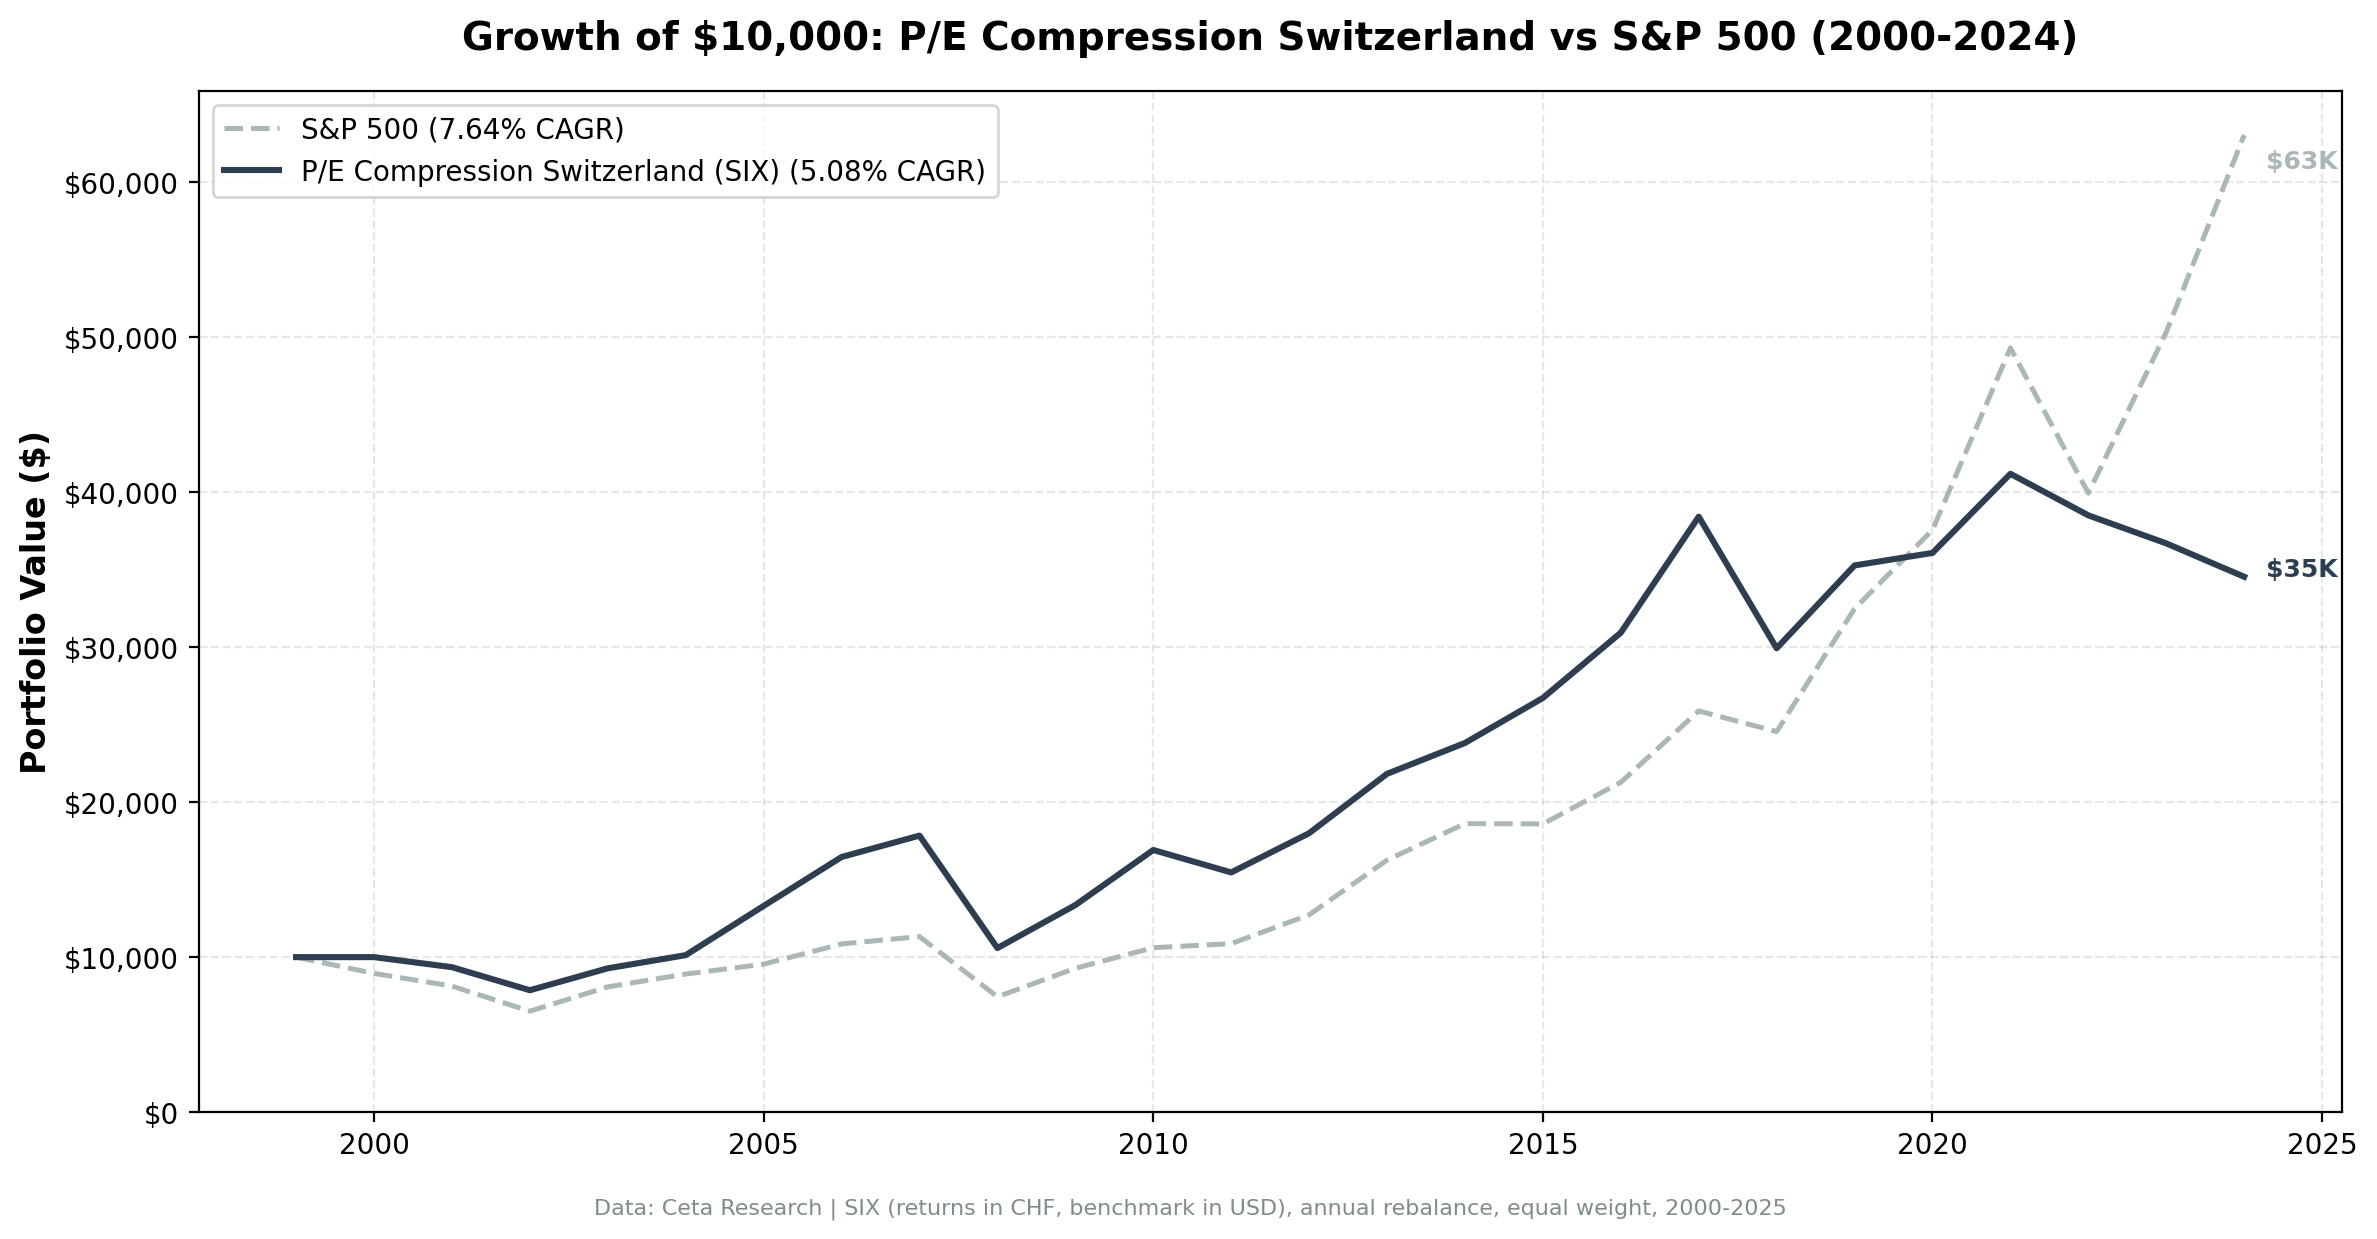
Switzerland P/E Compression: +3.47% Annual Alpha vs SMI
P/E compression on Swiss stocks returns 5.36% CAGR vs 1.90% for the SMI. That's +3.47% annual alpha with 23.86% down-capture. Switzerland is one of the clearest positive cases in this series.

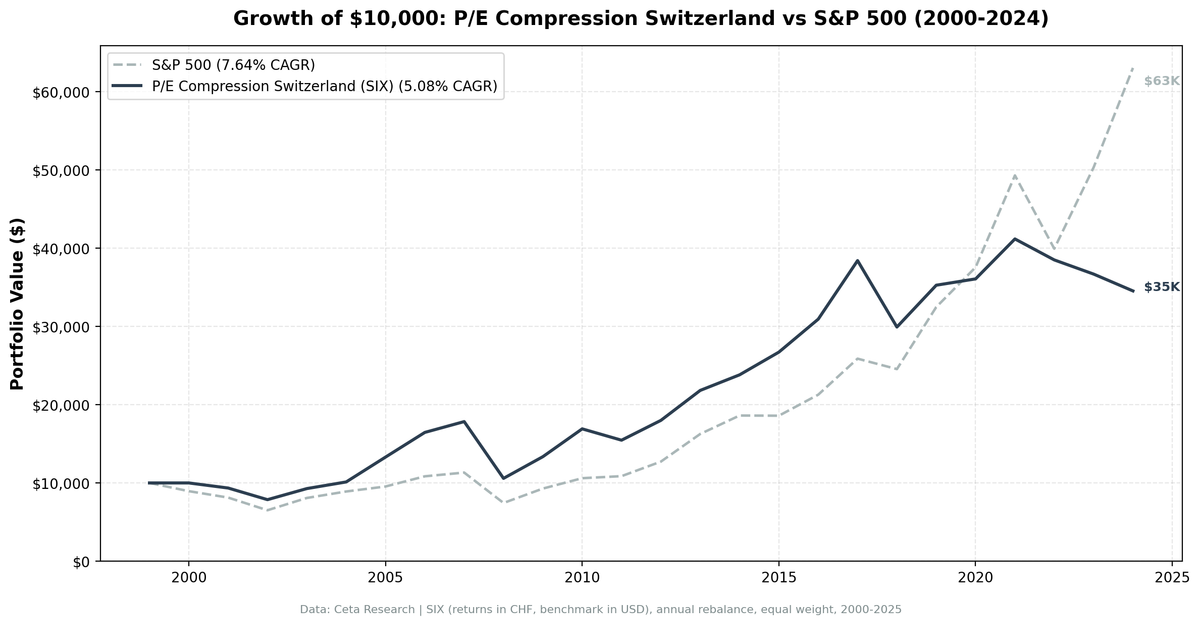
P/E compression on Swiss stocks returns 5.36% annually vs 1.90% for the SMI. That's +3.47% excess return over the local benchmark. Switzerland is one of the few markets where the strategy delivers meaningful, sustained outperformance. The SMI's own weak long-term return creates a low bar, but clearing it by 3.47% annually over 25 years still matters.
Contents
Data: FMP financial data warehouse, 2000–2025. Updated March 2026.
Method
Universe: SIX, market cap > CHF500M Period: 2000-2025 (25 years) Benchmark: SMI (CHF)
Returns in CHF. Benchmark in CHF.
What We Found
| Metric | Switzerland | SMI |
|---|---|---|
| CAGR | 5.36% | 1.90% |
| Excess | +3.47% | - |
| Sharpe | 0.278 | - |
| MaxDD | -40.68% | - |
| Down-Cap | 23.86% | 100% |
| Up-Cap | 100.17% | 100% |
| Avg Stocks | 15.0 | - |
| Cash | 1/25 (4%) | - |
The down-capture of 23.86% is remarkable. In years the SMI fell, this portfolio captured less than a quarter of those losses. Up-capture of 100.17% means it essentially matched the SMI in up years while absorbing very little of the downside. That's an asymmetric return profile that holds up over 25 years.
Year-by-year returns
| Year | Portfolio | SMI | Excess |
|---|---|---|---|
| 2000 | +0.0% | +11.7% | -11.7% |
| 2001 | -6.6% | -21.5% | +14.9% |
| 2002 | -15.1% | -23.1% | +8.0% |
| 2003 | +18.0% | +13.9% | +4.1% |
| 2004 | +9.2% | +3.3% | +5.8% |
| 2005 | +31.4% | +32.2% | -0.9% |
| 2006 | +25.6% | +16.9% | +8.7% |
| 2007 | +13.1% | -6.7% | +19.9% |
| 2008 | -40.7% | -30.8% | -9.9% |
| 2009 | +26.2% | +15.2% | +11.0% |
| 2010 | +26.6% | -2.1% | +28.7% |
| 2011 | -8.6% | -6.8% | -1.7% |
| 2012 | +16.4% | +16.0% | +0.3% |
| 2013 | +21.3% | +17.8% | +3.5% |
| 2014 | +9.1% | +8.1% | +1.0% |
| 2015 | +12.2% | -3.2% | +15.4% |
| 2016 | +15.8% | -3.9% | +19.7% |
| 2017 | +24.2% | +14.0% | +10.2% |
| 2018 | -22.1% | -10.7% | -11.4% |
| 2019 | +17.9% | +26.4% | -8.5% |
| 2020 | +2.3% | -0.1% | +2.3% |
| 2021 | +14.2% | +21.0% | -6.8% |
| 2022 | -6.5% | -15.2% | +8.6% |
| 2023 | -4.7% | +1.8% | -6.4% |
| 2024 | -5.9% | +4.1% | -9.9% |
The strategy beats the SMI in most years, especially in defensive periods. The SMI's negative years (2001, 2002, 2008, 2011, 2015, 2016, 2020, 2022) often saw the strategy hold up better or outright gain. The biggest gaps came in 2007 (+19.9%), 2010 (+28.7%), 2015 (+15.4%), and 2016 (+19.7%).
The recent trend is less encouraging. 2023 (-6.4%) and 2024 (-9.9%) both saw meaningful underperformance. That's worth monitoring.
Why Switzerland Works
SMI's structural weakness. The SMI is heavily concentrated in a handful of mega-caps (Nestle, Novartis, Roche). When those names underperform, the entire index drags. A diversified value portfolio of 15 names across the Swiss market can diverge significantly from that concentration.
Defensive sectors with genuine mean reversion. Swiss companies in industrials, specialty chemicals, and mid-tier financials tend to have stable earnings trajectories. When P/E ratios compress temporarily due to sector rotation or macro concerns, the fundamentals often support recovery.
Low absolute bar. The SMI returning 1.90% annually over 25 years isn't a strong benchmark. Any strategy with reasonable stock selection and risk management should have a chance of clearing it.
Downside protection. The 23.86% down-capture is the strongest signal here. When the SMI fell sharply in 2001, 2002, 2008, and 2022, the strategy didn't fall with it. That's not luck over 25 years. It's a structural feature of how P/E compression selects for stocks that have already absorbed bad news.
One caveat. Recent results (2023-2024) show -6.4% and -9.9% excess. The strategy may be struggling in the current rate environment or simply running through a rough patch. It's too early to call a trend reversal, but it's worth watching.
Conclusion
Switzerland is the clearest positive case in this P/E compression series. +3.47% annual alpha vs the SMI, 23.86% down-capture, 5.36% CAGR in CHF. The SMI's own weak return helped, but a 3.47% gap over 25 years isn't trivial. The recent underperformance in 2023 and 2024 is a yellow flag, not a red one. If those years reflect a regime shift rather than noise, the thesis may need revisiting.
Data: Ceta Research. Returns in CHF. github.com/ceta-research/backtests
Past performance does not guarantee future results. This is educational content, not investment advice.


