
Graham Number Across 12 Global Markets: 9 of 12 Beat Their Local Benchmark
We ran the Graham Number screen on 12 exchanges over 25 years, each benchmarked against its local stock index. 9 of 12 beat their local benchmark clearly. Sweden leads with +10.08% annual excess; Japan delivers the best Sharpe. Only India and the US underperform their home market; Hong Kong ties.

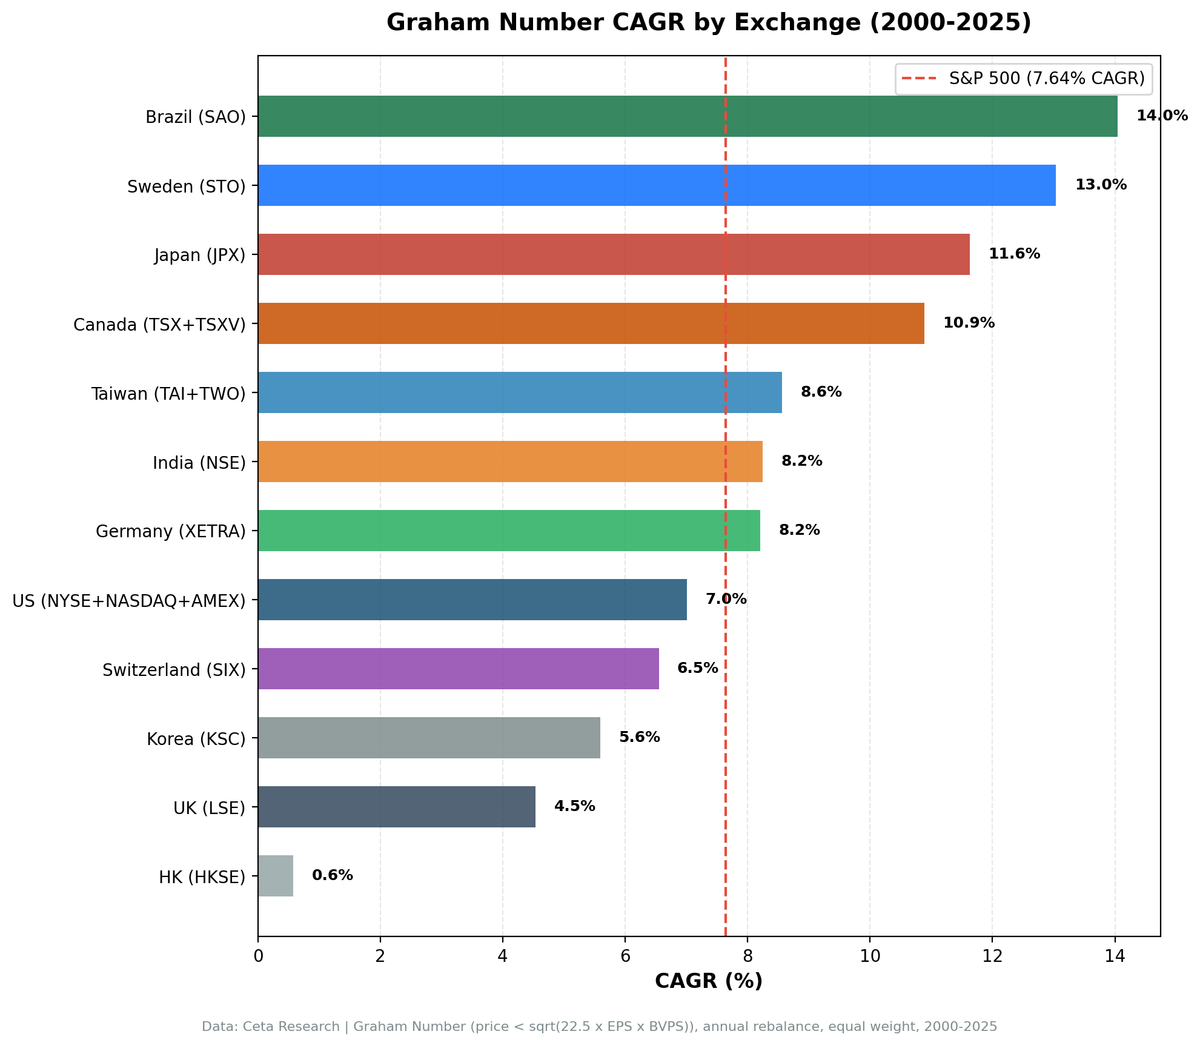
We ran the Graham Number screen on 12 exchanges over 25 years. Same formula. Same rules. Each exchange measured against its own local stock index. The results are clear.
Contents
- Method
- Full Results Table
- The Winners: 8 Markets That Clearly Beat Their Local Index
- Sweden: +10.08% Above OMX Stockholm, 80% Win Rate
- Japan: Best Risk-Adjusted, +8.68% Above the Nikkei
- Canada: Best Drawdown Protection, +6.46% Above TSX
- Switzerland: +4.66% Above SMI, Strong Sharpe
- Taiwan, Germany, UK, Korea: Modest to Strong Local Alpha
- Brazil: Strong Returns, But Read the Data Quality Notes
- The Tied Market: Hong Kong
- The Two Underperformers: US and India
- US: The One Developed Market Where Graham Lags
- India: The Strategy Can't Keep Up With a Fast Market
- The Pattern: Local Benchmarks Reveal Broader Alpha
- Excluded Exchanges
- Run It Yourself
- Part of a Series
9 of 12 exchanges beat their local benchmark. Sweden leads with +10.08% annual excess. Japan delivers the best risk-adjusted result. Canada combines strong returns with the lowest drawdown in the study. Only India and the US underperformed their home market. Hong Kong essentially tied its local benchmark.
That's the summary. The data underneath it explains why.
Data: FMP financial data warehouse, 2000–2025. Updated May 2026.
Method
Data source: Ceta Research (FMP financial data warehouse) Strategy: Top 30 stocks per exchange trading below their Graham Number, ranked by deepest discount. Equal weight. Annual rebalancing, January. 45-day filing lag on annual financials. Next-day close execution. Graham Number: sqrt(22.5 × EPS × BVPS). Requires EPS > 0, BVPS > 0. Benchmark: Local stock index per exchange (Nikkei 225 for Japan, Sensex for India, DAX for Germany, etc.). SPY for US. Period: 2000–2024 (25 annual rebalance periods) Transaction costs: Size-tiered model, exchange-specific market cap thresholds
Full methodology: backtests/METHODOLOGY.md
These benchmarks leave dividends out. Portfolio returns here use dividend-adjusted prices, so they include dividends. Most of the indices we measure against do not. The FTSE 100, Hang Seng, KOSPI, Nikkei 225, OMX Stockholm 30, SMI, Sensex, TAIEX and TSX Composite are price indices, so excess return against them is overstated by roughly the local dividend yield, which has run between about 1.3% and 3.5% in these markets. Those comparisons are like for like: the S&P 500 figure runs through SPY, which is dividend-adjusted; the DAX is a performance index; the Bovespa reinvests dividends. Treat any edge thinner than the local yield as a tie rather than a win.
Full Results Table
Each exchange is benchmarked against its local stock index to measure genuine alpha in the same currency.
| Exchange | CAGR | Local Benchmark | Excess vs Local | Sharpe | MaxDD | Cash |
|---|---|---|---|---|---|---|
| Sweden (STO) | 13.04% | OMX Stockholm 2.95% | +10.08% | 0.459 | -44.8% | 3/25 |
| Japan (JPX) | 11.63% | Nikkei 225 2.95% | +8.68% | 0.476 | -37.8% | 0/25 |
| Canada (TSX) | 10.89% | TSX Composite 4.44% | +6.46% | 0.370 | -26.7% | 0/25 |
| Switzerland (SIX) | 6.55% | SMI 1.90% | +4.66% | 0.326 | -35.3% | 2/25 |
| Taiwan (TAI+TWO) | 8.56% | TAIEX 3.91% | +4.65% | 0.275 | -40.8% | 6/25 |
| Germany (XETRA) | 8.21% | DAX 4.45% | +3.77% | 0.263 | -42.0% | 0/25 |
| UK (LSE) | 4.54% | FTSE 100 0.86% | +3.68% | 0.042 | -52.8% | 5/25 |
| Korea (KSC) | 5.59% | KOSPI 3.32% | +2.26% | 0.116 | -43.6% | 6/25 |
| Hong Kong (HKSE) | 0.58% | Hang Seng 0.49% | +0.09% | -0.072 | -80.8% | 0/25 |
| US (NYSE+NASDAQ+AMEX) | 7.01% | S&P 500 7.64% | -0.63% | 0.234 | -44.1% | 0/25 |
| India (NSE) | 8.25% | Sensex 11.40% | -3.15% | 0.048 | -55.8% | 5/25 |
Brazil is included in detail below with data quality caveats. Three other exchanges (France, South Africa, Singapore) were tested but excluded for the reasons listed at the bottom.
The Winners: 8 Markets That Clearly Beat Their Local Index
Sweden: +10.08% Above OMX Stockholm, 80% Win Rate
13.04% CAGR vs OMX Stockholm 30 at 2.95%. +10.08% annual excess. Won in 20 of 25 years, tied with Japan for the highest win rate in the study.
Swedish industrials and materials companies sit in manufacturing-heavy sectors with tangible book values and regular earnings. The Graham Number finds a natural fit there. The OMX Stockholm 30 returned just 2.95% annually over this period, and the strategy beat it in 80% of years. Down capture vs OMX is 30.5%, meaning the portfolio absorbed less than a third of the OMX's declines.
The asymmetry is the central story: 151.9% up capture, 30.5% down capture. In rising markets the portfolio captures far more than the benchmark. In falling markets it absorbs less than a third of the damage. That combination compounded into a 2,040% total return in SEK over 25 years vs 107% for the OMX.
Japan: Best Risk-Adjusted, +8.68% Above the Nikkei
11.63% CAGR vs Nikkei 225 at 2.95%. +8.68% annual excess. Sharpe 0.476.
Measured against its local benchmark, Japan's Graham Number screen generated 8.68% annual alpha over 25 years. The portfolio won in 80% of years vs the Nikkei. Down capture vs Nikkei is 15.2%, meaning when the Nikkei fell, this portfolio fell only about a sixth as much.
2022 was the sharpest demonstration: +22.7% when the Nikkei fell -12.2%. A +35% excess in a single year. Japan's near-zero interest rate environment insulated deep-value stocks from the rate shock that hurt growth names globally.
Why does Japan work? The Tokyo Stock Exchange has historically had a large pool of profitable, asset-heavy companies trading below book value due to cross-shareholding structures, conservative dividend policies, and deflationary culture. The Graham Number requires exactly those characteristics: positive EPS, positive BVPS, and a price below the intrinsic ceiling. Japan has a deep supply of qualifying stocks. Since 2021, the TSE has actively pushed companies below 1x book to improve capital allocation, providing a structural revaluation catalyst.
Canada: Best Drawdown Protection, +6.46% Above TSX
10.89% CAGR vs TSX Composite at 4.44%. +6.46% annual excess. MaxDD -26.66%.
Canada's drawdown profile stands alone. The maximum drawdown of -26.66% is the lowest of any exchange in the study. Down capture vs the TSX Composite is 51.8%, meaning the portfolio absorbed about half of the TSX's declines.
Canadian markets are dominated by financials, energy, and materials. These sectors carry substantial book value and regular earnings. Graham Number screens load up on exactly these sectors. When commodity or credit cycles turn, the cheapest names by Graham's formula tend to be the ones with the most room to recover.
Switzerland: +4.66% Above SMI, Strong Sharpe
6.55% CAGR vs SMI at 1.90%. +4.66% annual excess. Sharpe 0.326. MaxDD -35.3%.
Switzerland looked like a modest underperformer when benchmarked against SPY. Against its own market, the story flips completely. The SMI returned just 1.9% annually over 25 years. The Graham Number screen delivered +4.66% above that with controlled drawdown and a Sharpe well above the local index (0.088).
Taiwan, Germany, UK, Korea: Modest to Strong Local Alpha
Taiwan (+4.65% vs TAIEX), Germany (+3.77% vs DAX), UK (+3.68% vs FTSE), and Korea (+2.26% vs KOSPI) all beat their local benchmarks with varying degrees of risk-adjusted strength.
Germany's beta of 1.00 vs the DAX means the alpha comes from genuine stock selection inside the cyclical universe rather than a leverage tilt. Taiwan's strategy survives despite high cash periods (6/25) thanks to a strong post-2009 record.
The UK is the surprise. Against SPY, the UK was the worst performer in the old SPY-only comparison. Against the FTSE 100 (which returned just 0.86% annually), the strategy delivered meaningful alpha with a painful -52.8% max drawdown.
Brazil: Strong Returns, But Read the Data Quality Notes
14.04% CAGR vs Bovespa at 8.44%. +5.60% annual excess. Sharpe 0.117. In BRL.
Brazil's headline outperformance vs Bovespa is real on paper, but the underlying data carries known artifacts. FMP's adjusted-close prices for SAO (Sao Paulo) include reverse-split and consolidation adjustments that don't propagate correctly, producing extreme price ratios for some symbols. The framework filters catch the worst (over-200% single-period moves are removed), but residual artifacts may still inflate annual returns in some years. The previous version of this analysis showed 18.37% CAGR; the current data quality filters bring it down to 14.04%, which is closer to but still likely above the true unbiased result.
Treat the Brazil number as directional, not precise. The local alpha vs Bovespa is meaningful in magnitude, but the exact CAGR should not be reported with the same confidence as the other exchanges in this study.
For full Brazil detail and currency caveats, see the dedicated Brazil analysis.
The Tied Market: Hong Kong
0.58% CAGR vs Hang Seng at 0.49%. +0.09% excess. Essentially tied.
Hong Kong is the closest match to its local index in the study. The strategy neither beat nor lagged the Hang Seng meaningfully over 25 years. Both returns are near zero. The Hang Seng itself returned just 0.49% CAGR over 25 years, reflecting China's real estate crisis, regulatory tightening, and the broad repricing of China-linked equities that dominated 2020-2023.
The portfolio's -80.8% max drawdown is the worst in the study by a wide margin. The strategy found genuinely cheap stocks. But cheap kept getting cheaper as macro and regulatory risks crystallized. The flat absolute return reflects both the portfolio's struggle and the benchmark's stagnation.
The Two Underperformers: US and India
US: The One Developed Market Where Graham Lags
7.01% CAGR vs SPY at 7.64%. -0.63% annual shortfall. Sharpe 0.234.
The US is the only major developed market in the study where the Graham Number screen underperforms its own benchmark. The strategy worked from 2000-2012, winning in 11 of 13 years. Then the US equity market entered a technology-driven regime that the Graham Number structurally can't participate in.
Amazon, Apple, Microsoft, Google, Meta trade at multiples of book value. The Graham Number screen doesn't hold them. As technology's share of the S&P 500 grew from roughly 16% to over 30%, any book-value-based screen faced an increasing benchmark headwind.
The down capture of 68.8% is real protection. 2000-2002 and 2022 proved it. But the up capture of 91.4% means that in technology-led bull markets, the gap compounds against you.
India: The Strategy Can't Keep Up With a Fast Market
8.25% CAGR vs Sensex at 11.40%. -3.15% annual shortfall. Sharpe 0.048.
India is the clearest underperformer in the study when measured against local benchmarks. The Sensex returned 11.4% annually, driven by technology, pharmaceuticals, and consumer companies that rarely appear in Graham Number screens. The 5/25 cash periods (no qualifying stocks in the early years) further dragged cumulative returns.
India's near-zero Sharpe (0.048) reflects the math: 8.25% return minus a 6.5% risk-free rate leaves little per unit of risk. The -55.8% max drawdown adds insult.
The Pattern: Local Benchmarks Reveal Broader Alpha
The old SPY-only comparison painted a misleading picture. Many exchanges appeared to underperform simply because SPY was a strong benchmark over this period. When each exchange is measured against its own local index, 9 of 12 show clear positive excess returns, Hong Kong ties, and only 2 lag.
Graham's formula rewards two things: earnings and tangible assets. Markets where listed companies carry substantial book values and stable earnings generate large pools of qualifying stocks at genuine discounts. Japan, Canada, Sweden, and Switzerland are manufacturing, resource, and financial economies. The Graham Number finds real opportunities there, and the local indices (Nikkei, TSX, OMX, SMI) had modest returns that made the strategy's alpha stand out.
The underperformers share a common thread. The US market is dominated by intangible-value companies that the formula structurally excludes. India's high-growth market (Sensex at 11.4% CAGR) sets a hurdle the conservative Graham screen can't clear.
The revaluation catalyst matters. Japan's corporate governance reform since 2021 created systematic pressure on below-book companies to improve. That's exactly the type of catalyst that converts a "cheap" stock into a "re-rated" stock. Korea's discount and India's risk premium lack equivalent catalysts, which is why the screen works in Japan but struggles in those markets.
Excluded Exchanges
Several exchanges were tested but excluded from the main comparison table for data or coverage reasons.
Brazil (SAO). Included above with caveats due to known FMP adjusted-close data quality issues affecting Brazilian stocks. Numbers are directional only.
France (PAR). FMP's FY (annual) fundamental data for French-listed stocks has too few qualifying records. The screen produced cash for all 25 years.
South Africa (JNB). FMP stores EPS and BVPS for South African stocks in units that don't match price convention. The resulting Graham Numbers are roughly 100x smaller than actual stock prices, so no stocks qualify. A data normalization issue, not a strategy result.
Singapore (SGX). The exchange code mapping returned zero symbols in the current data. Too sparse to draw conclusions.
Australia (ASX). Excluded for known FMP adjusted-close data quality issues affecting Australian stocks (incorrect split adjustments produce artifact returns).
Run It Yourself
git clone https://github.com/ceta-research/backtests.git
cd backtests

# Single exchange
python3 graham-number/backtest.py --preset japan --output results.json --verbose

# Global comparison
python3 graham-number/backtest.py --global --output results/exchange_comparison.json

# Live screen (any exchange)
python3 graham-number/screen.py --preset canada
-- Graham Number screen, parameterized by exchange
SELECT
    p.symbol,
    p.companyName,
    p.exchange,
    p.sector,
    ROUND(k.grahamNumberTTM, 2) AS graham_number,
    ROUND(p.price, 2) AS current_price,
    ROUND((1 - p.price / k.grahamNumberTTM) * 100, 1) AS discount_pct
FROM key_metrics_ttm k
JOIN profile p ON k.symbol = p.symbol
WHERE k.grahamNumberTTM > 0
  AND p.price < k.grahamNumberTTM
  AND p.exchange IN ('JPX')  -- swap for TSX, STO, NYSE, NASDAQ, AMEX, etc.
ORDER BY discount_pct DESC
LIMIT 30
Run global Graham Number screen live →
Part of a Series
- Japan analysis: 11.63% CAGR, +8.68% vs Nikkei, 80% win rate
- Sweden analysis: 13.04% CAGR, +10.08% vs OMX, 80% win rate (top of the study)
- Canada analysis: 10.89% CAGR, +6.46% vs TSX, -26.7% max drawdown
- US analysis: 7.01% CAGR, honest look at two distinct eras
Data: Ceta Research (FMP financial data warehouse), 2000-2024. All returns in local currency. Each exchange benchmarked against its local stock index. Local risk-free rates applied per exchange. Full methodology: METHODOLOGY.md. Past performance does not guarantee future results.
Past performance does not guarantee future results. This is educational content, not investment advice.

