
P/E Compression Across 21 Global Markets: 7 of 18 Beat Their Benchmark
P/E compression tested across 21 global markets. Three can't be assessed at all. Of the 18 that can, 7 beat their benchmark, and only Canada, the US and Japan survive once you account for benchmarks that exclude dividends.

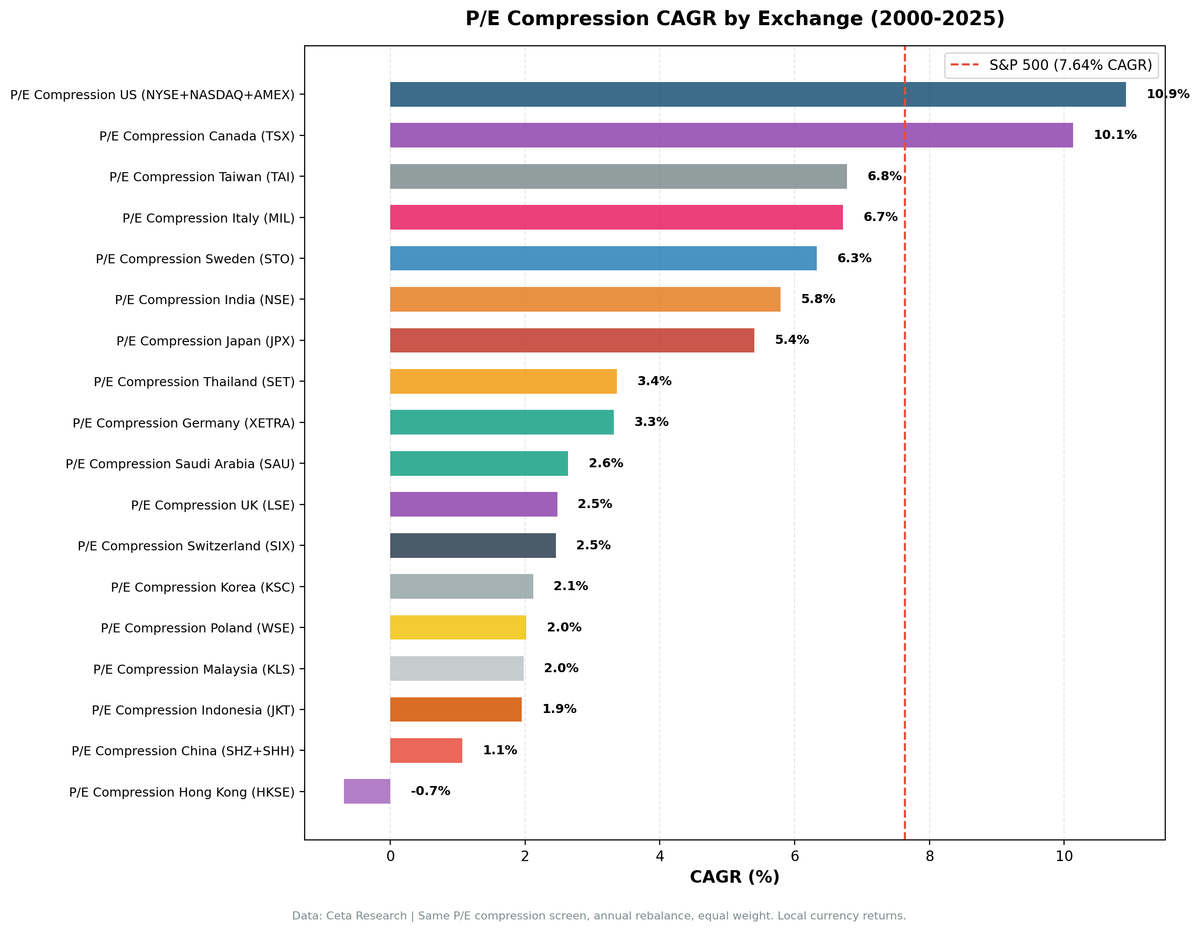
We tested P/E compression mean reversion on 21 global stock markets from 2000 to 2025. The signal: buy when a stock's current P/E ratio drops 15% below its 5-year historical average, filtered for quality (ROE > 10%, D/E < 2.0). Three markets can't be assessed at all because the strategy had too few investable periods. Of the 18 that can, 7 beat their benchmark and 11 don't. Two of those seven don't survive a closer look.
Contents
- What Changed, and Why
- Method
- Two Caveats to Read the Table With
- Results: 7 Markets Beat Their Benchmark
- Markets That Don't Beat Their Benchmark
- Drawdowns
- Three Markets Can't Run the Strategy At All
- Exchange-Listed Is Not the Same as Domestic
- Key Insights
- 1. The data problem was bigger than the benchmark problem
- 2. A cash rule that fires on missing data manufactures alpha
- 3. Coverage, not geography, predicts where this works
- 4. What survives is narrow
- Limitations
- Conclusion
This version corrects a significant error in the previous one, which reported 8 winners including a UK result that has since collapsed from +8.86% to +1.62%. The section below explains what was wrong.
Data: FMP financial data warehouse, 2000-2025. Updated August 2026.
What Changed, and Why
The backtest held cash when fewer than 10 stocks passed the screen. It never checked how many of those stocks actually had a usable price at the rebalance date.
That distinction turns out to matter enormously outside the US. FMP's fundamentals history reaches much further back than its end-of-day price history, and the gap is largest in exactly the markets where we reported the biggest alpha. In 2000, the London Stock Exchange had 444 of 7,107 symbols with any price data, against 5,308 in 2021. Switzerland had 97 of 659. Thailand had 188 of 1,042.
So the screen would find 30 qualifying companies, four or five of them could be priced, and the average of those few shipped as a 30-stock portfolio return. The handful that could be priced skew heavily toward large survivors, which is why those numbers looked so good. They were measuring the order in which FMP backfilled its data.
The backtest now re-checks the 10-name minimum after pricing. Markets with thin early coverage lose their pre-2010 record and hold cash instead. Three headline results changed:
| Market | Old excess | New excess | Investable periods |
|---|---|---|---|
| UK (LSE) | +8.86% | +1.62% | 16 of 25 |
| Switzerland (SIX) | +3.47% | +0.56% | 12 of 25 |
| Thailand (SET) | +3.90% | -0.80% | 14 of 25 |
Canada and the US both improved, to +5.69% and +3.27%.
Method
Data source: Ceta Research (FMP financial data warehouse) Signal: Current P/E < 85% of 5-year avg, P/E 5-40, ROE > 10%, D/E < 2.0 Portfolio: Top 30 by compression ratio, equal weight, annual rebalance (January) Period: 2000-2025 (25 years) Benchmark: Local equity index for each exchange. SPY where no local index is available. Execution: Next-day close (mark-on-close execution model) Cash rule: Hold cash if fewer than 10 stocks qualify and can be priced
Market cap thresholds vary by exchange to reflect local liquidity.
Two Caveats to Read the Table With
The benchmark excludes dividends almost everywhere. Portfolio returns use dividend-adjusted prices, but only two benchmarks in this study are total-return series: SPY, which is a dividend-adjusted ETF, and the DAX, which is a performance index that reinvests dividends by construction. Every other index here (FTSE 100, SMI, OMX Stockholm 30, TAIEX, Nikkei 225, Sensex, TSX Composite, Hang Seng, KOSPI, SSE Composite, SET Index) is a price index. Their excess figures are overstated by roughly the local dividend yield, which ranges from about 1% in India to about 3.5% in the UK, Sweden and Taiwan. We disclose this rather than adjusting the numbers, because a like-for-like reconstruction would require total-return series we don't have.
Cash periods are the real constraint. Only four markets stayed invested in nearly every period: the US (25 of 25), China (25), Canada (24) and Germany (22). The rest held cash for anywhere between 4 of the 25 periods (Japan) and 22 of 25 (Singapore), because the screen couldn't find 10 names it could price. A statistic computed across a series with 13 zero-exposure years is describing the cash rule as much as the signal.
Results: 7 Markets Beat Their Benchmark
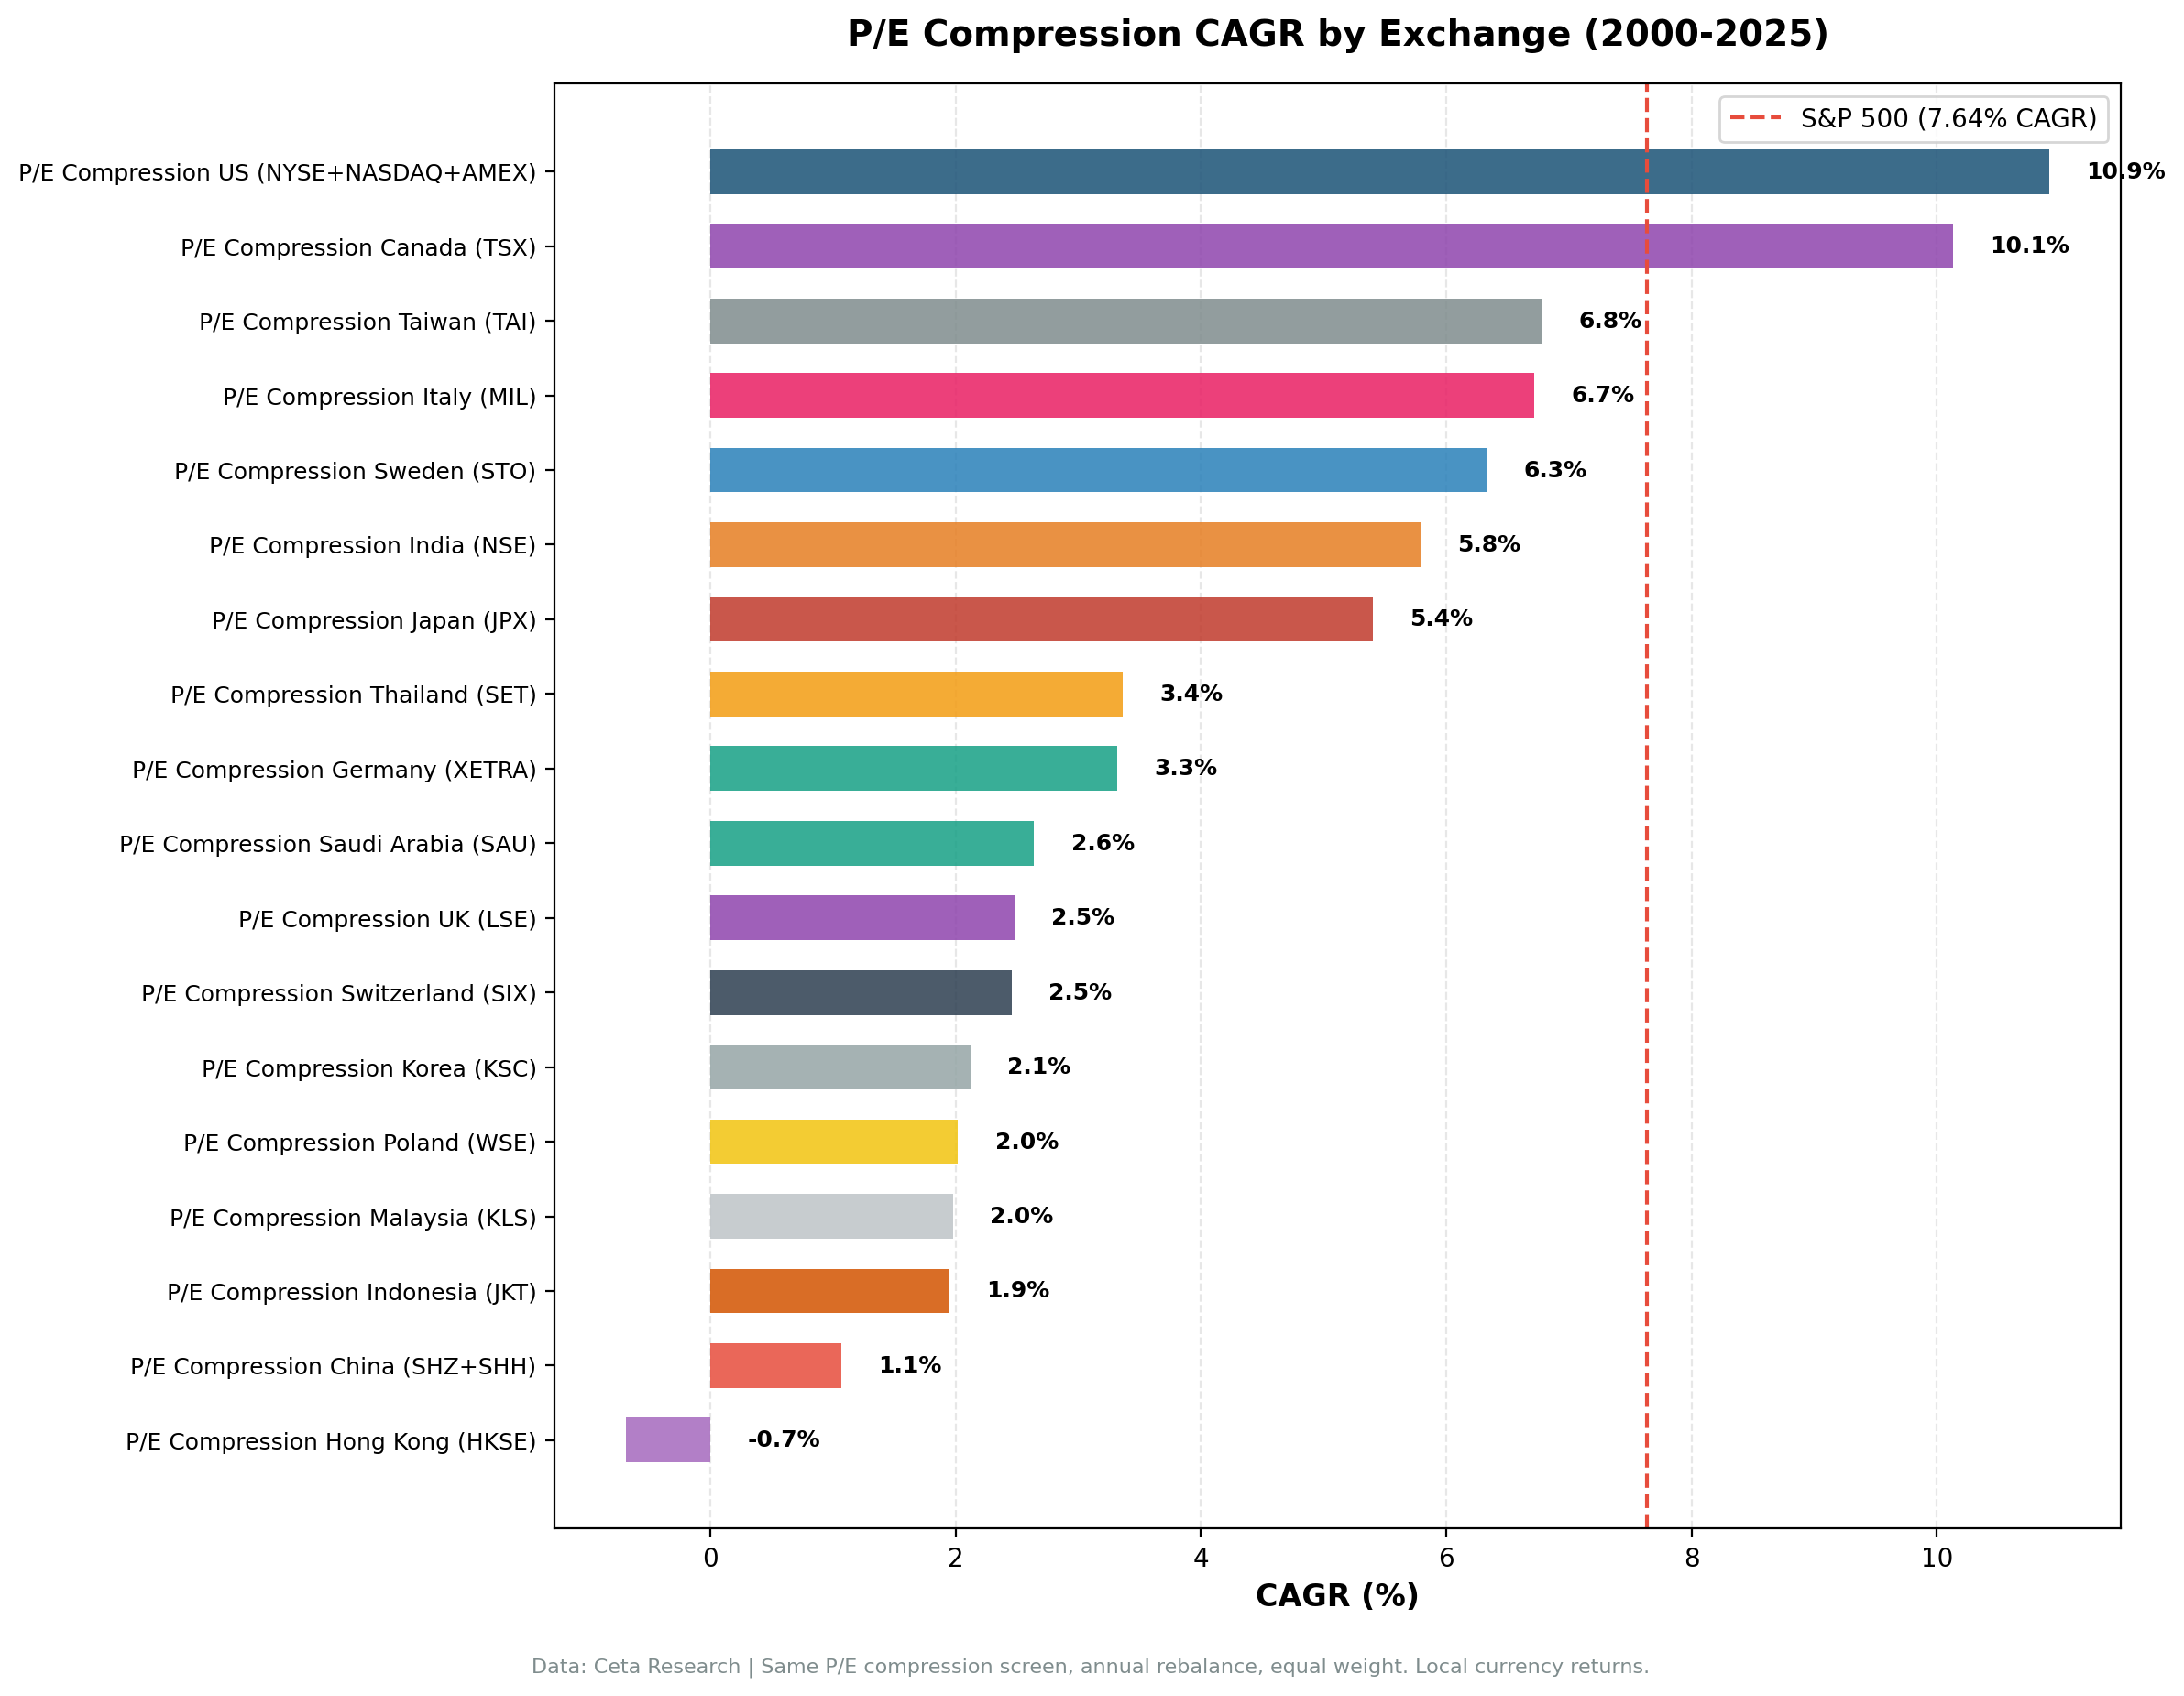
| Exchange | CAGR | Benchmark | Bench CAGR | Excess | Sharpe | MaxDD | Invested |
|---|---|---|---|---|---|---|---|
| Canada (TSX) | 10.13% | TSX Composite | 4.44% | +5.69% | 0.415 | -32.02% | 24/25 |
| Sweden (STO) | 6.33% | OMX Stockholm 30 | 2.95% | +3.37% | 0.283 | -22.71% | 13/25 |
| US (NYSE/NASDAQ/AMEX) | 10.92% | S&P 500 | 7.64% | +3.27% | 0.424 | -40.38% | 25/25 |
| Taiwan (TAI) | 6.78% | TAIEX | 3.91% | +2.87% | 0.284 | -14.58% | 16/25 |
| Japan (JPX) | 5.40% | Nikkei 225 | 2.95% | +2.45% | 0.258 | -52.28% | 21/25 |
| UK (LSE) | 2.48% | FTSE 100 | 0.86% | +1.62% | -0.089 | -31.12% | 16/25 |
| Switzerland (SIX) | 2.46% | SMI | 1.90% | +0.56% | 0.148 | -19.86% | 12/25 |
Only three of these survive scrutiny.
Canada, the US and Japan are the real results. Canada's +5.69% clears the TSX Composite's roughly 2.5% to 3% yield with room to spare, and it's invested in 24 of 25 periods. The US +3.27% is measured against a genuine total-return benchmark, so no adjustment applies. Japan's +2.45% clears the Nikkei's roughly 1.5% to 2% yield and comes with a 64% win rate, second only to Canada's 76%.
Sweden and Taiwan clear the nominal bar but not the yield gap. Both the OMX Stockholm 30 and the TAIEX yield roughly 3.5%, which is more than either margin. Both are also invested in about half the periods (13 and 16 of 25).
The UK and Switzerland are not wins. The FTSE 100 yields roughly 3.5% against a +1.62% headline, and the SMI roughly 2.5% to 3% against +0.56%. Both go negative on a like-for-like basis. Switzerland has a second problem covered below.
Markets That Don't Beat Their Benchmark
| Exchange | CAGR | Benchmark | Bench CAGR | Excess | Sharpe | MaxDD | Invested |
|---|---|---|---|---|---|---|---|
| Thailand (SET) | 3.36% | SET Index | 4.16% | -0.80% | 0.057 | -27.56% | 14/25 |
| Italy (MIL) | 6.72% | S&P 500 | 7.64% | -0.92% | 0.207 | -17.74% | 13/25 |
| Germany (XETRA) | 3.32% | DAX | 4.45% | -1.13% | 0.078 | -38.67% | 22/25 |
| Hong Kong (HKSE) | -0.69% | Hang Seng | 0.49% | -1.18% | -0.141 | -62.68% | 20/25 |
| Korea (KSC) | 2.12% | KOSPI | 3.32% | -1.21% | -0.081 | -19.19% | 13/25 |
| China (SHZ/SHH) | 1.07% | SSE Composite | 3.54% | -2.48% | -0.035 | -70.04% | 25/25 |
| Saudi Arabia (SAU) | 2.64% | S&P 500 | 7.64% | -5.00% | -0.079 | -18.45% | 10/25 |
| India (NSE) | 5.79% | Sensex | 11.40% | -5.61% | -0.023 | -52.25% | 17/25 |
| Poland (WSE) | 2.02% | S&P 500 | 7.64% | -5.63% | -0.240 | -26.32% | 10/25 |
| Malaysia (KLS) | 1.98% | S&P 500 | 7.64% | -5.67% | -0.002 | -17.25% | 10/25 |
| Indonesia (JKT) | 1.95% | S&P 500 | 7.64% | -5.69% | -0.006 | -17.21% | 13/25 |
Italy, Saudi Arabia, Poland, Malaysia and Indonesia are measured against SPY because no usable local index exists in the dataset. Those five are not local-benchmark tests, and the size of their deficits mostly reflects how strong the S&P 500 was over this period rather than anything about the strategy. Treat them as unresolved rather than as failures.
Germany is the most informative negative. The DAX is a performance index that reinvests dividends, so Germany and the US are the only two markets where the comparison needs no adjustment at all. Germany was invested in 22 of 25 periods. It's the cleanest fair test in the study outside the US, and the answer is -1.13%.
China is the cleanest failure. Fully invested for all 25 periods, so there's no data gap to blame, and it still loses to the SSE Composite by 2.48% a year with a -70.04% max drawdown, the worst in the study.
India is the largest local-benchmark deficit, but its shape is unusual: 2000 through 2007 have no position at all, and the Sensex returned roughly 280% cumulatively over those eight years. Across the 17 years the strategy was actually invested it beat the Sensex in 9. The right conclusion is that we can't test this properly in India before 2008.
Drawdowns
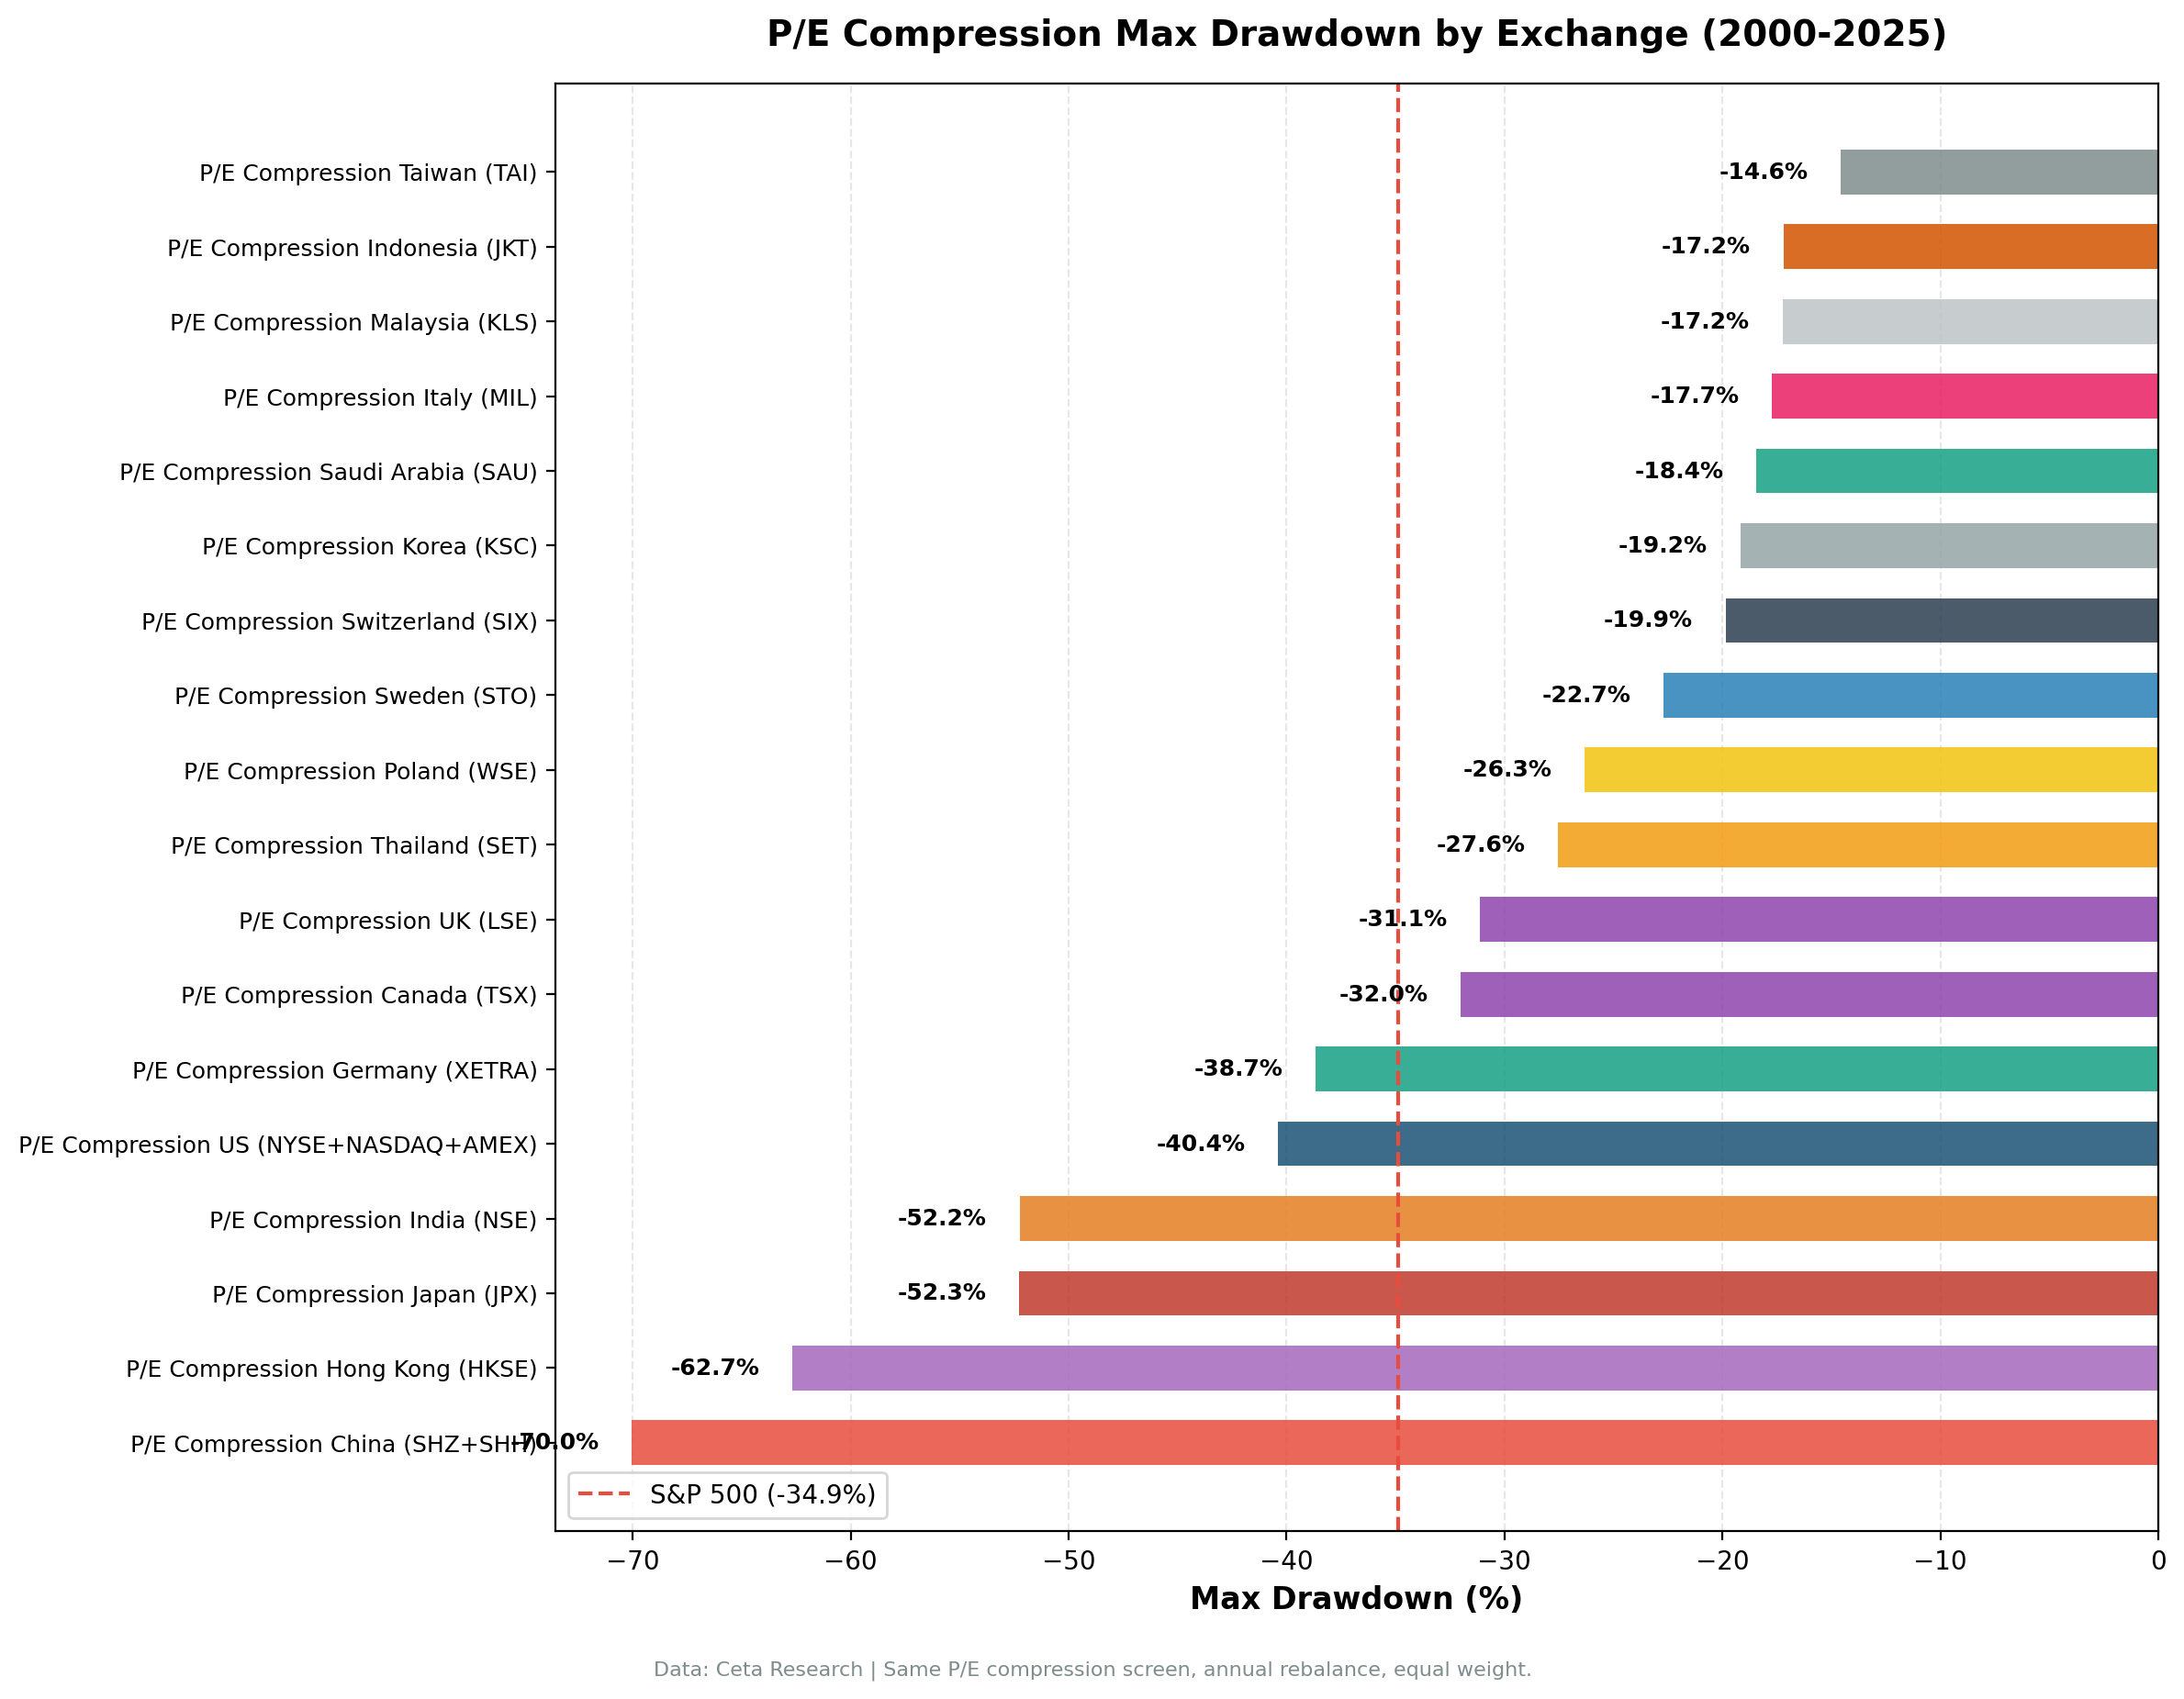
Drawdown separates the markets more cleanly than return does. Taiwan (-14.58%), Malaysia (-17.25%), Indonesia (-17.21%) and Italy (-17.74%) all kept the worst loss under 20%, but each of them was invested in only 10 to 16 of 25 periods, so a shallow drawdown partly reflects time spent in cash. Among the markets invested in nearly every period, Canada's -32.02% is the best and China's -70.04% the worst.
Three Markets Can't Run the Strategy At All
| Exchange | Invested periods | Why |
|---|---|---|
| South Africa (JNB) | 8 of 25 | thin price coverage, 17 periods in cash |
| Singapore (SES) | 3 of 25 | small universe, 22 periods in cash |
| Norway (OSL) | 2 of 25 | ^OSEAX has no price data before 2013, so 14 of 25 periods have no benchmark at all |
We don't quote a CAGR for these three. A 25-year compound growth rate computed over 2 or 3 investable years isn't a strategy result, and Norway's case is worse still: its benchmark index doesn't exist for the first half of the study, so more than half of the periods have nothing to compare against.
The previous version of this post reported Norway at 5.10% CAGR with 80% cash, and Singapore at 1.08%. Those numbers shouldn't have been published.
Exchange-Listed Is Not the Same as Domestic
Screens select every company listed on an exchange. Outside the US, a large share of those listings are foreign companies' secondary lines. We re-ran the two European markets with a blog of their own under a domicile-restricted universe:
| Market | All listings | Domiciled only | Invested periods |
|---|---|---|---|
| Switzerland (SIX) | +0.56% | -1.62% | 12 of 25, unchanged |
| Germany (XETRA) | -1.13% | -0.28% | 22 → 18 of 25 |
Switzerland's small positive excess inverts once you require the company to actually be Swiss, and the investable-period count doesn't move, so this isn't a coverage effect. Whatever edge existed belonged to foreign businesses that happen to list in Zurich, and those are available on their home exchanges anyway.
Germany moves the other way and closer to breakeven, which means XETRA's foreign listings were a mild drag rather than a hidden source of return.
Key Insights
1. The data problem was bigger than the benchmark problem
The previous version of this analysis was mostly about benchmark choice: SPY overstates failure in markets whose local indices underperformed. That's still true, and it's why Japan and the UK look different against local indices than against the S&P 500.
But benchmark choice turned out to be the smaller of two errors. The larger one was reporting four-stock portfolios as thirty-stock portfolios in every market where FMP's price history is shorter than its fundamentals history. Fixing that removed more alpha than the benchmark change ever added.
2. A cash rule that fires on missing data manufactures alpha
When a strategy holds cash because the data isn't there, it will show large positive excess in every bad benchmark year it happens to sit out. Thailand's old +3.90% came almost entirely from being "in cash" during the SET's 46% crash in 2000 and 43% crash in 2008. It wasn't a decision. It was an absence.
The tell is a strategy that reports both excellent downside protection and a high cash percentage. Those are usually the same fact wearing two hats. Switzerland's old 23.86% down-capture was exactly this: it was in cash for every SMI drawdown before 2009.
3. Coverage, not geography, predicts where this works
The four markets invested in nearly every period are the US, China, Canada and Germany. Two of them are among the best results in the study and two are among the worst, so coverage doesn't determine the answer. What it determines is whether you can trust the answer at all.
4. What survives is narrow
Three markets: Canada, the US and Japan. All three are developed markets with deep price history, and all three clear their benchmark by more than its dividend yield. That's a real finding, and a much smaller one than "the strategy works in 8 of 21 markets".
Limitations
The benchmark excludes dividends in 16 of 18 assessable markets. Only the US (SPY) and Germany (DAX) get a like-for-like comparison. Everywhere else the excess is overstated by roughly the local yield.
Five markets have no local benchmark. Italy, Saudi Arabia, Poland, Malaysia and Indonesia are measured against SPY, which is not the alternative a local investor faces. Their results are unresolved, not conclusive.
Currency effects. Local-currency returns are compared against local benchmarks. Cross-market comparisons remain complicated by FX volatility unrelated to stock selection.
Survivorship bias. Exchange membership uses current profiles. Delistings over 25 years aren't fully tracked, and this compounds the price-coverage problem rather than offsetting it.
Lookback sensitivity. The 5-year P/E average is a parameter choice. Different windows would change results. We didn't optimize it.
Conclusion
P/E compression beats its benchmark in 7 of the 18 markets where it can be assessed. Adjust for the fact that most of those benchmarks exclude dividends and the list narrows to three: Canada (+5.69%), the US (+3.27%) and Japan (+2.45%).
Three more markets, South Africa, Singapore and Norway, have too few investable periods to judge at all.
The methodological finding is the more useful one. A backtest that checks whether enough stocks pass a screen, but not whether those stocks can actually be bought, will generate convincing alpha in any market whose price history is shorter than its fundamentals history. That describes most of the world outside the United States, and it produced a +8.86% UK result that we published and have now had to withdraw.
Data: Ceta Research (FMP financial data warehouse). Local-currency returns vs local benchmarks. SPY used where no local index is available. Only SPY and the DAX are total-return series; the other benchmarks are price indices that do not reinvest dividends. Past performance does not guarantee future results. Not investment advice. Full methodology: github.com/ceta-research/backtests

