
Thailand P/E Compression: -0.80% vs the SET, and 11 Years With No Position
P/E compression on Thai stocks returns 3.36% annually vs 4.16% for the SET Index. The earlier +3.90% alpha was an artifact of thin price data. The strategy had no position at all in 11 of 25 years.

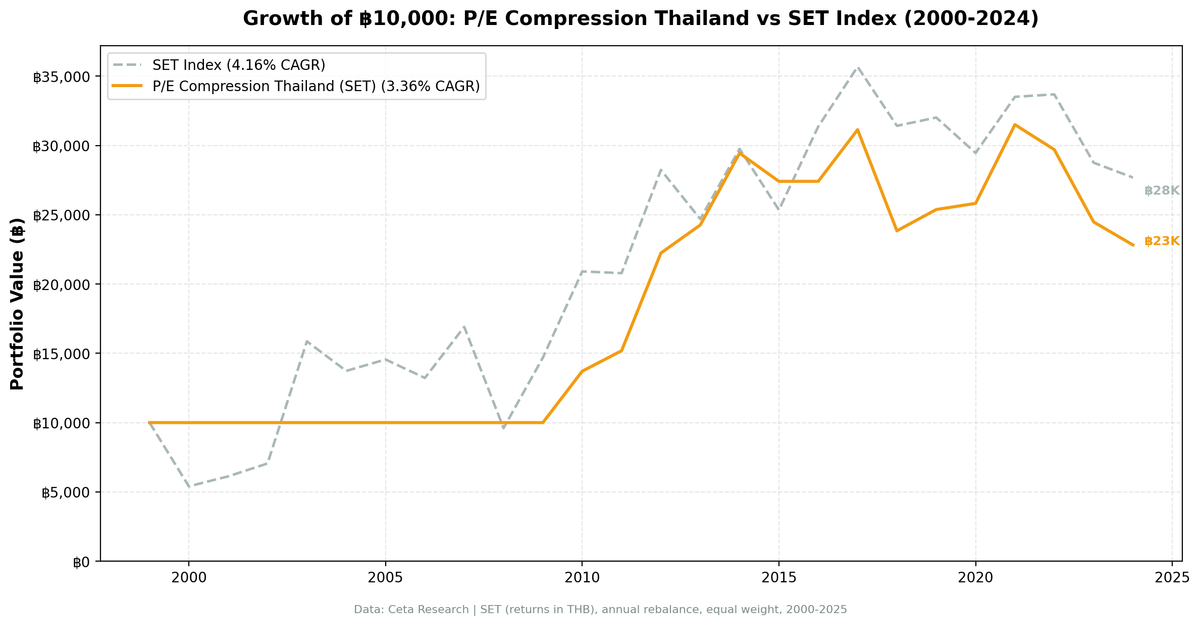
We tested P/E compression mean reversion on 25 years of Thai stock data from the SET. The strategy returned 3.36% annually (THB-denominated) vs 4.16% for the SET Index, underperforming by 0.80% a year. It also had no position at all in 11 of those 25 years, including the entire 2000-2009 stretch. An earlier version of this post reported +3.90% alpha. That number was an artifact of thin price data, and it's gone.
Contents
- What Changed From Our Earlier Version
- Method
- What We Found
- 25 years, 14 of them invested, and a negative result.
- Year-by-year returns
- The invested years are the interesting part
- Why the early-2000s "protection" was never real
- Backtest Methodology
- Limitations
- Conclusion
Data: FMP financial data warehouse, 2000-2025. Updated August 2026.
What Changed From Our Earlier Version
The backtest held cash when fewer than 10 stocks passed the screen, but never checked how many of those stocks could actually be priced at the rebalance date. FMP's Thai price coverage is thin early: 188 of 1,042 SET symbols had any end-of-day data in 2000 against 718 in 2021. The screen would find 30 qualifying companies, a handful could be priced, and the average of those few shipped as a portfolio return.
That mattered enormously here, because the earlier version's whole story was built on the early 2000s. It reported cash in 2000 (SET -46%) and 2008 (SET -43%) as evidence the cash rule was protective, and a 9.14% down-capture as evidence of near-zero sensitivity to SET drawdowns.
Once the 10-name minimum is enforced after pricing, the strategy has no investable period before 2010 at all. Both the alpha and the down-capture story go with it. The cash years weren't a signal, they were an absence of data.
Method
Data source: Ceta Research (FMP financial data warehouse) Universe: SET, market cap > ฿10B (roughly $300M USD equivalent) Period: 2000-2025 (25 years, 25 annual periods, 14 invested) Rebalancing: Annual (January), equal weight, top 30 by compression ratio Benchmark: SET Index (^SET.BK, THB, price index) Execution: Next-day close (mark-on-close) Cash rule: Hold cash if fewer than 10 stocks qualify and can be priced
Returns are in THB.
What We Found
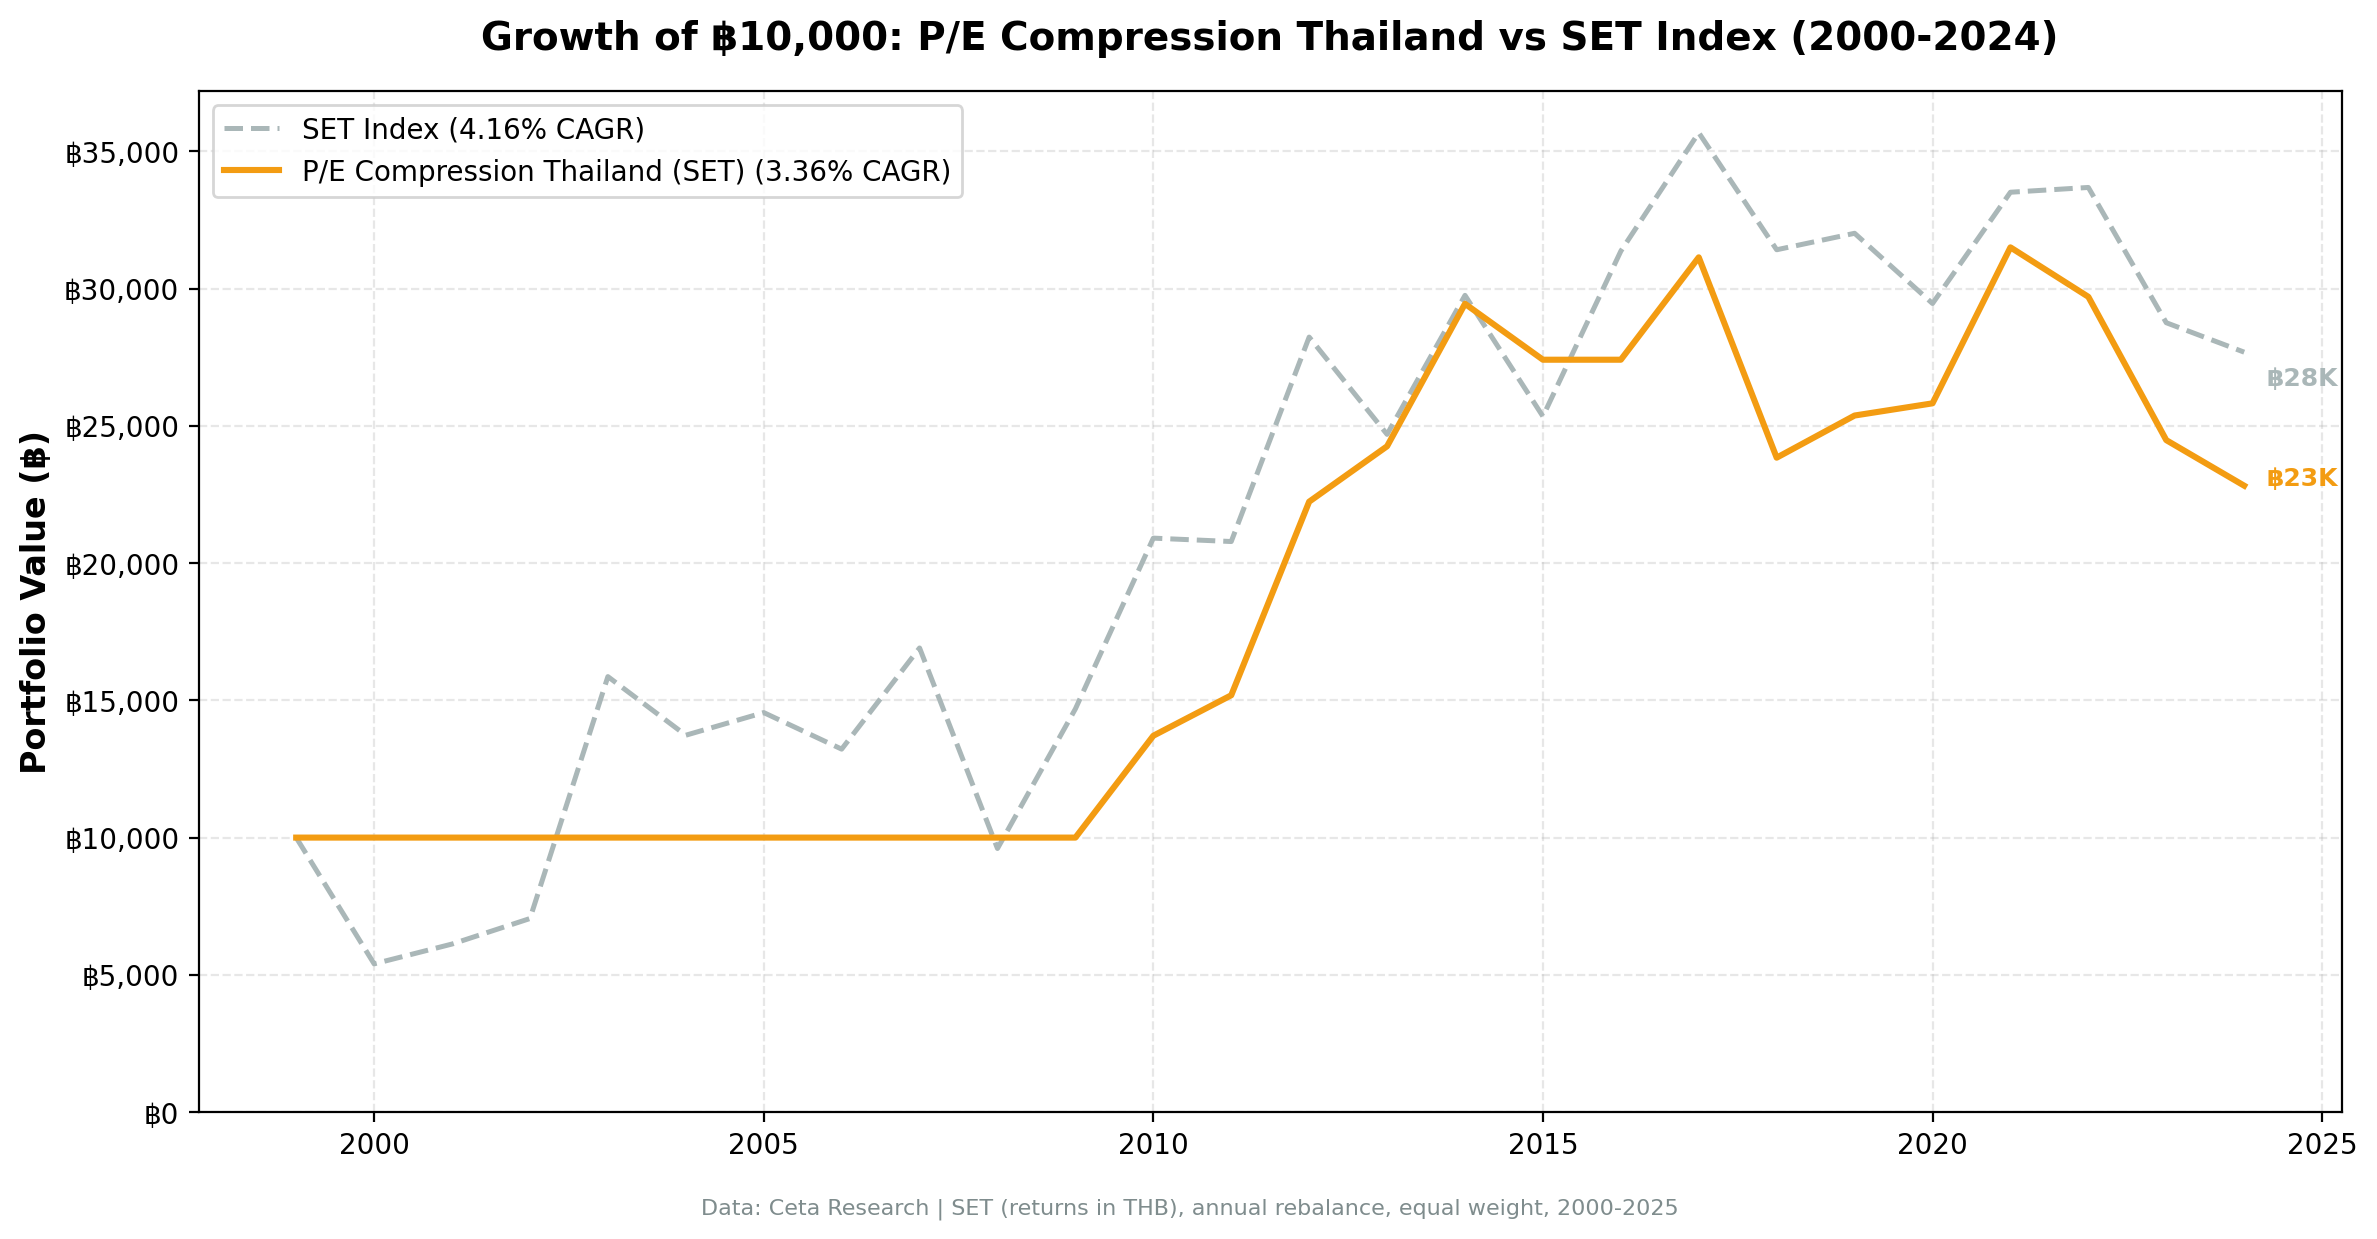
25 years, 14 of them invested, and a negative result.
| Metric | P/E Compression (Thailand) | SET Index |
|---|---|---|
| CAGR | 3.36% | 4.16% |
| Total Return | 128% | 177% |
| Excess CAGR | -0.80% | - |
| Sharpe Ratio | 0.057 | - |
| Sortino Ratio | 0.115 | - |
| Max Drawdown | -27.56% | - |
| Up Capture | 35.97% | 100% |
| Down Capture | 18.60% | 100% |
| Avg Stocks per Year | 22.5 | - |
| Cash Periods | 11 of 25 (44%) | - |
The capture ratios look extraordinary at 36% up and 19% down. They aren't a risk profile. They're what you get when a series contains 11 zero-return years scattered across both up and down markets. Any strategy with that much cash will show suppressed capture in both directions, and it tells you nothing about how the invested portfolio behaves.
The benchmark also excludes dividends. Portfolio returns use dividend-adjusted prices, but ^SET.BK is the SET Index price index and does not reinvest dividends. The SET has yielded roughly 3% a year over this period, so a like-for-like total-return comparison widens the -0.80% deficit to somewhere near -4%.
Year-by-year returns
| Year | Portfolio | SET | Excess |
|---|---|---|---|
| 2000 | cash | -46.0% | +46.0% |
| 2001 | cash | +13.4% | -13.4% |
| 2002 | cash | +15.2% | -15.2% |
| 2003 | cash | +125.0% | -125.0% |
| 2004 | cash | -13.5% | +13.5% |
| 2005 | cash | +6.0% | -6.0% |
| 2006 | cash | -9.2% | +9.2% |
| 2007 | cash | +27.9% | -27.9% |
| 2008 | cash | -43.2% | +43.2% |
| 2009 | cash | +53.0% | -53.0% |
| 2010 | +37.1% | +42.4% | -5.2% |
| 2011 | +10.8% | -0.6% | +11.4% |
| 2012 | +46.4% | +35.8% | +10.6% |
| 2013 | +9.1% | -12.6% | +21.6% |
| 2014 | +21.4% | +20.5% | +0.9% |
| 2015 | -6.9% | -14.8% | +7.9% |
| 2016 | cash | +23.8% | -23.8% |
| 2017 | +13.6% | +13.8% | -0.1% |
| 2018 | -23.4% | -11.9% | -11.5% |
| 2019 | +6.4% | +1.9% | +4.5% |
| 2020 | +1.8% | -8.0% | +9.7% |
| 2021 | +22.0% | +13.8% | +8.2% |
| 2022 | -5.7% | +0.5% | -6.2% |
| 2023 | -17.6% | -14.6% | -3.0% |
| 2024 | -6.8% | -3.7% | -3.0% |
The invested years are the interesting part
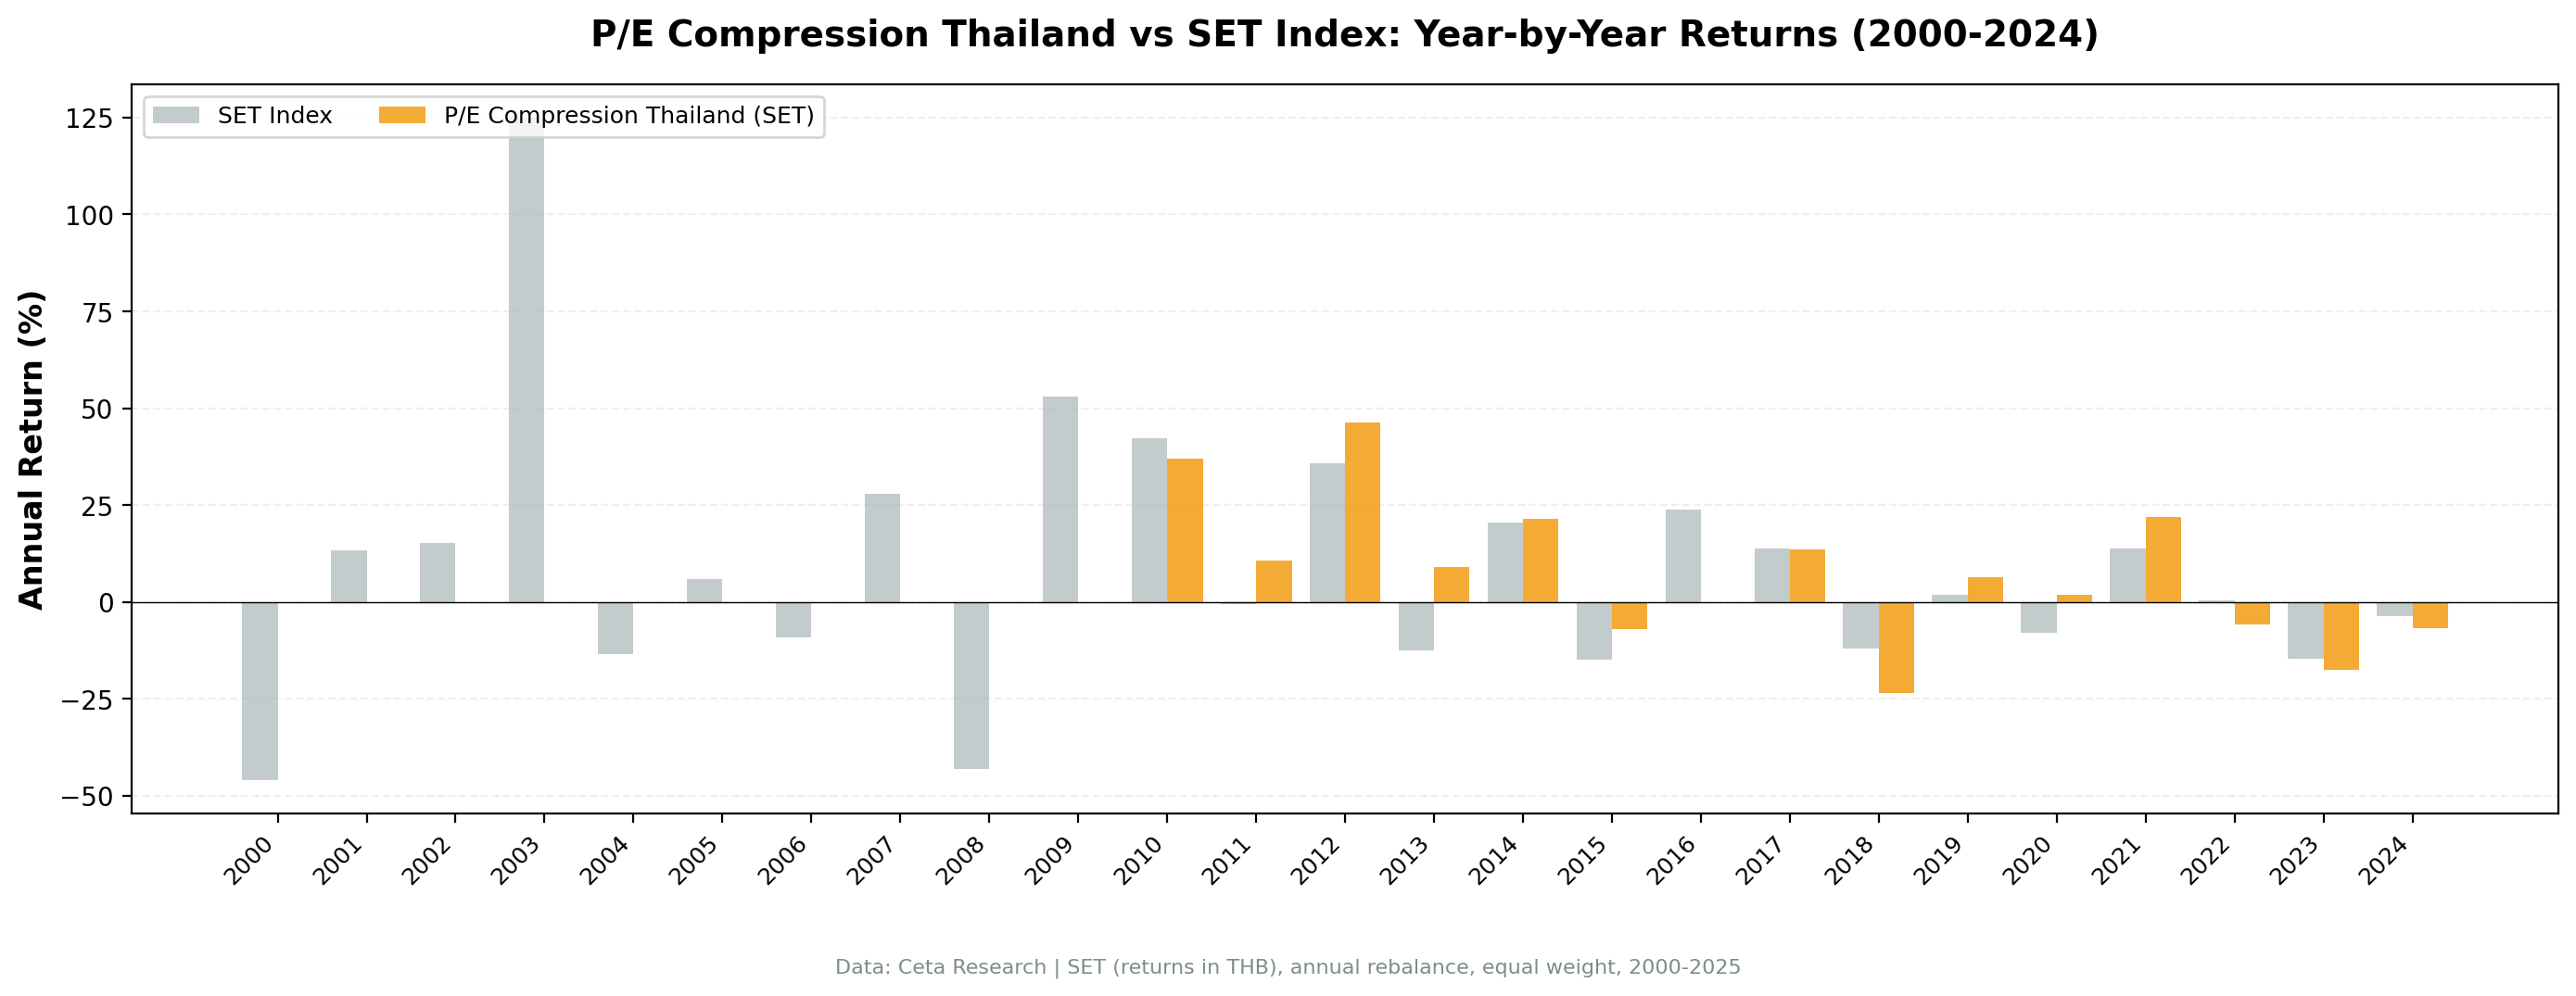
From 2010, where the price data supports the test, the strategy beat the SET in 8 of 15 years and had a genuinely good run through 2010-2015: +11.4%, +10.6% and +21.6% excess in three of those years, with the 2013 result coming while the SET itself fell 12.6%.
Then it stopped. From 2017 onward the strategy is behind the SET in 5 of 8 years, with 2018 the worst at -11.5%. Whatever was working in the early 2010s isn't now.
Why the early-2000s "protection" was never real
The cash years look protective in 2000 (SET -46%) and 2008 (SET -43%). They also look catastrophic in 2003 (SET +125%) and 2009 (SET +53%). Both readings are wrong for the same reason: the strategy wasn't making a decision in any of those years. It had fewer than 10 priceable Thai stocks that met the screen, so it held cash by default.
Excess return computed across those years measures the SET's own volatility, not the strategy. That's why the earlier +3.90% alpha and the 9.14% down-capture both disappeared the moment the cash rule started checking whether the screened names could actually be bought.
Backtest Methodology
Full methodology documentation: backtests/METHODOLOGY.md
| Parameter | Choice |
|---|---|
| Universe | SET, Market Cap > ฿10B |
| Signal | Current P/E < 85% of 5-year avg, P/E 5-40, ROE > 10%, D/E < 2.0 |
| Portfolio | Top 30 by lowest compression ratio, equal weight |
| Rebalancing | Annual (January) |
| Execution | Next-day close (mark-on-close) |
| Cash rule | Hold cash if fewer than 10 qualify and can be priced |
| Benchmark | SET Index (^SET.BK, THB, price index) |
| Period | 2000-2025 (25 years, 14 invested) |
| Returns | THB-denominated |
| Transaction costs | 0.5% one-way (emerging market tier) |
Limitations
44% of the study has no position. Eleven years, all of 2000-2009 plus 2016. Any statistic computed over the full series is partly describing that gap.
The benchmark excludes dividends. At a roughly 3% SET yield, a like-for-like comparison moves the result from -0.80% to around -4%.
Capture ratios are not meaningful here. 36% up-capture and 19% down-capture are cash artifacts, not a risk profile.
Small universe. The SET has fewer large-cap stocks with 5 years of P/E history than the US, UK or Canadian markets, which is the root cause of both the cash periods and the early data gap.
Recency. 2022, 2023 and 2024 are three straight years behind the SET. Combined with the 2017-2024 record of 3 wins in 8, the recent trend is worse than the headline.
Conclusion
Thailand doesn't work. P/E compression returned 3.36% a year against the SET Index's 4.16%, a deficit of 0.80% before the index's dividend yield is accounted for and closer to 4% after.
The invested stretch from 2010 to 2015 was genuinely good, and if the strategy still behaved that way it would be worth a second look. It hasn't since 2017.
The broader lesson from this market is about backtesting rather than about Thailand. A cash rule that fires because the data is missing looks identical to a cash rule that fires because the market is unattractive, and the first one will happily manufacture alpha in any market whose price history is shorter than its fundamentals history.
Data: Ceta Research (FMP financial data warehouse). Returns in THB. Benchmark: SET Index price index, which does not reinvest dividends. Past performance does not guarantee future results. Not investment advice. See full methodology at github.com/ceta-research/backtests.

