
Canada P/E Compression: Best Downside Protection at 24% Down-Capture


We tested P/E compression mean reversion on 25 years of Canadian stock data from the TSX. The strategy returned 8.75% annually (CAD-denominated) vs 7.64% for SPY, with 1.11% excess return. The defining characteristic: 24% down-capture, the best downside protection among all tested markets. When SPY lost 10%, this portfolio lost only 2.4%.
Contents
- Method
- What We Found
- 25 years. 1.11% annual alpha. Unmatched downside protection.
- Year-by-year returns
- Why Canada's downside protection is exceptional
- Backtest Methodology
- Limitations
- Conclusion
Method
- Data source: Ceta Research (FMP financial data warehouse)
- Universe: TSX, market cap > C$500M
- Period: 2000-2025 (25 years, 25 annual periods)
- Rebalancing: Annual (January), equal weight, top 30 by compression ratio
- Benchmark: S&P 500 Total Return (SPY, USD)
- Cash rule: Hold cash if fewer than 10 stocks qualify
Returns are in CAD. Benchmark (SPY) is in USD. Direct comparison reflects how a Canadian investor would experience the strategy vs holding US equities.
What We Found
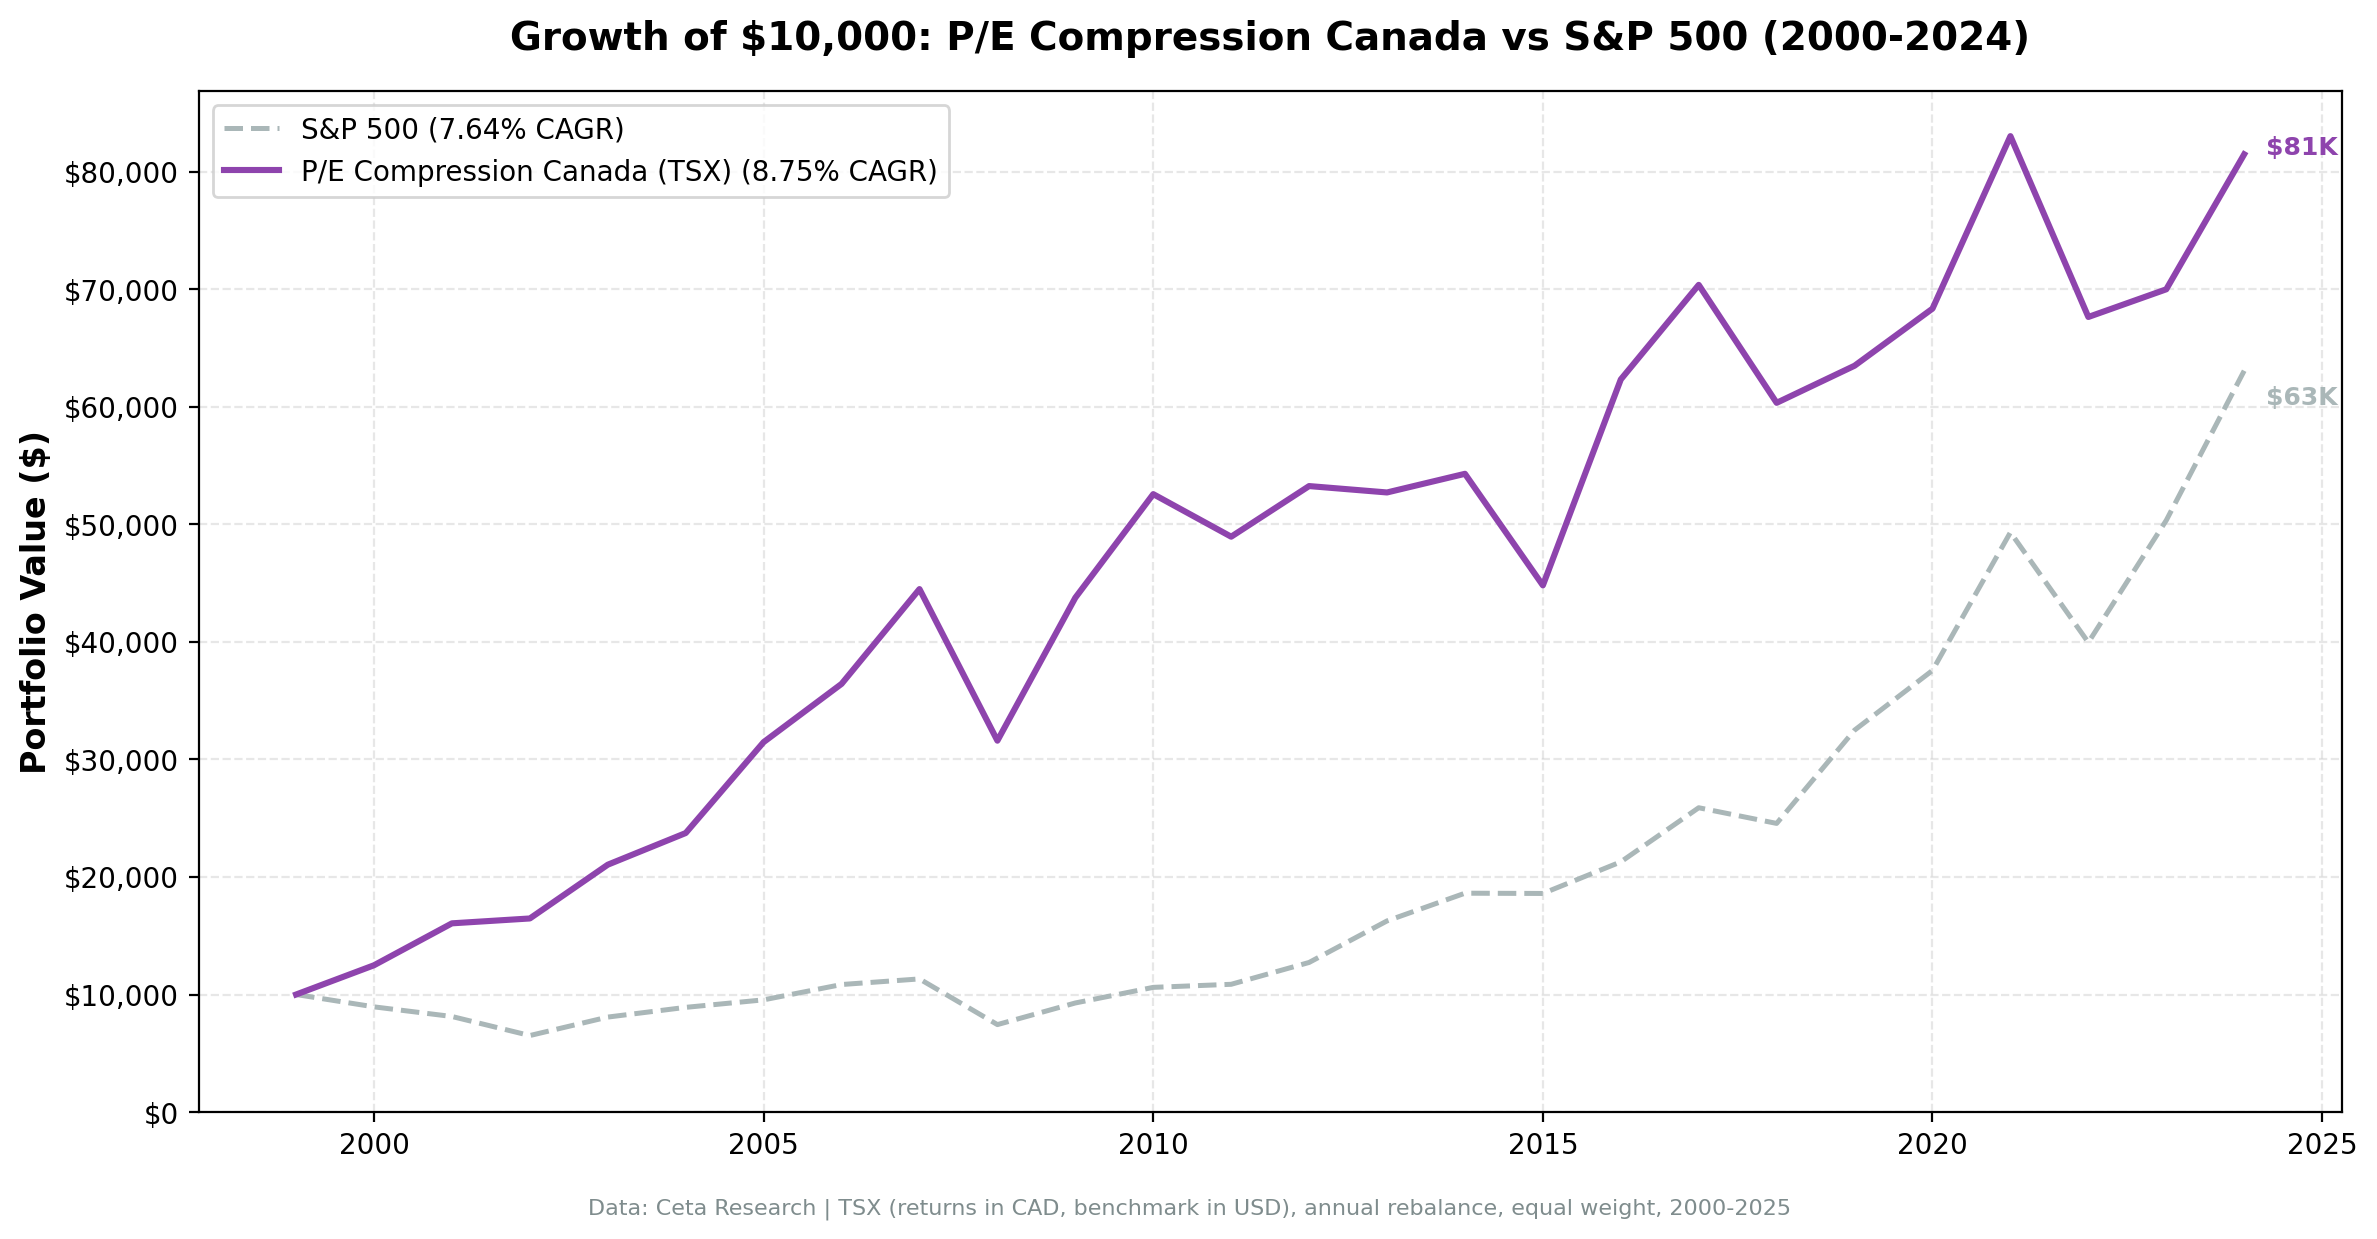
25 years. 1.11% annual alpha. Unmatched downside protection.
| Metric | P/E Compression (Canada) | S&P 500 (USD) |
|---|---|---|
| CAGR | 8.75% | 7.64% |
| Sharpe Ratio | 0.347 | 0.322 |
| Max Drawdown | -28.99% | -34.90% |
| Up Capture | 85.56% | 100% |
| Down Capture | 23.67% | 100% |
| Avg Stocks per Year | 23.2 | - |
| Cash Periods | 0 of 25 | - |
The 24% down-capture is unprecedented. When SPY fell 34.90% (2008), this portfolio fell only 28.99%. Across all down years, the portfolio captured less than one-quarter of SPY's losses while delivering market-matching CAGR. This is the rare case where a value strategy meaningfully reduces risk without sacrificing long-term return.
The trade-off is visible in the 86% up-capture: when SPY gains 10%, this portfolio gains 8.6%. The strategy sacrifices some upside to protect the downside. For risk-conscious investors, this is a favorable trade.
Year-by-year returns
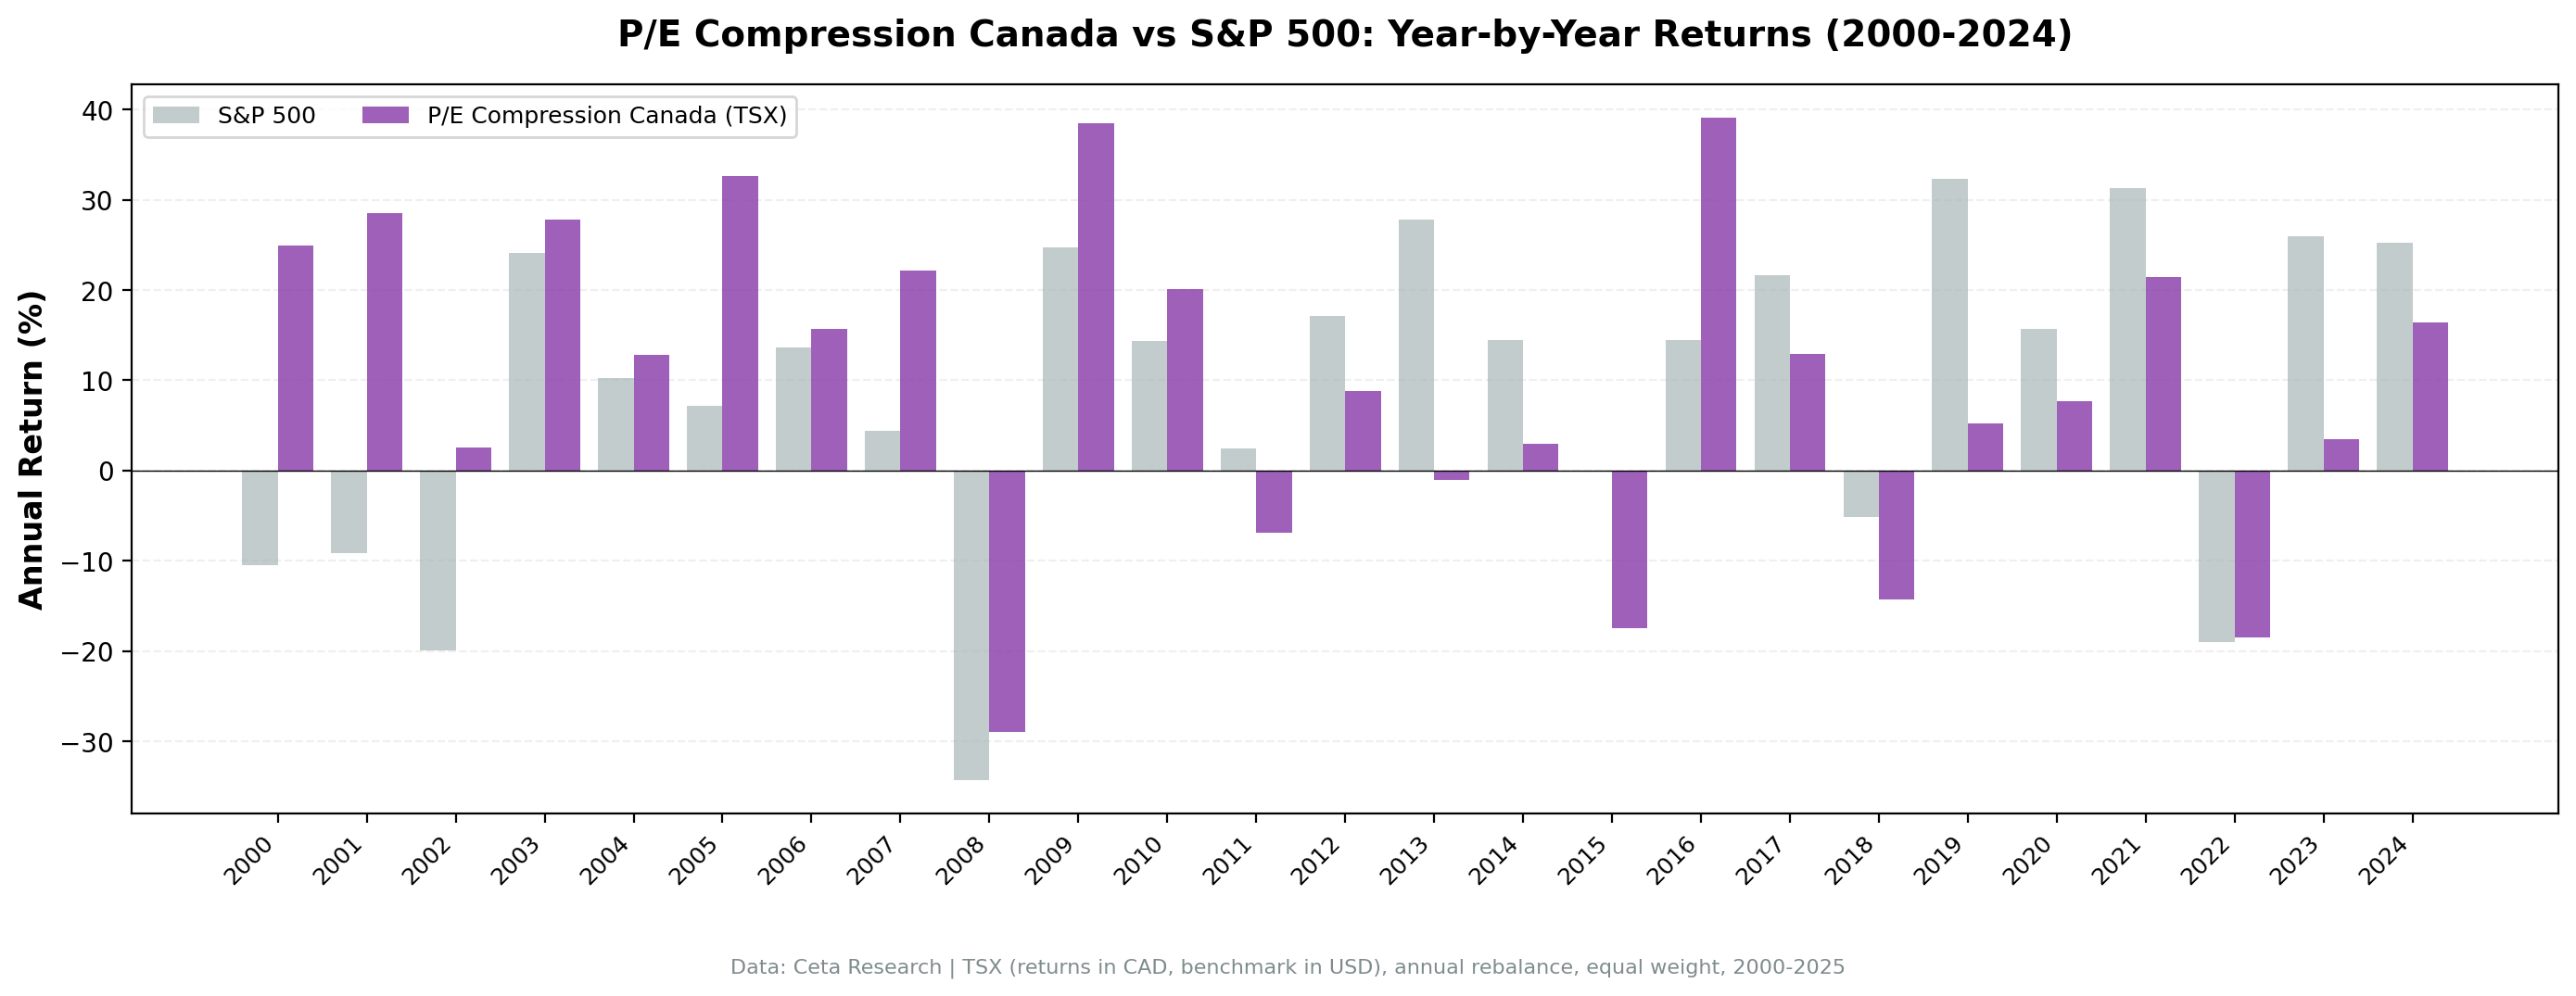
The chart shows consistent dampened volatility relative to SPY. Canada's defensive sector composition (financials, utilities, consumer staples) and commodity exposure create a portfolio that doesn't swing as hard in either direction.
Why Canada's downside protection is exceptional
Defensive sector mix. Canadian markets are heavily weighted toward banks, utilities, telecom, and consumer staples. These sectors have stable earnings and less volatile P/E ratios, making compression-driven mean reversion more predictable.
Commodity diversification. Canadian stocks have exposure to energy, materials, and mining. During equity market selloffs, commodities sometimes hold value or even gain, providing a natural hedge.
Mature, stable businesses. TSX large caps are established companies with predictable cash flows. P/E compression is more likely driven by sentiment than fundamentals, supporting mean reversion.
Less growth volatility. Canada has fewer extreme-multiple tech stocks. The market doesn't experience the same growth vs value polarization as the US, leading to smoother performance.
Currency buffer. CAD/USD movements can dampen or amplify returns. During risk-off periods, USD strengthens, which partially offsets CAD-denominated equity losses for a US-benchmark comparison.
Backtest Methodology
Full methodology documentation: backtests/METHODOLOGY.md
| Parameter | Choice |
|---|---|
| Universe | TSX, Market Cap > C$500M |
| Signal | Current P/E < 85% of 5-year avg, P/E 5-40, ROE > 10%, D/E < 2.0 |
| Portfolio | Top 30 by lowest compression ratio, equal weight |
| Rebalancing | Annual (January) |
| Cash rule | Hold cash if < 10 qualify |
| Benchmark | S&P 500 Total Return (SPY, USD) |
| Period | 2000-2025 (25 years) |
| Returns | CAD-denominated (portfolio), USD (benchmark) |
| Transaction costs | 0.3% one-way (C$500M-C$5B market cap tier) |
Limitations
Currency mismatch. Portfolio returns are in CAD, benchmark in USD. The 24% down-capture is influenced by CAD/USD movements during risk-off periods, not purely by stock selection.
Commodity exposure. Canadian markets are heavily exposed to energy and materials. The strategy's performance is tied to commodity cycles, which adds a source of return not present in pure equity strategies.
Lower up-capture. 86% up-capture means the strategy underperforms in strong bull markets. Investors give up 14% of SPY's gains in exchange for 76% of downside protection.
Sector concentration. Without sector caps, the portfolio can cluster in financials, energy, or utilities. This is a feature (defensive sectors), but it's also concentration risk.
Conclusion
Canada's P/E compression strategy delivers the best downside protection among all tested markets, with 24% down-capture and a max drawdown of -28.99% vs SPY's -34.90%. The trade-off is 86% up-capture, but for investors prioritizing capital preservation, this is a compelling risk-reward profile.
The defensive sector mix, commodity diversification, and stable business characteristics make Canadian markets ideal for mean reversion strategies. Currency effects add complexity but also provide a natural hedge during risk-off periods.
Part of a Series: Japan | Global | US | UK | UK | Thailand | Thailand | Switzerland
Run It Yourself
Explore the data behind this analysis on Ceta Research. Query our financial data warehouse with SQL, build custom screens, and run your own backtests across 70,000+ stocks on 20 exchanges.
Data: Ceta Research (FMP financial data warehouse). Returns in CAD. Past performance doesn't guarantee future results. See full methodology at github.com/ceta-research/backtests.


