value-investing
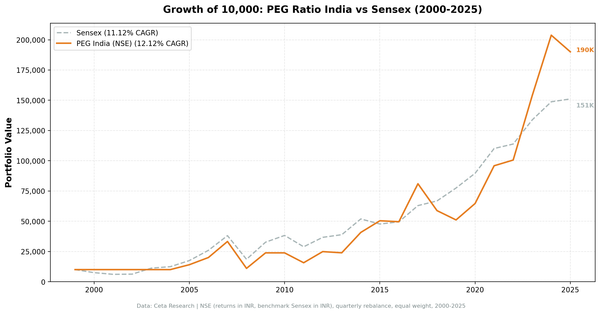
PEG Ratio in India: 12.1% CAGR Over 25 Years (+1.0%/yr vs Sensex)
PEG ratio on India's NSE: 12.12% CAGR over 25 years, +0.99%/yr vs the Sensex. The ride was violent, -67% in 2008, +116% in 2009. Here's the full data.

value-investing
PEG ratio on India's NSE: 12.12% CAGR over 25 years, +0.99%/yr vs the Sensex. The ride was violent, -67% in 2008, +116% in 2009. Here's the full data.
backtests
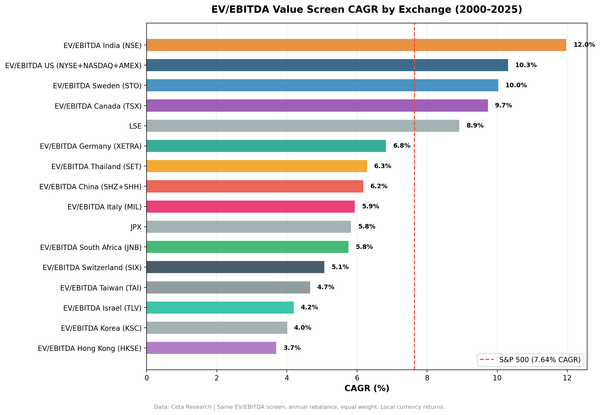
We tested EV/EBITDA below 10x on 17 global exchanges with local benchmarks. 14 of 17 beat their local index. The value premium is broader than SPY comparison suggested.
value-investing
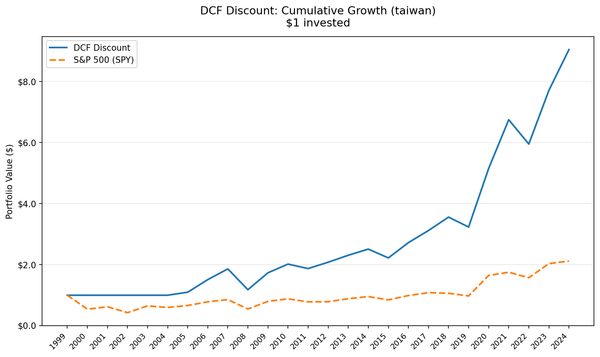
Taiwan's DCF discount portfolio returned 9.24% CAGR over 25 years, beating the TAIEX by +6.19% annually. The 0.399 Sharpe, -35.91% max drawdown (shallowest of any Asian market), and ~2.8:1 up/down capture asymmetry show strong risk-adjusted performance.
value-investing
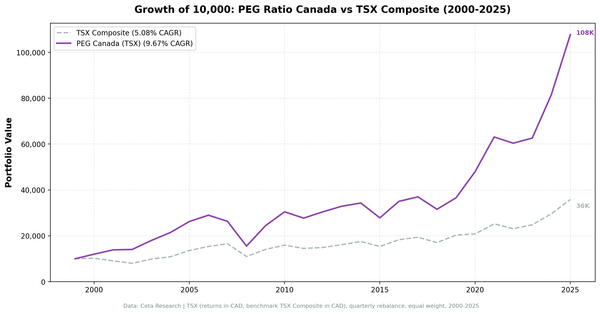
Canada's TSX PEG strategy delivered 9.67% CAGR with zero cash periods across 25 years, +4.59%/yr vs the TSX Composite. Next-day close execution, full backtest results and methodology.
value-investing
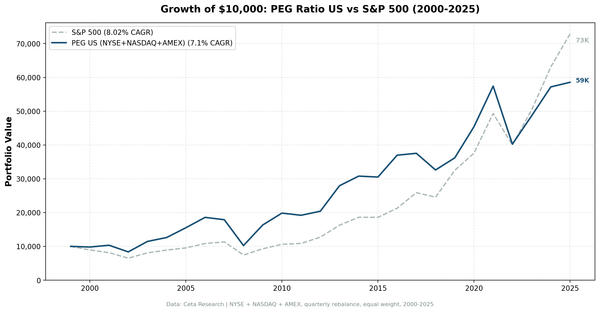
Peter Lynch's PEG ratio underperforms the full US exchange universe by 0.91%/yr over 25 years. Here's what works, what doesn't, and why universe selection changes everything.
value-investing
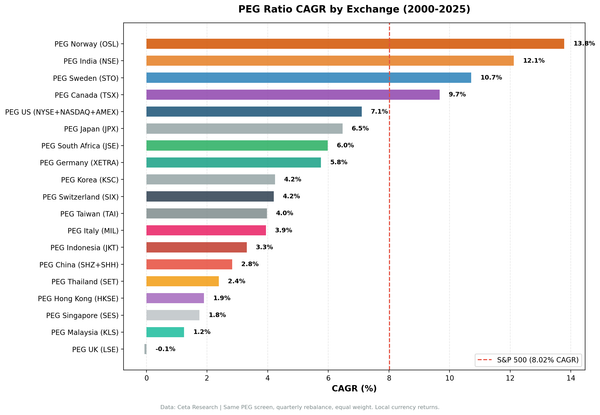
PEG ratio tested on 19 exchanges with local benchmarks. Sweden: +7.54% vs OMX30. Canada: +4.59% vs TSX. Japan: +3.07% vs Nikkei. India: +0.99% vs Sensex. 8 of 19 markets beat their home index. After the dividend adjustment, 4 of those 8 hold.
earnings
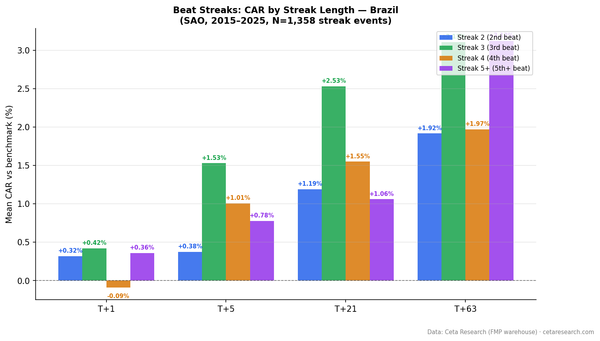
Brazilian beat streaks show back-loaded returns. The day-1 reaction is weak (+0.30%) but the drift builds to +2.49% by day 63. 1,358 events from 2015-2025 on B3. Update Aug 2026: the mirror leg now exists; miss streaks drift -1.52% at T+21 vs the Bovespa.
earnings
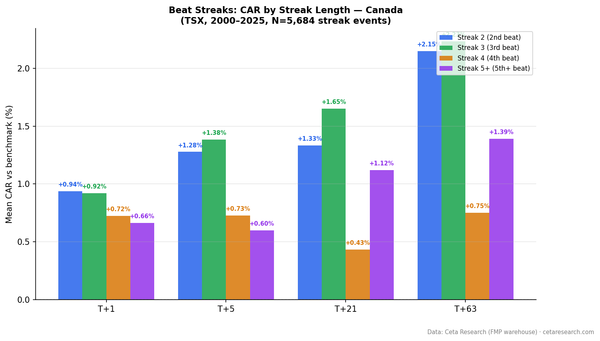
Canadian beat streaks produce twice the abnormal return of US stocks. 5,684 events on the TSX from 2000-2025. T+21 CAR of +1.22% vs +0.55% for US. Update Aug 2026: CARs embed the CAD/USD move; the mirror leg now exists (miss streaks -1.46% at T+21 vs the TSX Composite).
earnings
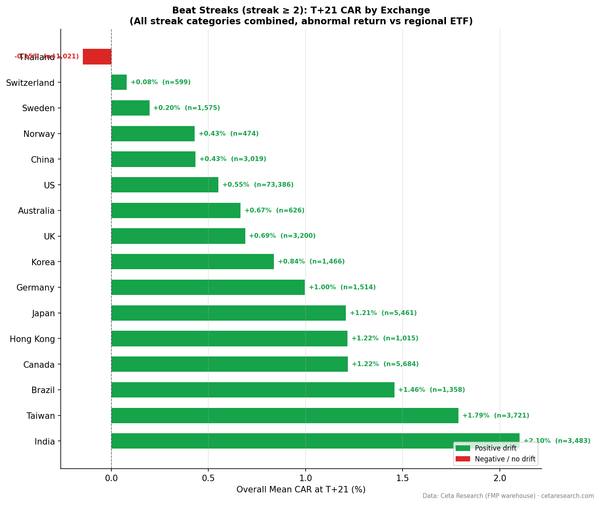
Earnings beat streaks tested across 16 exchanges, 2000-2025. 15 of 16 show positive T+21 CAR, India highest at +2.10%. Corrected August 2026: Germany and UK withdrawn as cross-listing artifacts. The 2026-08 mirror run adds the missing inverse: 9 of 10 markets pass, miss streaks drift down.
earnings
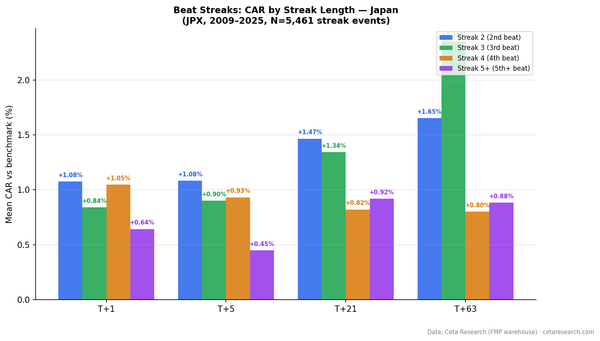
Japan shows the highest T+1 abnormal return of any exchange globally. 5,461 events on JPX from 2009-2025. Streak 3 reaches +2.35% at T+63, consistent with Japan's thinner analyst coverage. Update Aug 2026: the mirror leg now exists; miss streaks drift -1.97% at T+21 vs the Nikkei.
earnings
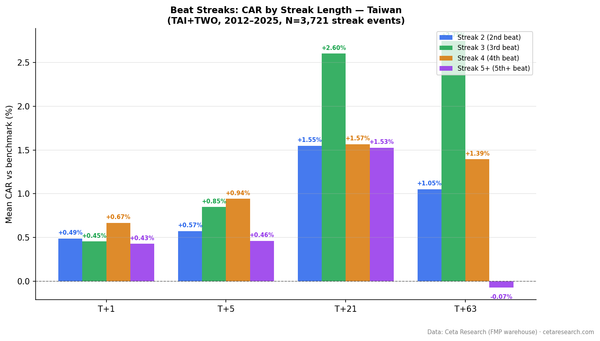
Taiwan drift builds to +1.79% by day 21, streak 3 to +2.60% T+21. 3,721 events from 2012-2025. Corrected August 2026: measured against SPY, so these are a Taiwan-minus-US spread. Update: a paired ^TWII run now shows beats +2.05% and miss streaks -0.92% at T+21. Local, and passes its inverse.
value investing
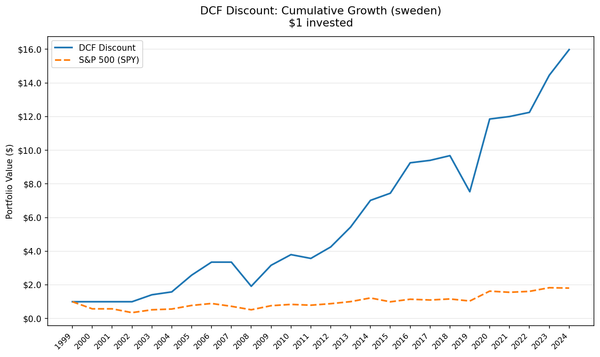
Sweden produced 14.57% CAGR from the DCF discount strategy vs 2.40% for the OMX Stockholm 30 (price-only). The +12.17% headline excess narrows to roughly +9 points after dividend adjustment, still the strongest local-benchmark result in our global comparison.