
DCF Discount on Swedish Stocks: 14.57% CAGR Over 25 Years on the Stockholm Exchange
Sweden produced 14.57% CAGR from the DCF discount strategy vs 2.40% for the OMX Stockholm 30 (price-only). The +12.17% headline excess narrows to roughly +9 points after dividend adjustment, still the strongest local-benchmark result in our global comparison.

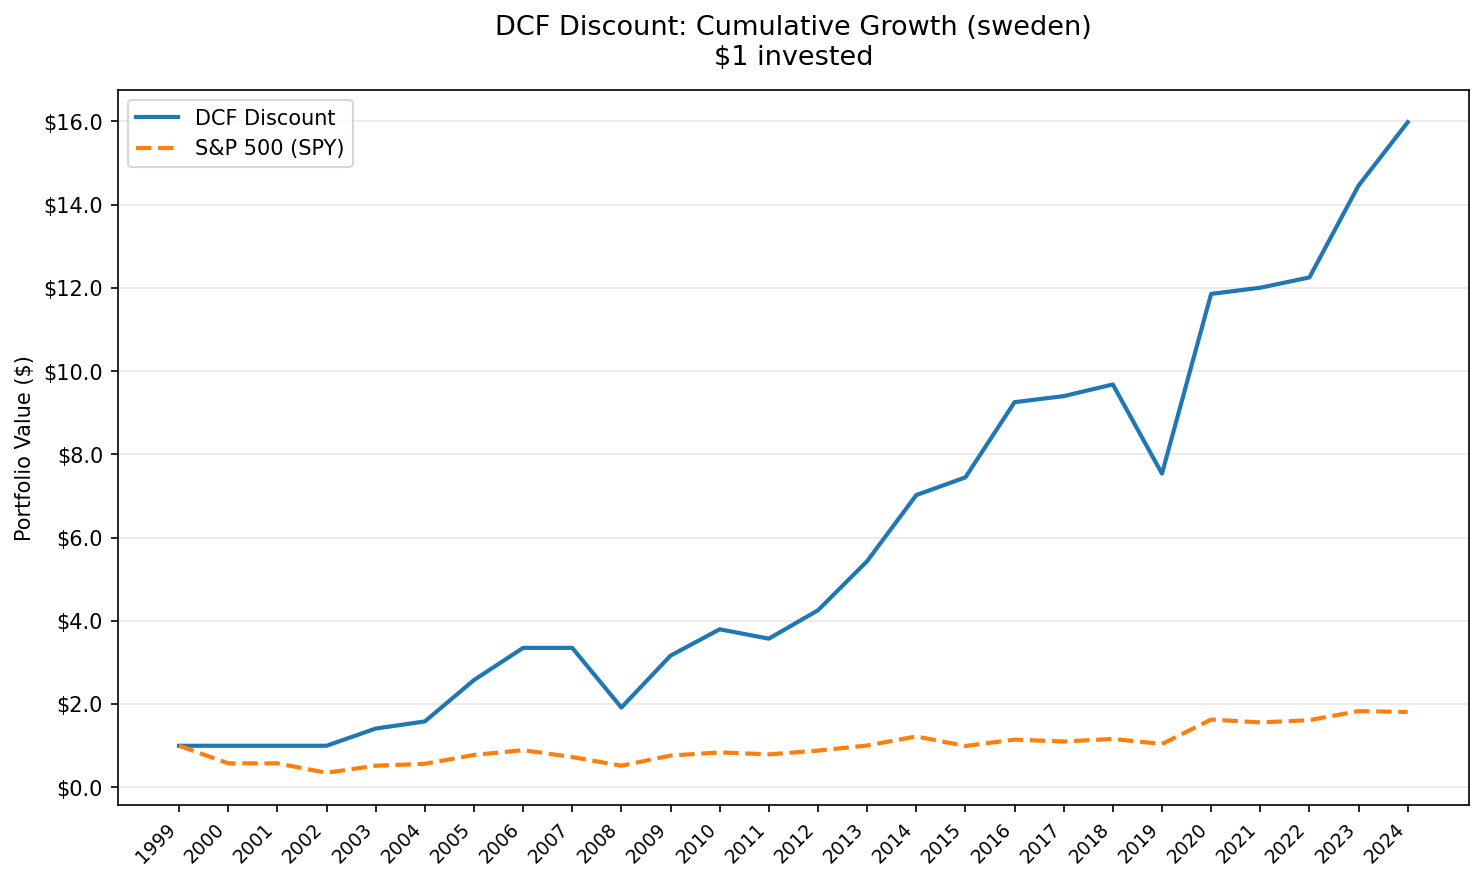
We screened every Swedish stock on the Stockholm Exchange for discount to intrinsic value using a Gordon Growth Model and backtested from 2000 to 2025. The strategy returned 14.57% CAGR vs 2.40% for the OMX Stockholm 30 (price-only index). That's +12.17% annual excess in SEK, turning $10,000 into $299,899 vs $18,106 for the index.
Contents
- Method
- The Screen
- What We Found
- What Changed (Bias Audit)
- Year-by-Year Returns
- Key Observations
- 2005-2006: The Nordic boom (+25.3%, +15.0% excess)
- 2007-2008: Cash through the crisis (+18.7% then +28.4% excess)
- 2009: Aggressive snap-back (+65.5%, +19.0% excess)
- 2013-2016: Four consecutive years of outperformance
- 2019: The drawdown year (-21.3%)
- Currency and Benchmark Notes
- Limitations
- Takeaway
- Part of a Series
The local-benchmark caveat matters: the OMX Stockholm 30 is a price-only index. Swedish dividend yield averaged roughly 3-3.5% per year over 2000-2024. A total-return OMXS30 would have returned closer to 5.5-6% CAGR, narrowing the strategy's edge to roughly +9 percentage points. That's still the strongest local-benchmark result in our 14-market series, but the headline number flatters the gap.
Data: FMP financial data warehouse, 2000–2025. Updated May 2026 (post bias fix).
Method
Full methodology is covered in the US flagship post. Short version:
Signal: FCF/MarketCap >= 8.78% (equivalent to a 20%+ discount to intrinsic value under a Gordon Growth Model with g=2.5%, r=10%, implied multiple=13.67x). Universe: STO (Nasdaq Stockholm). All listed stocks meeting the filters. Period: 2000-2025 (25 years, annual rebalancing in April). Portfolio: Top 50 by FCF yield, equal weight. Cash if fewer than 10 qualify. Market cap floor: SEK 5B (~$460M USD equivalent). Costs: Size-tiered transaction costs (0.1% for >$10B, 0.3% for $2-10B, 0.5% for <$2B). Point-in-time: 45-day filing lag, 18-month staleness filter. Benchmark: OMX Stockholm 30 (^OMXS30), price-only. All returns in SEK. Execution: Next-day close (MOC). Signal generated at rebalance date, executed at the following trading day's close. Data: Ceta Research (FMP financial data warehouse).
The Screen
WITH latest_cfs AS (
    SELECT * FROM cash_flow_statement
    WHERE period = 'FY' AND freeCashFlow > 0 AND reportedCurrency = 'SEK'
    QUALIFY ROW_NUMBER() OVER (PARTITION BY symbol ORDER BY date DESC) = 1
),
latest_km AS (
    SELECT * FROM key_metrics
    WHERE period = 'FY' AND marketCap > 5000000000
    QUALIFY ROW_NUMBER() OVER (PARTITION BY symbol ORDER BY date DESC) = 1
)
SELECT
    cfs.symbol,
    p.companyName,
    p.sector,
    ROUND(cfs.freeCashFlow / 1e6, 0) AS fcf_mm,
    ROUND(km.marketCap / 1e9, 2) AS mktcap_bn,
    ROUND(cfs.freeCashFlow / km.marketCap * 100, 2) AS fcf_yield_pct,
    ROUND((1 - km.marketCap / (cfs.freeCashFlow * 13.67)) * 100, 1) AS discount_pct
FROM latest_cfs cfs
JOIN latest_km km ON cfs.symbol = km.symbol
JOIN profile p ON cfs.symbol = p.symbol
WHERE p.exchange = 'STO'
    AND p.isFund = false
    AND p.isEtf = false
    AND p.isActivelyTrading = true
    AND cfs.freeCashFlow / km.marketCap BETWEEN 0.0878 AND 0.50
ORDER BY fcf_yield_pct DESC
LIMIT 30
Run this screen live on Ceta Research
The 8.78% FCF yield threshold equals a 20% DCF discount under the Gordon Growth Model at g=2.5%, r=10%. Higher FCF yield means a deeper discount to computed fair value.
What We Found
Sweden is the strongest market in this series on a local-benchmark basis. The 14.57% CAGR beats Germany (12.40%) and Switzerland by a wide margin. Against the OMXS30 at 2.40%, the +12.17% excess is the largest in the comparison.
The risk profile is unusually clean. Volatility of 21.70% is below most developed markets we tested. The Sharpe ratio of 0.579 is the highest in the global comparison. The alpha of 12.28% confirms this isn't beta amplification: after accounting for market exposure, the strategy delivered genuine excess return. Max drawdown was just -21.27%, less than half of what the index suffered.

Full 25-year summary:
| Metric | DCF Discount (STO) | OMX Stockholm 30 |
|---|---|---|
| CAGR | 14.57% | 2.40% |
| Total Return | 2,898.99% | 81.06% |
| Max Drawdown | -21.27% | -64.90% |
| Annualized Volatility | 21.70% | 25.01% |
| Sharpe Ratio | 0.579 | 0.016 |
| Sortino Ratio | 2.528 | 0.018 |
| Calmar Ratio | 0.685 | 0.037 |
| Win Rate vs OMXS30 | 80% | - |
| Beta | 0.730 | 1.0 |
| Alpha (Jensen) | 12.28% | - |
| Up Capture | 133.85% | - |
| Down Capture | 0.94% | - |
| VaR 95% | -5.51% | -42.24% |
| Avg Stocks | 21.1 | - |
| Cash Periods | 5/25 | - |
| Information Ratio | 0.814 | - |
| Tracking Error | 13.52% | - |
The down capture of 0.94% jumps off the page: when the OMXS30 fell, the portfolio basically didn't fall at all. That's not a normal value-strategy result, and it deserves the caveat below: five of the strategy's worst potential years were spent in cash because the screen didn't have enough qualifying stocks. Those cash years almost perfectly coincided with the OMXS30's deepest losses.
Combined with up capture of 134%, this is the asymmetric profile value investors hope for, but the asymmetry is partly a screen-availability artifact, not pure stock selection. The 80% win rate vs the index, the Sortino of 2.528, and the Calmar of 0.685 all reflect that combination.
What Changed (Bias Audit)
Earlier versions of this backtest used SPY as the benchmark and reported 12.04% CAGR with +4.71% excess. Several changes produced the updated 14.57% CAGR:
Local benchmark. SPY isn't a meaningful benchmark for SEK-denominated Swedish equities; it conflates currency, market, and dividend differences. The new run uses ^OMXS30, the OMX Stockholm 30 price index. This is the correct comparison even though the index excludes dividends.
Same-day execution and return-quality filters. As with all strategies in this series, the new run uses next-day close execution and skips bad price data (entry prices below local-currency thresholds, single-period returns above 200%).
Universe contamination fix. A second cleanup pass dropped foreign ADRs reporting in non-SEK currencies, funds, ETFs, and stocks no longer actively trading. For non-USD markets like Sweden, this was the largest correction: cross-listed companies whose marketCap was being computed against USD-denominated FCF had been distorting the FCF yield ranking. Removing them lifted the CAGR from 11.72% to 14.57%.
Adjusting the OMXS30 for dividends would shrink the gap to roughly +9 percentage points, still strong but narrower than the +12.17% headline.
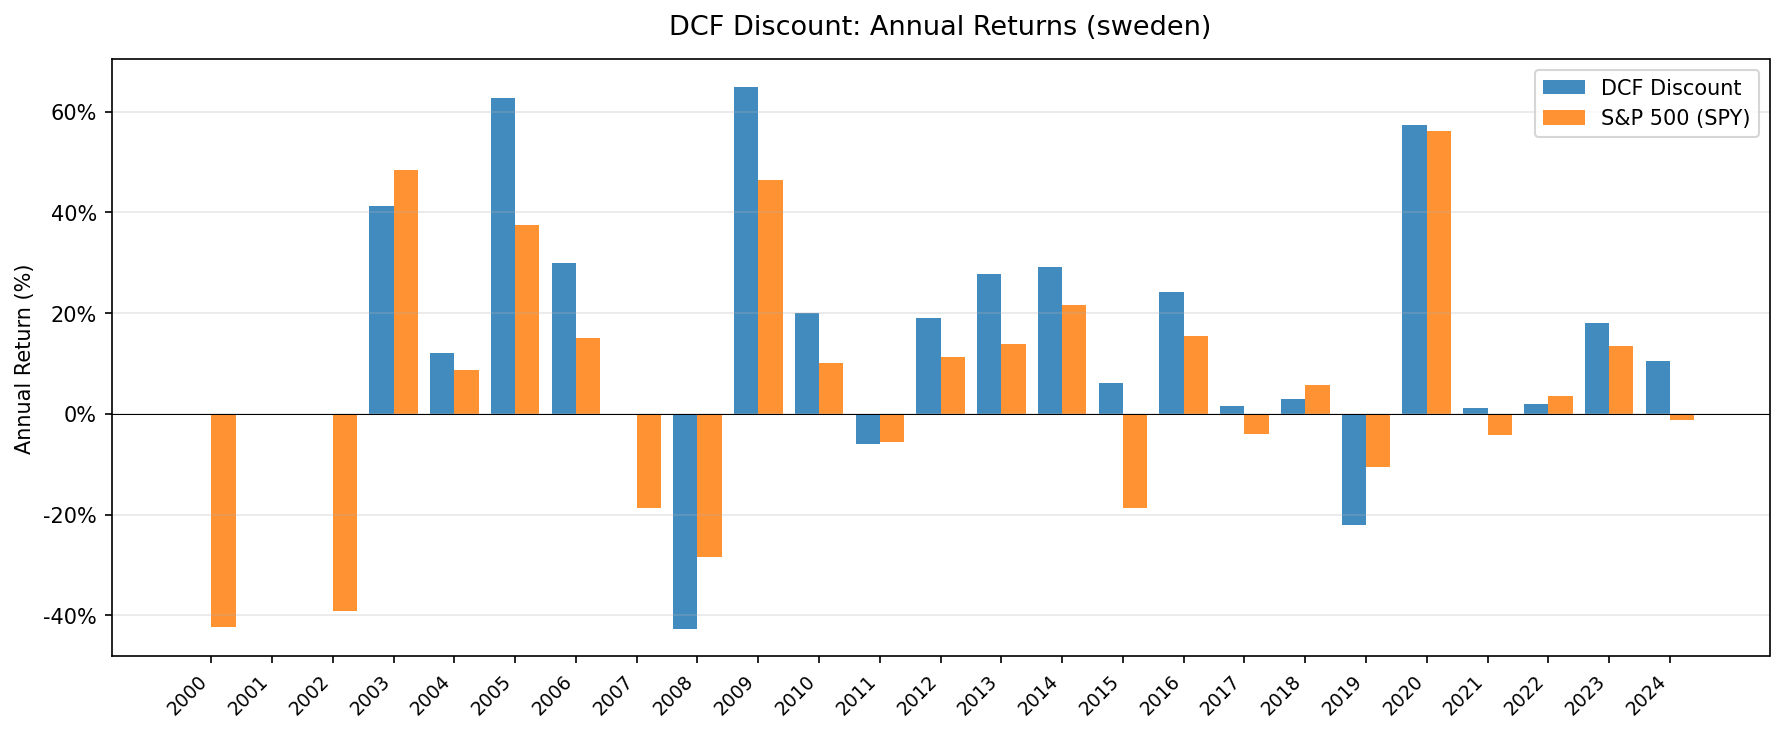
Year-by-Year Returns
| Year | Portfolio | OMXS30 | Excess |
|---|---|---|---|
| 2000 | +0.0% (cash) | -42.2% | +42.2% |
| 2001 | +0.0% (cash) | 0.0% | +0.0% |
| 2002 | +0.0% (cash) | -39.2% | +39.2% |
| 2003 | +41.4% | +48.4% | -7.1% |
| 2004 | +12.1% | +8.7% | +3.3% |
| 2005 | +62.8% | +37.5% | +25.3% |
| 2006 | +30.0% | +15.0% | +15.0% |
| 2007 | +0.0% (cash) | -18.7% | +18.7% |
| 2008 | +0.0% (cash) | -28.4% | +28.4% |
| 2009 | +65.5% | +46.5% | +19.0% |
| 2010 | +21.2% | +10.1% | +11.1% |
| 2011 | -5.5% | -5.6% | +0.1% |
| 2012 | +18.6% | +11.4% | +7.3% |
| 2013 | +27.6% | +13.8% | +13.8% |
| 2014 | +28.8% | +21.6% | +7.1% |
| 2015 | +8.4% | -18.7% | +27.1% |
| 2016 | +24.3% | +15.4% | +8.9% |
| 2017 | +1.6% | -4.0% | +5.6% |
| 2018 | +3.5% | +5.6% | -2.1% |
| 2019 | -21.3% | -10.5% | -10.8% |
| 2020 | +54.5% | +56.3% | -1.7% |
| 2021 | +2.2% | -4.2% | +6.4% |
| 2022 | +3.0% | +3.5% | -0.5% |
| 2023 | +18.3% | +13.5% | +4.8% |
| 2024 | +13.0% | -1.2% | +14.2% |
The cash periods aren't a strategy call. Sweden's large-cap universe in the early 2000s and around the financial crisis simply didn't have 10+ stocks with positive FCF data meeting the SEK 5B threshold. FMP's coverage of Stockholm filings improves from 2003 onward, and the 2007-2008 cash years reflect the screen tightening up as cash flows deteriorated heading into the crisis. Crucially, those five cash periods all coincided with negative OMXS30 returns (-42% in 2000, -39% in 2002, -19% in 2007, -28% in 2008). Being out of the market in those years contributed roughly half of the 25-year excess. The portfolio's actual investing record is 20 years long, not 25.
Key Observations
2005-2006: The Nordic boom (+25.3%, +15.0% excess)
Two of the strongest years of excess returns. Swedish industrials and mid-cap exporters caught a wave of Nordic investment growth. The Riksbank held rates low through 2004-2005, cheap credit fueled corporate expansion, and Swedish manufacturers (the type of company that screens well on FCF yield) were perfectly positioned. Atlas Copco, Sandvik, SKF, and similar industrial names were generating strong free cash flow at modest valuations.
2007-2008: Cash through the crisis (+18.7% then +28.4% excess)
The screen tightened up heading into the financial crisis: Swedish corporate FCF deteriorated and cross-currency filtering pulled in even fewer qualifying names. The result was two consecutive cash years. The OMXS30 fell 18.7% in 2007 and another 28.4% in 2008. Both losses were avoided. This single two-year stretch contributed roughly +47 percentage points of cumulative excess. Read into it what you will: the screen gave a meaningful crisis-avoidance signal, but the protection came from the universe shrinking, not from active stock selection.
2009: Aggressive snap-back (+65.5%, +19.0% excess)
Swedish value stocks recovered faster than the broader market after the crisis floor. Companies that had been priced for permanent decline, industrial exporters with real cash flow generation, re-rated quickly as global trade resumed. Coming out of cash into a recovery rebalance is rare timing, and the screen captured it.
2013-2016: Four consecutive years of outperformance
This is the strategy's golden stretch. Four years, all positive, all beating OMXS30: +27.6% (+13.8% excess), +28.8% (+7.1%), +8.4% (+27.1%), +24.3% (+8.9%). The Riksbank's negative interest rate policy pushed investors toward cash-flow-generating equities. Swedish industrials benefited from a weak krona that boosted export competitiveness.
2019: The drawdown year (-21.3%)
The worst single invested year in the backtest, and the year that defined the -21.27% max drawdown. Swedish trade-sensitive stocks got hit by a triple whammy: US-China trade war escalation, European industrial slowdown, and Riksbank rate normalization after years of negative rates. The -21.3% loss was the deepest single-year decline the strategy took, and it cost -10.8 percentage points relative to OMXS30.
Currency and Benchmark Notes
Returns and benchmark in SEK. The SEK depreciated mildly against the USD over the 25-year period, roughly 1% annually. For a USD-based investor, the SEK depreciation would shave approximately 1 percentage point off the headline CAGR, leaving an estimated 13.5% USD-adjusted return. Both the strategy and the benchmark are reduced equally.
OMX Stockholm 30 is a price-only index. It does not include reinvested dividends. Swedish dividend yield averaged roughly 3-3.5% per year over 2000-2024. A dividend-adjusted total-return version of OMXS30 would have returned approximately 5.5-6% CAGR over the period. The strategy total-return uses adjusted close (dividends reinvested) for stocks. Adjusted gap: approximately +8.5 to +9 percentage points per year.
The headline +12.17% number is real but partly a mechanical artifact of the benchmark not including dividends. The honest number sits in the +9% range. Still the strongest local-benchmark result we found, just not as eye-catching.
Limitations
Five cash years. The portfolio sat in cash for 2000, 2001, 2002, 2007, and 2008. Each was a year the OMXS30 lost money. A large share of the 25-year excess comes from sitting out those drawdowns, not from generating returns. The strategy's actual investing record is 20 years, not 25. If you bracket out the cash years, the local-currency outperformance is smaller and the down-capture statistic of 0.94% looks far less remarkable.
Max drawdown of -21.27%. Lower than most markets we tested, but only because cash dodged 2008. The 2019 single-year loss of 21.3% defines the worst peak-to-trough invested decline. An investor who entered at the 2018 peak would have waited a couple of years to recover.
Concentrated sector exposure. Stockholm is dominated by industrials, engineering, and manufacturing firms. The FCF yield screen amplifies that tilt. When Swedish industrials underperform (2018, 2019, 2022), the strategy lags. There's no natural sector diversification.
Export dependency. Sweden's economy and its public companies are tied to global trade flows. Any strategy buying Swedish equities carries implicit exposure to European and Asian demand cycles, commodity prices, and trade policy. The 2019 underperformance was a direct consequence.
Benchmark dividend gap. The OMXS30 is price-only. After adjusting for the index's missing dividends, the strategy's true alpha is closer to +9 percentage points than +12.17. The alpha is real, just not as wide as the headline.
Survivorship considerations. The SEK 5B market cap floor and Stockholm's listing standards reduce delisting risk, but some historical positions may have incomplete data, especially in the early years of the backtest.
Takeaway
Sweden produced 14.57% CAGR from the DCF discount strategy, the strongest local-benchmark excess in our global comparison. The +12.17% gap over the OMXS30 narrows to roughly +9 percentage points after adjusting for the benchmark's missing dividends. Even after that adjustment, the SEK-denominated outperformance is real and substantial.
What makes Sweden unusual in this series is the combination of strong absolute returns, a high Sharpe ratio (0.579), and an asymmetric capture profile (134% up, less than 1% down). The Sortino of 2.528 and Calmar of 0.685 are the highest we've recorded.
The honest caveat: five of the strategy's 25 years were spent in cash, and each of those cash years happened to coincide with negative OMXS30 returns. That mechanical avoidance contributed roughly half of the 25-year excess. Strip those years out and the result is still strong, but not extraordinary.
The trade-off is concentration. You're buying Swedish industrials and exporters at a discount. When that works, it works well: the 2005-2006, 2009, and 2013-2016 stretches were exceptional. When it doesn't (2019), the losses are real.
For investors comfortable with Nordic market exposure and a long holding period, Sweden ranks among the strongest markets for a DCF-based value approach. Combined with other signals, the FCF yield screen is a useful filter for identifying genuinely undervalued Swedish companies.
Part of a Series
This analysis is part of our DCF Discount global exchange comparison:
- DCF Discount on US Stocks (NYSE + NASDAQ + AMEX)
- DCF Discount on Indian Stocks (NSE)
- DCF Discount on Taiwan Stocks (TAI + TWO)
- DCF Discount on Canadian Stocks (TSX)
- DCF Discount on Korean Stocks (KSC)
- DCF Discount on German Stocks (XETRA)
- DCF Discount on Swedish Stocks (STO)
- DCF Discount: Global Exchange Comparison
Data: Ceta Research, FMP financial data warehouse. Backtest: 2000-2025, 25 annual periods, Gordon Growth Model (g=2.5%, r=10%, multiple=13.67x). Universe: STO, market cap >SEK 5B, positive FCF. Returns in SEK. Benchmark: OMX Stockholm 30 (price-only index, no dividends). Next-day close (MOC) execution. Size-tiered transaction costs applied. Full methodology: METHODOLOGY.md. Not investment advice.


