
Beat Streaks in Canada: +1.22% T+21 Over 25 Years on the TSX
Canadian beat streaks produce twice the abnormal return of US stocks. 5,684 events on the TSX from 2000-2025. T+21 CAR of +1.22% vs +0.55% for US. Update Aug 2026: CARs embed the CAD/USD move; the mirror leg now exists (miss streaks -1.46% at T+21 vs the TSX Composite).

Correction, August 2026. This study originally computed no inverse leg: we measured returns after streak-extending beats only, so the drift below had not been tested against its own mirror image. A second fix: an earlier version said these CARs are computed in Canadian dollars. They aren't. The benchmark is a USD-denominated ETF, so the CAD/USD move is inside every number here. The numbers themselves are unchanged. See Limitations. Update, 2026-08-29: the mirror leg, consecutive earnings misses, has now been run as a fresh paired study against the TSX Composite: Canadian beat streaks drift +2.06% at T+21 (t=+16.0, n=5,970) while consecutive-miss streaks drift -1.46% (t=-8.1, n=4,727). The drift knows the direction of the news; the signal passes the mirror test. Details in Limitations.ContentsMethodWhat We FoundStreak Length BreakdownThe SQL ScreenWhy It WorksLimitationsTakeaway
Canadian stocks with two or more consecutive earnings beats produce cumulative abnormal returns roughly twice the magnitude of US equivalents. We analyzed 5,684 streak events on the TSX from 2000 to 2025 and found T+21 drift of +1.22% and T+63 drift of +1.76%. Unlike the US, where 63-day drift has compressed significantly, the Canadian signal keeps building for three months.
Method
Universe: TSX-listed stocks with market cap above CAD 500M. We required at least two consecutive quarters of EPS beats. Data sourced from FMP's earnings surprises endpoint, 2000–2025.
Beat definition: epsActual > epsEstimated where ABS(epsEstimated) > 0.01. The floor on estimated EPS filters near-zero estimates.
Windows: CAR measured at T+1, T+21, and T+63 trading days after each streak-extending announcement.
Benchmark: EWC (iShares MSCI Canada ETF). CAR = stock return minus EWC return over each window.
Total events: 5,684
Data: FMP financial data warehouse, 2000–2025. Updated March 2026.
What We Found
The Canadian beat streak signal is stronger and more persistent than the US equivalent. The T+21 CAR of +1.22% is 2.2x the US result (+0.55%). More striking: the T+63 drift of +1.76% keeps building rather than compressing. In the US, 63-day drift has been arbitraged down to +0.31%. In Canada, it's nearly six times larger.
Two explanations for this gap. First, Canadian markets have lower institutional coverage. Fewer analysts follow TSX mid-caps, which means information travels more slowly and the post-announcement drift window stays open longer. Second, the TSX is more concentrated in resources and financials. These sectors have earnings that are more genuinely surprising and harder to predict than the technology-heavy US universe.
| Window | Mean CAR | t-stat | N |
|---|---|---|---|
| T+1 | +0.83% | 16.82 | 5,684 |
| T+21 | +1.22% | 10.15 | ~5,680 |
| T+63 | +1.76% | 8.57 | ~5,650 |
All three windows are statistically significant with t-stats well above conventional thresholds. The hit rate isn't shown here but is consistent with the US pattern at T+1 (just above 50%).
Streak Length Breakdown
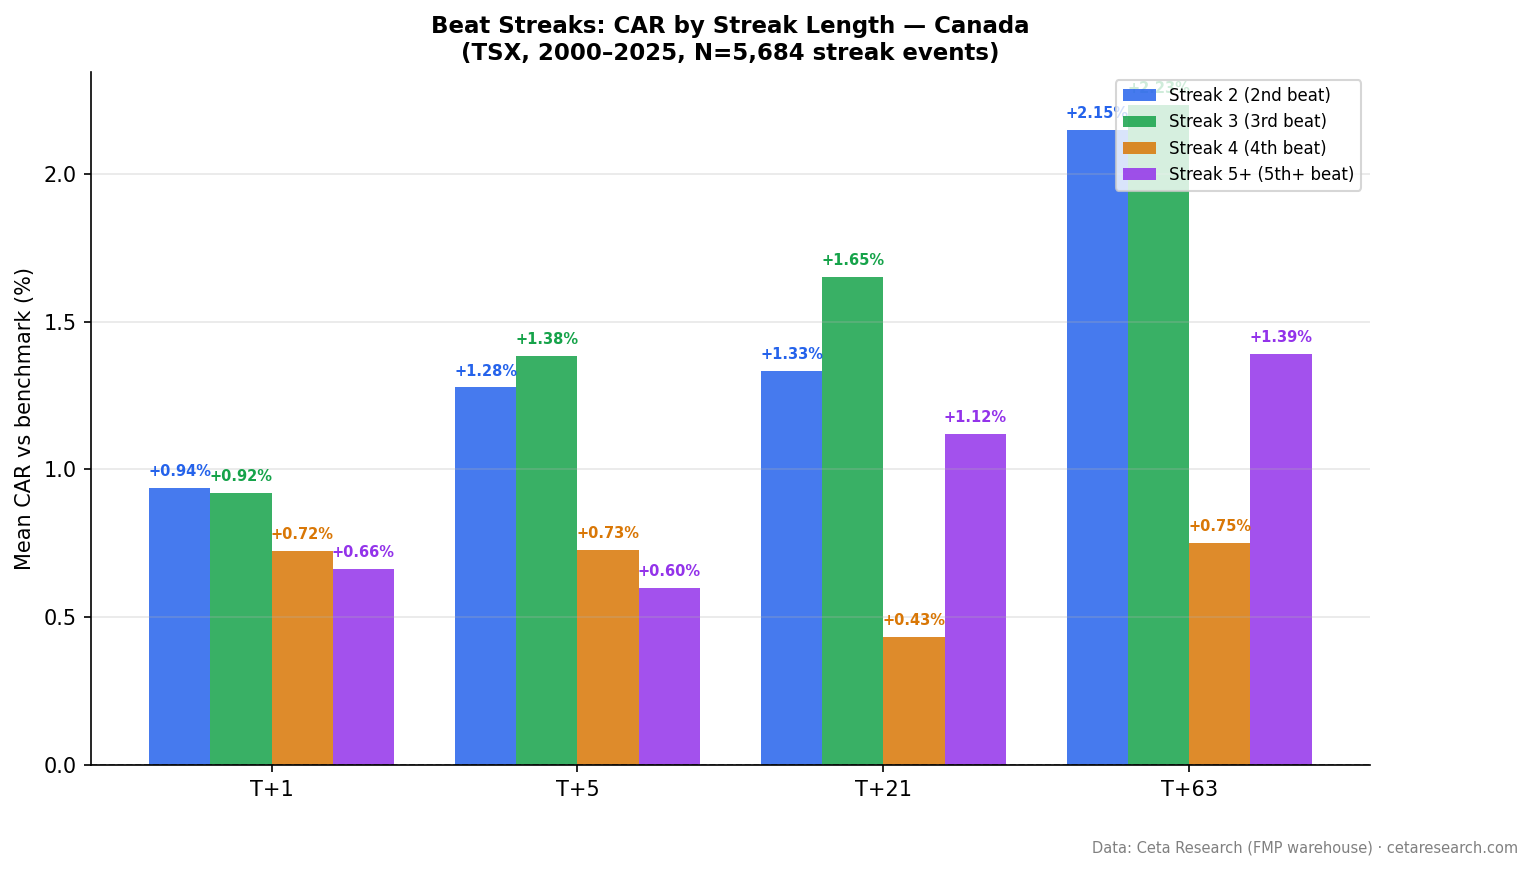
The streak pattern in Canada differs from the US in one important way: streak 3 outperforms streak 2 at both T+21 and T+63. That's unusual. In the US, streak 2 is the peak. In Canada, the third consecutive beat produces the strongest T+21 return (+1.65%) of any category.
| Streak | N | T+1 | T+21 | T+63 |
|---|---|---|---|---|
| Streak 2 | 2,137 | +0.94% | +1.33% | +2.15% |
| Streak 3 | 1,204 | +0.92% | +1.65% | +2.23% |
| Streak 4 | 717 | +0.72% | +0.43% | +0.75% |
| Streak 5+ | 1,599 | +0.67% | +1.12% | +1.39% |
Streak 4 shows a notable dip at T+21 (+0.43%), which then recovers strongly at streak 5+ (+1.12%). This non-monotonic pattern at streak 4 is worth investigating. One hypothesis: at streak 4, the market starts pricing in streak continuation more aggressively, temporarily suppressing the post-announcement drift. By streak 5+, that pricing effect has normalized.
The practical read: streak 2 and streak 3 are the strongest entry points for T+21 and T+63 holds. Streak 4 is the weakest. Streak 5+ recovers but at lower absolute levels.
The SQL Screen
This query finds TSX stocks currently on a beat streak of 3 or more quarters. The structure mirrors the US version but with a CAD 500M market cap floor (approximately USD 370M depending on exchange rate):
WITH ordered_earnings AS (
    SELECT symbol,
        CAST(date AS DATE) AS event_date,
        epsActual AS actual,
        epsEstimated AS estimated,
        CASE WHEN epsActual > epsEstimated THEN 1 ELSE 0 END AS is_beat,
        ROUND((epsActual - epsEstimated) / ABS(NULLIF(epsEstimated, 0)) * 100, 1) AS surprise_pct,
        ROW_NUMBER() OVER (PARTITION BY symbol ORDER BY date DESC) AS recency_rank
    FROM earnings_surprises
    WHERE epsEstimated IS NOT NULL
      AND ABS(epsEstimated) > 0.01
      AND epsActual IS NOT NULL
),
streak_calc AS (
    SELECT *, SUM(CASE WHEN is_beat = 0 THEN 1 ELSE 0 END)
        OVER (PARTITION BY symbol ORDER BY recency_rank
              ROWS UNBOUNDED PRECEDING) AS streak_breaker
    FROM ordered_earnings
),
streaks AS (
    SELECT symbol,
        COUNT(*) AS current_streak,
        ROUND(AVG(surprise_pct), 1) AS avg_surprise_pct,
        MIN(event_date) AS streak_start,
        MAX(event_date) AS latest_beat
    FROM streak_calc
    WHERE streak_breaker = 0 AND is_beat = 1
    GROUP BY symbol
    HAVING COUNT(*) >= 3
)
SELECT s.symbol, s.current_streak, s.avg_surprise_pct,
    s.streak_start, s.latest_beat,
    ROUND(k.mktCapUSD / 1e9, 1) AS mktcap_bn
FROM streaks s
JOIN key_metrics k ON s.symbol = k.symbol AND k.period = 'TTM'
WHERE k.mktCapUSD > 370000000  -- ~CAD 500M
QUALIFY ROW_NUMBER() OVER (PARTITION BY s.symbol ORDER BY k.date DESC) = 1
ORDER BY s.current_streak DESC, s.avg_surprise_pct DESC
LIMIT 30
FMP stores Canadian tickers with their TSX suffix (e.g., SHOP.TO, CNQ.TO). Filtering by exchange is possible if you add AND exchange = 'TSX' to the earnings_surprises subquery, though coverage varies by data vintage.
Run this screen live on Ceta Research → (pre-loaded query, no account required)
Why It Works
The academic literature on post-earnings announcement drift (PEAD) consistently finds stronger effects in markets with lower analyst coverage and less liquid stocks. Canada sits in a middle ground: it has professional institutional infrastructure but far fewer analysts per stock than US markets.
Loh and Warachka (2012) documented that streak information is under-priced across markets. Their findings were US-centric, but the mechanism generalizes: analysts don't fully update their forward estimates after each consecutive beat, leaving a predictable pattern in post-announcement returns. With fewer analysts per Canadian stock, the adjustment is slower and the drift window is longer.
Myers, Myers, and Skinner (2007) noted that earnings management to sustain streaks is common. Canadian companies have similar incentives to their US counterparts. The difference is that when genuine fundamental outperformance drives a streak, the market takes longer to recognize it in Canada than in the US.
The resource sector provides a structural explanation too. Mining and energy earnings are driven by commodity prices, which are genuinely hard to forecast. When a mining company beats consistently, it often reflects operational discipline that analysts systematically underestimate. That's a fundamentally different kind of streak than a software company guiding conservatively.
Limitations
Smaller sample: 5,684 events vs 73,386 in the US. Individual streak categories have a few hundred to ~2,000 events. The t-stats are strong, but subcategory results (especially streak 4 with 717 events) carry more uncertainty.
EWC as benchmark: EWC tracks large-cap Canadian stocks and is energy-heavy. If beat-streak stocks are concentrated in resources, EWC may partially capture their returns, understating true CAR. A sector-neutral benchmark would be more precise.
The miss-streak control was run 2026-08-29, after publication. A fresh paired run (same pipeline, event flipped to a second or later consecutive miss; exact ties, actual = estimate, break both streak types) against ^GSPTSE, the TSX Composite, rather than this post's EWC: beats +2.06% at T+21 (t=+16.0) and +3.04% at T+63; miss streaks -1.46% at T+21 (t=-8.1) and -1.66% at T+63 (t=-5.6). Opposite signs, both significant, so the Canadian drift is directional rather than a universe outrunning its benchmark. Because the paired run uses a local index, a different T+0 convention, and a broader TSX+TSXV universe, its beat-leg levels aren't comparable to the EWC numbers in the tables above; the direction verdict is the part that transfers. Event-level artifacts: beat-streaks/results/mirror-2026-08/ in the public repo.
Currency effects: An earlier version of this section said the CAR is computed in local currency. That isn't right. The stock leg is priced in CAD and EWC is a USD-denominated US-listed ETF, so the CAD/USD move over each window sits inside every CAR here. A CAD-denominated Canadian index would remove that component.
Domicile: 95.8% of these 5,684 events belong to Canada-domiciled companies, with US issuers at 3.3% the largest remaining block. The universe is selected by exchange code, which selects listings rather than companies. On the TSX that distinction barely matters.
Coverage gaps: FMP's Canadian coverage for older periods (pre-2010) is thinner. The 25-year result relies heavily on recent data where coverage is better.
Takeaway
Canadian beat streaks produce larger and more persistent drift than US equivalents. The T+21 result (+1.22%) is 2.2x the US figure, and the T+63 drift (+1.76%) hasn't compressed the way it has south of the border. The streak 3 category specifically outperforms streak 2 at T+21, which is unusual and suggests the market under-reacts to the third consecutive beat more than the second.
For investors screening TSX stocks, active beat streaks at streak 2 and streak 3 represent the highest-probability entry points based on this data. Streak 4 shows anomalous weakness that recovers at streak 5+, which complicates simple streak-length rankings.
The Canadian market's analyst coverage gap, resource sector concentration, and lower institutional arbitrage capacity all point toward this signal remaining more durable than the US equivalent. Whether that holds through the next decade depends on how quickly institutional coverage of TSX mid-caps improves.
Part of a series: Beat streaks analyzed across 16 exchanges. See US, Japan, Taiwan, India, Brazil, and the global comparison.
Data: FMP earnings surprises + key metrics, 2000–2025. TSX. Market cap > CAD 500M. 5,684 streak events. Benchmark: EWC, a USD-denominated US-listed ETF, so each CAR embeds the CAD/USD move. The miss-streak mirror leg was computed 2026-08-29 against ^GSPTSE and passes; see Limitations.
Past performance does not guarantee future results. This is educational content, not investment advice.

