
PEG Ratio in India: 12.1% CAGR Over 25 Years (+1.0%/yr vs Sensex)
PEG ratio on India's NSE: 12.12% CAGR over 25 years, +0.99%/yr vs the Sensex. The ride was violent, -67% in 2008, +116% in 2009. Here's the full data.

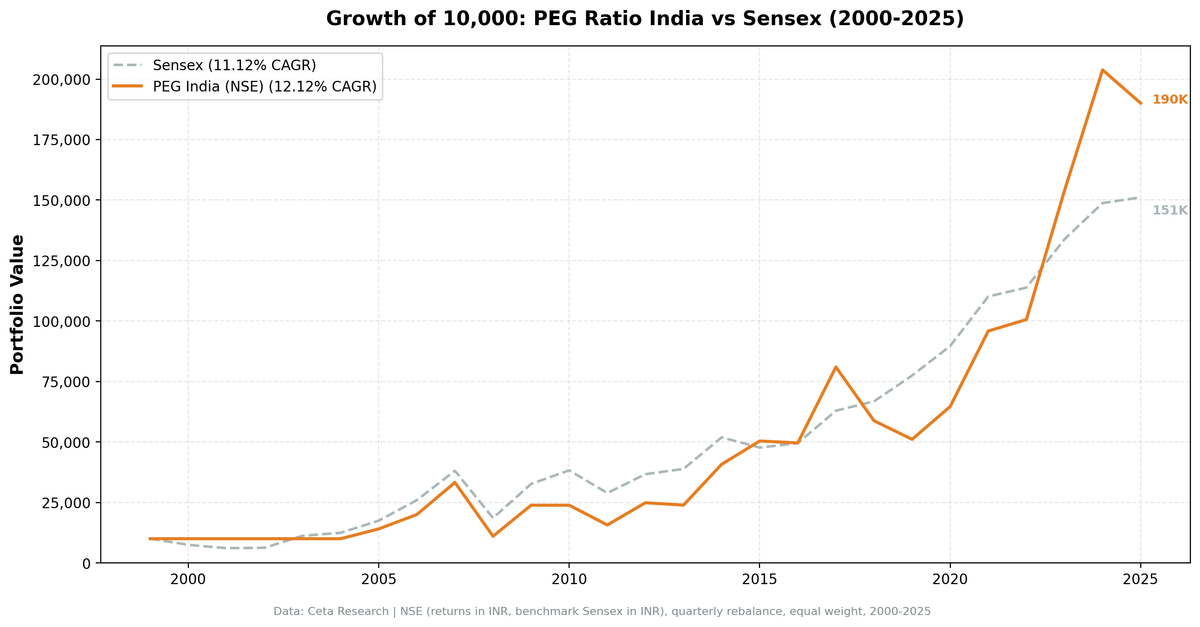
India delivered 12.12% CAGR for a PEG ratio strategy on the National Stock Exchange over 25 years. The Sensex returned 11.12% over the same period. That's a 0.99% annual advantage, measured in the same currency against India's primary benchmark.
Contents
- Why India?
- Methodology
- The Numbers
- What Drove the Returns
- The Cash Periods
- Run It Yourself
- Limitations
- Part of a Series
The ride was violent. India's market dropped 67% in 2008. The strategy bounced +116% in 2009. Five consecutive cash periods at the start (2000-2004) meant the portfolio missed the early Sensex runup.
Data: FMP financial data warehouse, 2000-2025. Updated May 2026.
Why India?
The PEG ratio screens for profitable companies growing faster than their price implies. India's mid-cap NSE landscape has provided this at scale: an expanding middle class, infrastructure build-out, financial sector growth, and IT services dominance gave Indian companies real structural growth. PEG < 1 within that context wasn't picking cheap cyclicals (the US problem). It was picking genuinely undervalued growers.
The Indian equity market also had less analyst coverage in the early 2000s, which created more pricing inefficiency. Large institutions were slower to arrive. The PEG screen captured that window.
Methodology
Universe: NSE (National Stock Exchange of India) Period: 2000-2025 (25.8 years, 103 quarterly periods) Portfolio: Top 30 by PEG ASC, equal weight. Cash if fewer than 10 qualify. Execution: Next-day close (market-on-close) Costs: Size-tiered transaction costs applied Point-in-time: 45-day lag on financial data Market cap filter: ₹20B+ (local currency, ≈ $240M USD) Benchmark: Sensex (^BSESN) Data: Ceta Research (FMP financial data warehouse)
Both portfolio and benchmark are INR-denominated. No currency mismatch.
Signal SQL:
SELECT f.symbol, p.companyName, p.exchange,
    ROUND(f.priceToEarningsGrowthRatioTTM, 3) AS peg_ratio,
    ROUND(f.priceToEarningsRatioTTM, 2) AS pe_ratio,
    ROUND(k.returnOnEquityTTM * 100, 1) AS roe_pct,
    ROUND(f.debtToEquityRatioTTM, 2) AS debt_to_equity,
    ROUND(k.marketCap / 1e9, 2) AS mktcap_b
FROM financial_ratios_ttm f
JOIN key_metrics_ttm k ON f.symbol = k.symbol
JOIN profile p ON f.symbol = p.symbol
WHERE f.priceToEarningsGrowthRatioTTM > 0
  AND f.priceToEarningsGrowthRatioTTM < 1.0
  AND f.priceToEarningsRatioTTM BETWEEN 8 AND 30
  AND k.returnOnEquityTTM > 0.12
  AND f.debtToEquityRatioTTM BETWEEN 0 AND 1.5
  AND k.marketCap > 20000000000
  AND p.exchange IN ('NSE')
QUALIFY ROW_NUMBER() OVER (PARTITION BY f.symbol
    ORDER BY f.priceToEarningsGrowthRatioTTM ASC) = 1
ORDER BY peg_ratio ASC
LIMIT 30
The Numbers
Summary metrics:
| Metric | PEG India (NSE) | Sensex |
|---|---|---|
| CAGR | 12.12% | 11.12% |
| Excess CAGR | +0.99% | -- |
| Sharpe Ratio | 0.186 | 0.194 |
| Sortino Ratio | 0.330 | -- |
| Max Drawdown | -69.07% | -51.34% |
| Annualized Volatility | 30.17% | 23.83% |
| Total Return | 1,800% | 1,411% |
| Beta vs Sensex | 0.949 | 1.0 |
| Down Capture | 92.3% | -- |
| Up Capture | 105.8% | -- |
Annual returns:
| Year | PEG India | Sensex | Excess |
|---|---|---|---|
| 2000 | 0.0% (cash) | -25.2% | +25.2% |
| 2001 | 0.0% (cash) | -18.7% | +18.7% |
| 2002 | 0.0% (cash) | +2.9% | -2.9% |
| 2003 | 0.0% (cash) | +79.1% | -79.1% |
| 2004 | 0.0% (cash) | +10.8% | -10.8% |
| 2005 | +40.5% | +40.6% | -0.1% |
| 2006 | +42.3% | +48.5% | -6.2% |
| 2007 | +66.3% | +46.8% | +19.5% |
| 2008 | -66.9% | -51.3% | -15.5% |
| 2009 | +116.4% | +76.3% | +40.1% |
| 2010 | -0.0% | +17.1% | -17.1% |
| 2011 | -34.3% | -24.5% | -9.7% |
| 2012 | +58.7% | +27.0% | +31.7% |
| 2013 | -4.0% | +6.0% | -9.9% |
| 2014 | +70.5% | +33.5% | +37.0% |
| 2015 | +23.7% | -8.1% | +31.8% |
| 2016 | -1.6% | +3.8% | -5.4% |
| 2017 | +63.3% | +27.1% | +36.1% |
| 2018 | -27.4% | +6.1% | -33.6% |
| 2019 | -13.1% | +16.0% | -29.1% |
| 2020 | +26.6% | +15.7% | +10.8% |
| 2021 | +48.3% | +22.8% | +25.4% |
| 2022 | +4.9% | +3.4% | +1.6% |
| 2023 | +53.0% | +17.5% | +35.4% |
| 2024 | +32.5% | +11.2% | +21.3% |
| 2025 | -6.7% | +1.6% | -8.3% |
What Drove the Returns
The India growth story (2007-2009): 2007 was the first big year: +66.3% vs Sensex +46.8%. The Sensex had nearly doubled from 2003 to 2007, and our NSE PEG screen was finding companies at the heart of that growth. The 2008 crash hit hard (-66.9% vs -51.3%). Recovery in 2009: +116.4% vs Sensex +76.3%, the largest single-year excess return in the backtest.
Modi election (2014): India elected Narendra Modi in May 2014 on a pro-growth platform. The portfolio returned +70.5% vs the Sensex's +33.5%. Infrastructure stocks, banks, and consumer companies all moved. This was the highest single-year absolute return outside the 2009 bounce.
COVID recovery and the 2017/2021 surges: 2017: +63.3% vs Sensex +27.1%. 2021: +48.3% vs Sensex +22.8%. The COVID recovery in 2020 (+26.6% vs +15.7%) led into a strong 2021.
The 2018-2019 drag: Two consecutive years of double-digit losses (-27.4%, -13.1%) while the Sensex returned +6.1% and +16.0%. The NBFC credit crisis and slow corporate earnings growth hit mid-cap NSE names harder than the large-cap Sensex basket. 2018 was the worst relative year: -33.6% excess.
The Cash Periods
From 2000 through 2004, the portfolio held cash. Five full years. There weren't enough NSE large-caps (MCap > ₹20B) with positive PEG data to form a portfolio of 10 stocks in those years. This is real data, not a model artifact: the NSE was smaller and less covered in the early 2000s.
The five cash years include 2003 when the Sensex returned +79.1%, the biggest missed return in the backtest. This is a real cost of the quality/liquidity filters in an emerging market.
21 out of 103 periods (20.4%) were cash periods.
Run It Yourself
# Live screen (current India NSE stocks)
python3 peg-ratio/screen.py --preset india

# Historical backtest (India only)
python3 peg-ratio/backtest.py --preset india --output results/india.json --verbose
Limitations
Modest alpha. +0.99%/yr excess vs Sensex is real but not dramatic. The Sharpe ratios are nearly identical (0.186 vs 0.194). The strategy doesn't clearly beat the Sensex on risk-adjusted terms. The value add is stock selection alpha during specific periods (2007, 2009, 2012, 2014, 2017, 2021, 2023, 2024), not consistent outperformance.
Extreme volatility. 30.17% annualized volatility. The max drawdown of -69.07% is severe. Three years had losses of 25%+ (-27.4% in 2018, -34.3% in 2011, -66.9% in 2008). The down capture of 92.3% vs Sensex means the portfolio falls slightly less than the index during downturns, but the absolute drawdowns are still large.
Cash periods cost. 21 of 103 periods (20.4%) in cash, concentrated in 2000-2004. The strategy missed the Sensex's +79.1% in 2003. These aren't fixable, they reflect the real data availability constraints of the NSE in the early 2000s.
Beta below 1. At 0.949, the portfolio tracks the Sensex closely. The up capture (105.8%) slightly outpaces the down capture (92.3%), which is where the modest alpha comes from.
Point-in-time data limitations. FMP data for India before 2005 is thinner than post-2010. The early annual returns carry higher data uncertainty.
Part of a Series
- PEG Ratio in the US → (flagship, full methodology)
- PEG Ratio in Japan → (+3.07%/yr vs Nikkei 225)
- PEG Ratio in South Africa → (low beta, downside protection)
- PEG Ratio in Canada → (+4.59%/yr vs TSX, zero cash periods)
- PEG Ratio in Sweden → (best Sharpe vs local index, 0.437)
- 19-Exchange Comparison →
Data: Ceta Research (FMP financial data warehouse), NSE, 2000-2025. Returns in INR. Benchmark: Sensex. Execution: next-day close. Full methodology: METHODOLOGY.md
Past performance does not guarantee future results. This is educational content, not investment advice.


