quantitative-research
Revenue Market Share Gainers in the US: A 25-Year Backtest
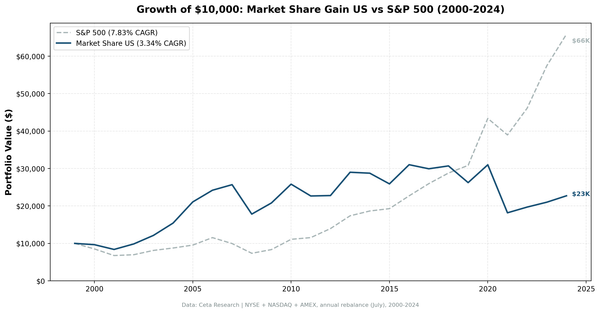
Revenue market-share gainers returned 3.3% annually vs the S&P 500's 7.8%. The signal worked in 2000-2009. Then it broke. Here's why.

quantitative-research
Revenue market-share gainers returned 3.3% annually vs the S&P 500's 7.8%. The signal worked in 2000-2009. Then it broke. Here's why.
r&d
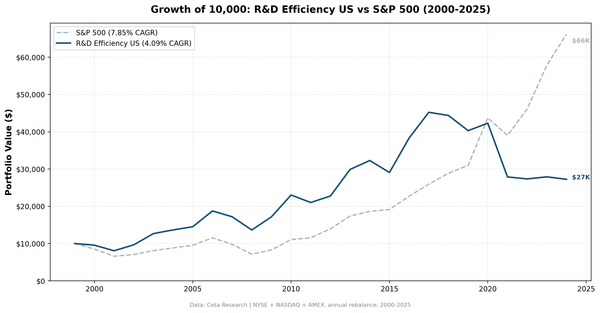
From 2000 to 2012, buying stocks with the highest gross profit per R&D dollar beat the S&P 500 consistently. Then mega-cap tech took over, and the strategy spent the next twelve years giving money back. 4.09% CAGR against 7.85% for SPY. 25-year backtest, full data, SQL included.
uk stocks
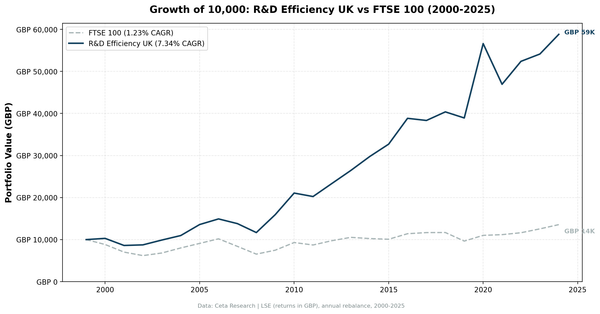
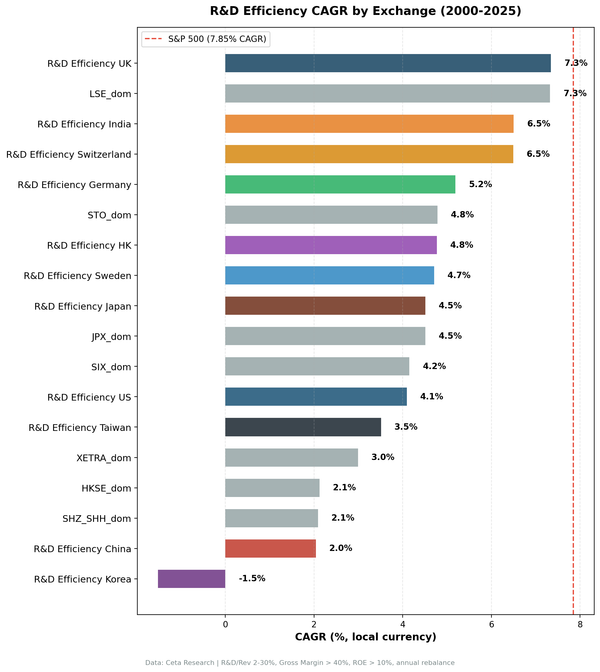
The UK R&D efficiency screen returned 7.34% CAGR over 25 years. The FTSE 100 price index returned 1.23%. That is +6.12% annual excess, the strongest result across 11 global markets, with a max drawdown of -21.74% against the index's -38.07%. Returns in GBP. The FTSE 100 is price-return only.
india stocks
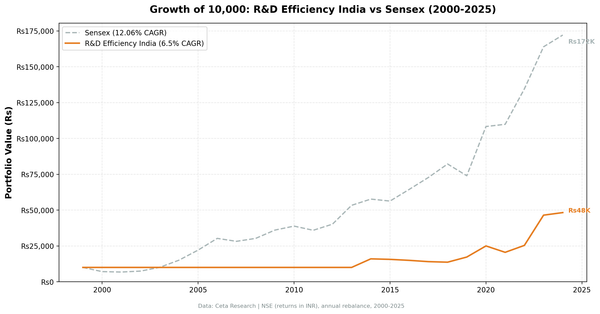
The R&D efficiency screen on NSE-only sits in cash for 56% of years. When invested it was volatile, with two spectacular years (2014 +59.81% against a Sensex up 8.14%, and 2023 +83.18% against 21.83%). The 25-year CAGR of 6.50% trails the Sensex's 12.06%. It doesn't beat the Indian market.
global stocks
We reran the R&D efficiency screen across 11 exchanges with local benchmarks. The UK beats the FTSE 100 price index by +6.12% annually, the strongest result globally. India underperforms the Sensex by 5.27pp. And two positive results turn out to rest on foreign companies' secondary listings.
small cap
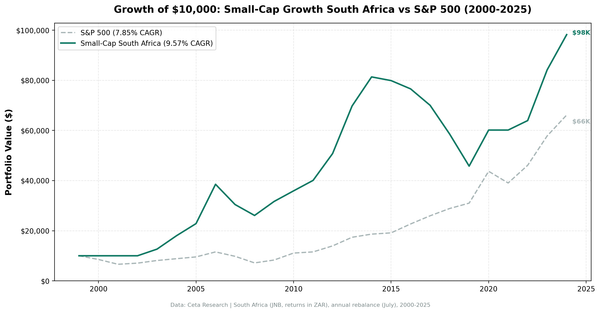
South African small-cap growth returned 9.57% CAGR over 25 years, the second-highest absolute return in our study. The excess was earned before 2010 and gave way to five straight losing years.
small cap
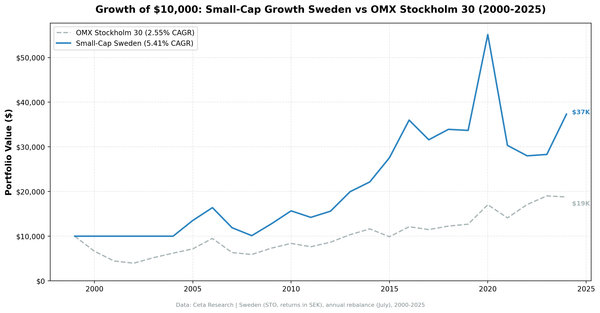
Sweden's small-cap growth screen returned 5.41% CAGR against an OMX Stockholm 30 that did 2.55%. Then 2021 gave back 27.7 points of relative performance in a single year.
small cap
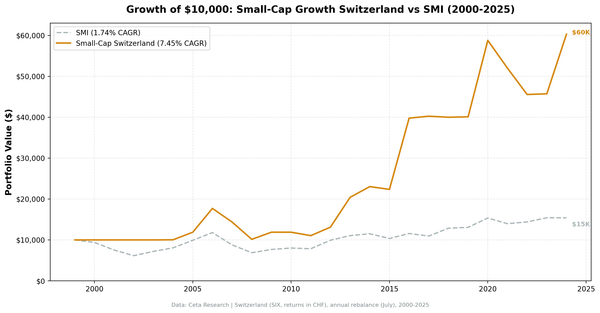
Switzerland's small-cap growth screen returned 7.45% CAGR against an SMI that did 1.74%, the best up-down capture in our study. It averaged 11.4 holdings and two years supplied most of the excess.
small cap
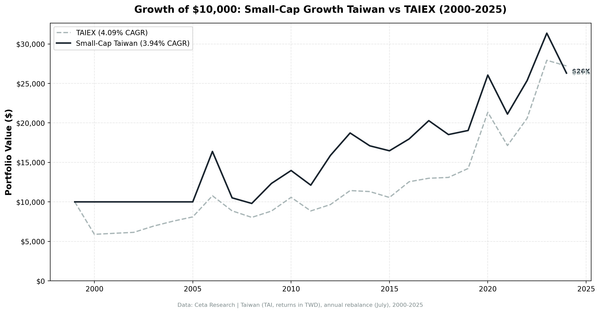
Taiwan's small-cap growth screen returned 3.94% CAGR against a TAIEX that did 4.09%. With 95% up capture and 90% down capture, it tracked the index instead of beating it.
small cap
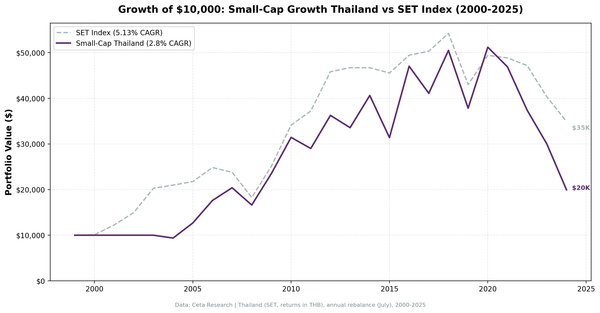
Thailand's small-cap growth screen returned 2.80% CAGR against a SET Index that did 5.13%, with 134% down capture and a -61% drawdown. Emerging market status is not a guarantee.
small cap
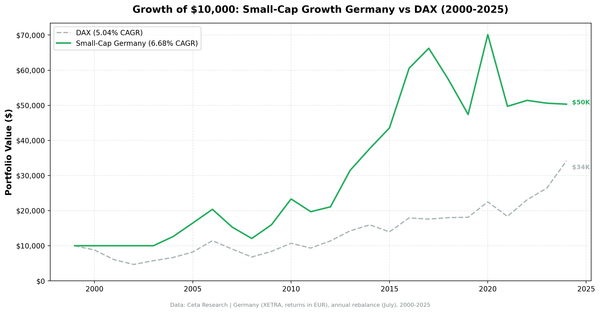
German small-cap growth returned 6.68% CAGR against a DAX that did 5.04%, with 42% down capture. Every point of the edge was earned before 2018.
small cap
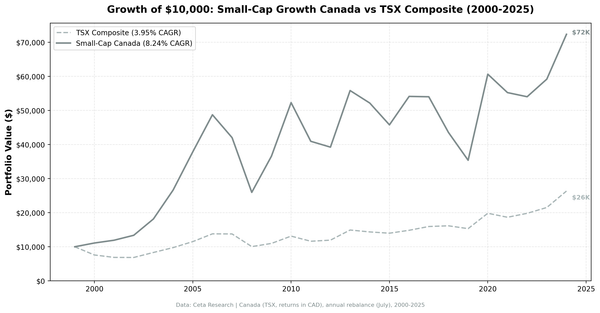
Canadian small-cap growth returned 8.24% CAGR over 25 years against a TSX Composite that did 3.95%. $10,000 became $72,383. Almost all of the edge was banked before 2010.