
Small-Cap Growth Switzerland: +5.71%/yr Over the SMI, From 11 Stocks
Switzerland's small-cap growth screen returned 7.45% CAGR against an SMI that did 1.74%, the best up-down capture in our study. It averaged 11.4 holdings and two years supplied most of the excess.

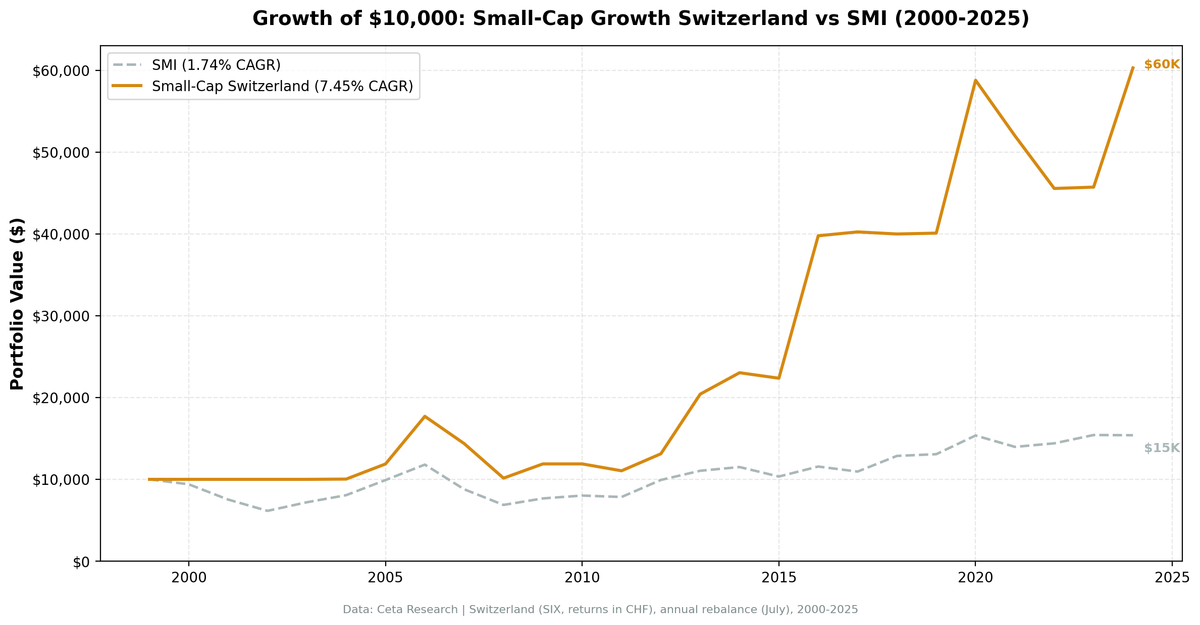
Switzerland's small-cap growth screen returned 7.45% CAGR over 25 years. The SMI returned 1.74%. The strategy beat its home market by +5.71% per year, the second-largest local excess in our 14-market study.
Contents
- Executive Summary
- The Method
- What We Found
- The asymmetry is genuine
- Two years carry the record
- The win rate is a coin flip
- Annual Returns
- Limitations
- Run It Yourself
- Takeaway
- References
The SMI's 1.74% CAGR is the context that makes that possible. Swiss large-caps went almost nowhere for a quarter century. Against that backdrop the strategy delivered a Sharpe of 0.278 and a Sortino of 0.855, both far above the index's 0.085 and 0.131.
It also did it while holding an average of 11.4 stocks, the thinnest portfolio of any market we tested. That number should shape how you read everything below.
Data: FMP financial data warehouse, 2000-2025. Updated August 2026.
Executive Summary
| Metric | Switzerland (SIX) | SMI Benchmark |
|---|---|---|
| CAGR | 7.45% | 1.74% |
| Excess Return | +5.71%/yr | |
| Sharpe Ratio | 0.278 | 0.085 |
| Sortino Ratio | 0.855 | 0.131 |
| Max Drawdown | -42.69% | -41.74% |
| Win Rate | 52% (13 of 25) | |
| $10,000 becomes | $60,279 | $15,395 |
| Up Capture | 151% | |
| Down Capture | 31% | |
| Average holdings | 11.4 |
The Method
We screened the SIX Swiss Exchange annually each July, with a 45-day filing lag and entry at the next-day close. The filter:
- Market cap between CHF 25M and CHF 1B
- Revenue growth >15% year-over-year (fiscal year)
- Positive net income
- Debt-to-equity <2.0
Top 30 by revenue growth, equal weight, annual rebalance.
Switzerland is a small exchange, and the screen rarely filled. The average portfolio held 11.4 stocks against a 30-stock target. Five years held no positions at all: 2000, 2001, 2002, 2003 and 2010. This is a structural constraint of the market, not a flaw in the screen, but it means the results are driven by a handful of companies in most years.
Full methodology: METHODOLOGY.md
For the US flagship results, see our US small-cap growth backtest.
What We Found
The asymmetry is genuine
151% up capture against 31% down capture is the best combination in the study. When the SMI fell, the portfolio fell less than a third as much. In the 10 years the SMI was negative, it averaged -11.84% while the portfolio averaged -3.67%.
Swiss corporate culture explains part of this. A small-cap Swiss company that clears a growth filter while staying profitable and carrying less than 2.0 debt-to-equity is usually a conservatively financed business rather than a speculative one. When markets fall, those companies don't implode.
The maximum drawdown tells the same story from the other side: -42.69% against the SMI's -41.74%. An 11-stock portfolio of small companies had essentially the same worst-case loss as the Swiss blue-chip index.
Two years carry the record
The strategy's excess return is concentrated to an uncomfortable degree. 2016 returned +77.87% against the SMI's +11.83%, a 66 point excess. 2013 returned +55.56% against +11.31%, a 44 point excess. No other year comes within 15 points of either.
In a portfolio averaging 11.4 holdings, a year like 2016 means two or three companies had exceptional runs. That's a real outcome, not a data artifact, but it isn't something a systematic screen can be expected to repeat. Strip 2013 and 2016 and the strategy still beats the SMI, by a much narrower margin.
The win rate is a coin flip
52% means the strategy beat the SMI in 13 of 25 years. The wins were large (2016 +66.0%, 2013 +44.3%, 2024 +32.0%, 2006 +30.0%) and the losses were mostly modest. That's the skewed distribution you'd expect from a concentrated quality-growth portfolio, and it's why the Sortino ratio (0.855) flatters the strategy more than the Sharpe (0.278) does.
The recent record is weaker: 2 wins in the last 7 years, though the average excess over that stretch is still positive at +2.4 points because 2020 and 2024 were both large.
Annual Returns
| Year | Switzerland | SMI | Excess |
|---|---|---|---|
| 2000 | 0.00% | -6.08% | +6.08% |
| 2001 | 0.00% | -19.85% | +19.85% |
| 2002 | 0.00% | -18.32% | +18.32% |
| 2003 | 0.00% | +17.06% | -17.06% |
| 2004 | +0.31% | +12.07% | -11.76% |
| 2005 | +18.43% | +22.87% | -4.44% |
| 2006 | +49.01% | +19.06% | +29.95% |
| 2007 | -18.83% | -25.55% | +6.72% |
| 2008 | -29.39% | -21.75% | -7.64% |
| 2009 | +17.16% | +11.56% | +5.60% |
| 2010 | 0.00% | +4.54% | -4.54% |
| 2011 | -7.07% | -2.18% | -4.89% |
| 2012 | +18.81% | +26.57% | -7.76% |
| 2013 | +55.56% | +11.31% | +44.25% |
| 2014 | +12.81% | +4.12% | +8.69% |
| 2015 | -2.92% | -10.10% | +7.18% |
| 2016 | +77.87% | +11.83% | +66.04% |
| 2017 | +1.19% | -5.33% | +6.52% |
| 2018 | -0.63% | +17.48% | -18.12% |
| 2019 | +0.26% | +1.66% | -1.41% |
| 2020 | +46.60% | +17.45% | +29.15% |
| 2021 | -11.55% | -9.05% | -2.50% |
| 2022 | -12.38% | +3.10% | -15.48% |
| 2023 | +0.36% | +7.06% | -6.70% |
| 2024 | +31.87% | -0.16% | +32.02% |
Return years run July to July, matching the rebalance date. The 0.00% rows are cash years where the universe couldn't produce 10 qualifying companies. Best year: 2016 (+77.87%). Worst year: 2008 (-29.39%). Worst excess: 2018 (-18.12%).
Limitations
Universe concentration is the main caveat. 11.4 average holdings is genuinely thin, and five cash years mean the strategy couldn't always deploy at all. The 2016 result almost certainly reflects a handful of companies. Attributing that to systematic alpha rather than to a small sample is not something the data supports.
Listed, not Swiss. The universe is every company listed on the SIX, and Swiss exchanges carry a substantial number of foreign secondary listings. Restricting the screen to companies actually domiciled in Switzerland cuts the excess from +5.71% to +4.15% and adds one more cash year. The premium survives that test, but roughly a quarter of the headline came from foreign lines.
Currency. Returns are in Swiss francs. The franc appreciated against most major currencies over this period, which flatters CHF-denominated returns for a foreign investor and does nothing for a Swiss one. The comparison against the SMI is currency-matched and is the honest one.
Data completeness. SIX is a smaller exchange with fewer companies reporting in formats compatible with FMP's pipeline. Universe gaps are likely, and they interact badly with a screen that already struggles to fill.
Recent underperformance. 2021, 2022 and 2023 were three consecutive years of negative excess. 2024's +32.0 point excess pulled the recent average back up. Whether that's a recovery or a single good year isn't determinable from one observation.
Fund contamination. Excluding closed-end funds and ETFs from the universe moves the Swiss result by -0.09pp of CAGR, so this isn't a factor here. It is a large factor in the US. See the US post.
Run It Yourself
Full backtest code is in our public repository: ceta-research/backtests.
The Swiss screen uses CHF-denominated market cap bounds. The key constraint is the exchange filter, WHERE exchange = 'SIX' on the profile table. Revenue growth is computed from income_statement, and the leverage filter uses debtToEquityRatio from financial_ratios.
Takeaway
Switzerland's small-cap growth screen beat the SMI by +5.71% a year over 25 years, with 31% down capture and the best Sortino ratio in the study. As a local strategy against a local benchmark, it worked.
Two things temper that. The SMI compounded at 1.74% a year, so the bar was low, and the absolute return of 7.45% is respectable rather than remarkable. And the portfolio averaged 11.4 stocks with two years supplying most of the excess, which makes this a concentrated bet dressed up as a systematic strategy.
For an investor who specifically wants Swiss small-cap exposure and would otherwise hold the SMI, the screen has a case. For anyone treating it as a repeatable factor premium, the sample is thinner than the 25-year label suggests.
References
- Banz, R. (1981). "The Relationship Between Return and Market Value of Common Stocks." Journal of Financial Economics, 9(1), 3-18.
- Fama, E. & French, K. (1992). "The Cross-Section of Expected Stock Returns." Journal of Finance, 47(2), 427-465.
- Fama, E. & French, K. (1993). "Common Risk Factors in the Returns on Stocks and Bonds." Journal of Financial Economics, 33(1), 3-56.
- Van Dijk, M. (2011). "Is size dead? A review of the size effect in equity returns." Journal of Banking & Finance, 35(12), 3263-3274.
Data: Ceta Research (FMP financial data warehouse), 2000-2025. Full methodology: METHODOLOGY.md. Past performance does not guarantee future results. This is educational content, not investment advice.

