
Small-Cap Growth in Germany: +1.64%/yr Over the DAX
German small-cap growth returned 6.68% CAGR against a DAX that did 5.04%, with 42% down capture. Every point of the edge was earned before 2018.

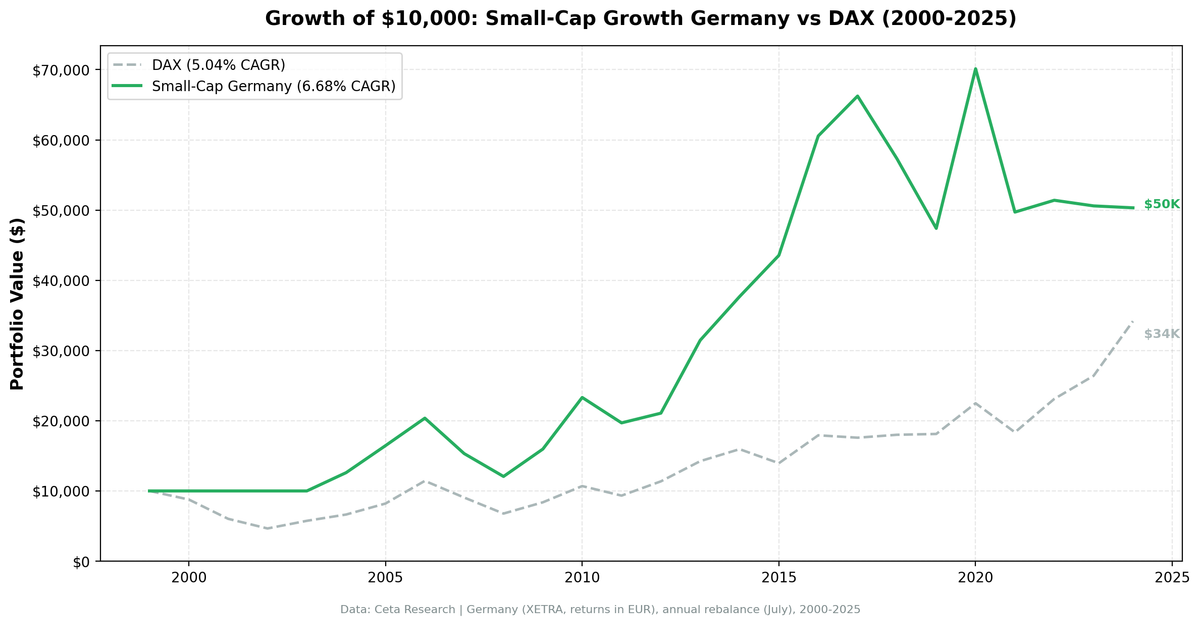
CAGR: 6.68% | Excess: +1.64%/yr vs DAX | Sharpe: 0.201 | Max Drawdown: -40.77% | Win Rate: 56%
Contents
- The Method
- What We Found
- Annual Returns
- The 2004-2017 Case, and Why It Ended
- Limitations
- Run It Yourself
- Takeaway
- References
Germany's small-cap growth screen returned 6.68% CAGR over 25 years against a DAX that managed 5.04%. $10,000 became $50,338. The DAX turned it into $34,186.
That's a real local premium, and it comes with the right risk shape: 87% up capture against 42% down capture, and a maximum drawdown of -40.77% against the DAX's -53.43%. The strategy took less of the market's pain and most of its gain.
The problem is when the premium was earned. Every point of it came before 2018. The last seven years produced five negative absolute returns and an average excess of -12.7 percentage points a year against the DAX.
Data: FMP financial data warehouse, 2000-2025. Updated August 2026.
The Method
We screened XETRA-listed stocks each July for:
- Market cap between €25M and €1B
- Revenue growth >15% year-over-year (most recent fiscal year)
- Positive net income
- Debt/equity ratio below 2.0
Top 30 by revenue growth, equal-weight, rebalanced annually in July with a 45-day filing lag, entering at the next-day close. The portfolio had four cash years (2000-2003) when the qualifying universe was too thin, and averaged 18.8 holdings when invested. Active years: 21 (2004-2024).
What We Found
The asymmetry is the strongest part of the result. 42% down capture against the DAX means the portfolio lost less than half as much when German equities fell. 87% up capture means it kept most of the gains. That combination produced a Jensen's alpha of +2.42%/yr on a beta of 0.74, and a Sharpe of 0.201 against the DAX's 0.144.
56% win rate, but the distribution is lopsided in time. The strategy beat the DAX in 14 of 25 years. Thirteen of those wins came before 2018. From 2018 onward it won once, in 2020.
Four cash years (2000-2003). The XETRA universe couldn't produce enough qualifying small-cap growth companies during the dot-com bust. Those years score as positive excess in 2000-2002, when the DAX fell 12%, 31% and 23%, and as a large negative in 2003 when the DAX rebounded 23%. Read the early rows with that in mind: the strategy wasn't picking stocks, it was sitting out.
The post-2017 collapse. 2018 (-13.46%), 2019 (-17.32%), 2021 (-29.11%), 2023 (-1.56%) and 2024 (-0.54%) were all negative in absolute terms. Against a DAX that rose 29.47% in 2024, the strategy's -0.54% is a 30-point miss, the worst excess year in the sample.
Annual Returns
| Year | Strategy | DAX | Excess vs DAX |
|---|---|---|---|
| 2000 | 0.00% | -12.21% | +12.21% |
| 2001 | 0.00% | -31.32% | +31.32% |
| 2002 | 0.00% | -22.76% | +22.76% |
| 2003 | 0.00% | +23.38% | -23.38% |
| 2004 | +26.10% | +15.62% | +10.48% |
| 2005 | +30.49% | +23.56% | +6.93% |
| 2006 | +23.77% | +39.31% | -15.54% |
| 2007 | -24.78% | -20.77% | -4.01% |
| 2008 | -21.26% | -25.17% | +3.91% |
| 2009 | +32.35% | +23.64% | +8.71% |
| 2010 | +46.04% | +27.58% | +18.46% |
| 2011 | -15.53% | -12.72% | -2.81% |
| 2012 | +7.02% | +21.78% | -14.76% |
| 2013 | +49.27% | +25.29% | +23.98% |
| 2014 | +19.76% | +11.99% | +7.78% |
| 2015 | +15.60% | -12.53% | +28.12% |
| 2016 | +39.03% | +28.49% | +10.54% |
| 2017 | +9.39% | -1.90% | +11.29% |
| 2018 | -13.46% | +2.36% | -15.81% |
| 2019 | -17.32% | +0.65% | -17.97% |
| 2020 | +47.96% | +24.12% | +23.84% |
| 2021 | -29.11% | -18.38% | -10.72% |
| 2022 | +3.39% | +25.89% | -22.50% |
| 2023 | -1.56% | +14.26% | -15.82% |
| 2024 | -0.54% | +29.47% | -30.02% |
Return years run July to July, matching the rebalance date. Best year: 2013 (+49.27%). Worst year: 2021 (-29.11%). Best excess against the DAX: 2001 (+31.32%, a cash year). Worst: 2024 (-30.02%).
The 2004-2017 Case, and Why It Ended
The first fourteen active years look like a working strategy: 2004 (+26.10%), 2005 (+30.49%), 2010 (+46.04%), 2013 (+49.27%), 2016 (+39.03%). Ten of those fourteen beat the DAX.
Germany's post-reunification economy found its footing in the mid-2000s. The Hartz labour reforms reduced structural unemployment and made German manufacturing more competitive. Small industrial companies growing revenues above 15% in that environment were genuine growth stories tied to German export strength, with improving margins and cheap financing.
Those conditions haven't returned. Since 2018 the German export machine has faced a China slowdown, an energy cost shock following the loss of Russian gas, and a structural transition away from combustion-engine automotive production. Small manufacturers can't pass through input cost increases the way large integrated companies can, and revenue growth above 15% doesn't insulate against margin collapse. The screen kept selecting cyclical industrial suppliers into a cycle that had turned.
Germany's manufacturing economy creates the wrong small-cap composition for this signal. XETRA companies growing revenues above 15% are often mid-tier industrial suppliers benefiting from a demand spike. That's cyclical revenue, not durable growth, and the profitability screen only catches part of it. Unlike Canada, where small-cap growth is tied to commodity cycles that can deliver outsized returns, German small-cap growth is tied to European industrial cycles that have been structurally weaker than US growth since 2010.
Limitations
The +1.64% excess is measured against the DAX, in euros. Against a dollar-denominated global index the picture is worse: 6.68% in euros over 25 years is a modest absolute return for the drawdown involved.
The universe is listings, not German companies. XETRA carries a large number of foreign secondary listings. Restricting the screen to companies actually domiciled in Germany cuts the excess from +1.64% to +0.68%, with the same number of invested periods. The premium survives that test but shrinks by more than half, so treat the headline as an upper bound.
The -40.77% maximum drawdown is among the deeper ones in our 14-market study, though shallower than the DAX's own -53.43%. Four cash years (2000-2003) reduce the effective sample to 21 years.
The XETRA universe has specific liquidity characteristics. Small German companies in the €25M-€200M range can have limited trading volume and wide spreads. The backtest applies size-tiered transaction costs but doesn't model market impact.
FMP restates and backfills financial history. The identical code run in March 2026 produced 4.79% CAGR and a -0.25% deficit against the DAX. This run produces 6.68% and +1.64%, purely from data revisions. That's a sign flip driven by the vendor, not by the method, and it's a reason to treat any single decimal place here with suspicion.
Run It Yourself
The full screen definition and SQL are in our US flagship post. The Germany version applies the same screen to XETRA with €25M-€1B market cap bounds.
Query the underlying data at Ceta Research.
Takeaway
German small-cap growth beat the DAX by 1.64 percentage points a year over 25 years, with less than half the downside participation and a shallower drawdown than the index. On the numbers, that's a working local strategy.
On the timing, it's a strategy whose case rests entirely on 2004-2017. The last seven years delivered five negative absolute returns while the DAX compounded, and the 2024 gap of 30 percentage points is the worst single year in the sample. Nothing in the data says the earlier period was luck, and nothing says the recent period is temporary.
If you're allocating to German equities and your alternative is the DAX, this screen has a defensible history and a better risk profile. Just don't buy it on the 25-year average without looking at which decade produced it.
References
- Banz, R. (1981). "The Relationship Between Return and Market Value of Common Stocks." Journal of Financial Economics, 9(1), 3-18.
- Fama, E. & French, K. (1992). "The Cross-Section of Expected Stock Returns." Journal of Finance, 47(2), 427-465.
- Fama, E. & French, K. (1993). "Common Risk Factors in the Returns on Stocks and Bonds." Journal of Financial Economics, 33(1), 3-56.
- Van Dijk, M. (2011). "Is size dead? A review of the size effect in equity returns." Journal of Banking & Finance, 35(12), 3263-3274.
Data: Ceta Research (FMP financial data warehouse), 2000-2025. Full methodology: METHODOLOGY.md. Past performance does not guarantee future results. This is educational content, not investment advice.

