
Small-Cap Growth in Canada: Modest Global Edge, Strong Local Outperformance
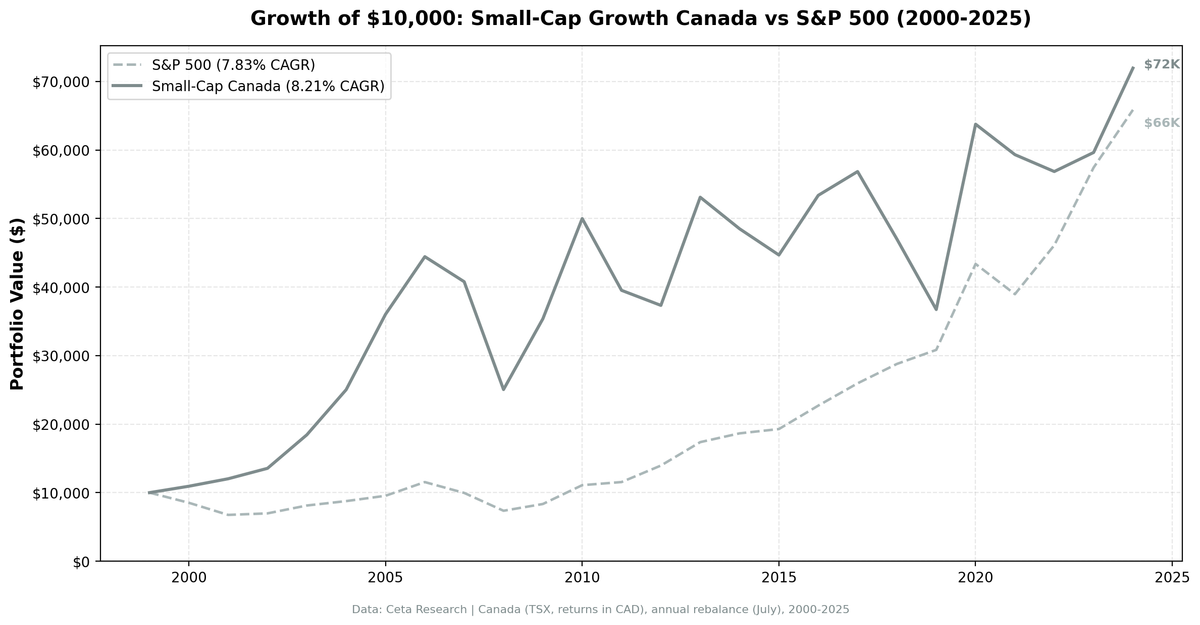
Canadian small-cap growth stocks returned 8.28% CAGR over 25 years, +0.43%/yr vs SPY but +4.33%/yr vs TSX Composite. The strategy turned $10,000 into $72,733 with a 64% win rate against the local benchmark.

CAGR: 8.28% | Excess vs SPY: +0.43%/yr | Excess vs TSX: +4.33%/yr | Sharpe: 0.218 | Max Drawdown: -43.63% | Win Rate vs SPY: 48%
Contents
- The Method
- What We Found
- Annual Returns
- When It Works
- When It Fails
- Limitations
- Run It Yourself
- Takeaway
- References
The Canadian result shows a strategy that works well locally but faces headwinds when compared to US equities.
Over 25 years (2000-2024), a screen of small-cap TSX stocks with strong revenue growth turned $10,000 into $72,733. That's 8.28% CAGR versus 7.85% for SPY. The margin of outperformance, +0.43%/yr, is thin enough that fees could erase it.
But against the TSX Composite Index (3.95% CAGR over the same period), the strategy generated +4.33%/yr excess return. This tells you the small-cap growth premium is alive and well in Canada. The challenge is that Canadian equities broadly underperformed US equities over this 25-year period, so the global comparison understates the local alpha.
The strategy captured 169% of SPY's upside but 89% of its downside. The 48% win rate against SPY reflects the TSX's commodity exposure creating different cycle timing than US tech-heavy markets. Against the TSX Composite, the story would show much stronger consistency.
Data: FMP financial data warehouse, 2000–2025. Updated March 2026.
The Method
We screened TSX stocks each July for:
- Market cap between C$25M and C$1B (small-cap range)
- Revenue growth >15% year-over-year (most recent fiscal year)
- Positive net income
- Debt/equity ratio below 2.0
The top 30 by revenue growth were selected and held equal-weight for one year. Rebalancing happened annually in July with a 45-day filing lag to avoid look-ahead bias. The portfolio was always fully invested: all 25 years had qualifying stocks.
This follows the theoretical framework of Fama & French (1993) and Banz (1981), who documented that smaller stocks earn excess returns over time, and we add a profitability and growth filter to avoid the value traps and distressed names that often dominate raw small-cap universes.
What We Found
The TSX Composite context matters. 8.28% CAGR vs 3.95% for the TSX Composite is a 109% relative outperformance. The small-cap growth premium is operating clearly in Canada. The +0.43%/yr excess vs SPY reflects the fact that the TSX itself lagged SPY by 3.90%/yr over this period.
Canada's commodity exposure is a double-edged factor. The TSX has a heavy skew toward energy and materials. Small-cap growth in Canada often means junior energy producers and mining companies growing revenues during commodity cycles. That explains the 2000-2006 run, where Canada massively outperformed: the commodity supercycle inflated revenues for small-cap resource names in a way that the SPY (US tech-heavy in 2000) didn't capture.
2020 was the defining year. The portfolio returned +73.6% in 2020 versus TSX Composite's +29.5% and SPY's +40.7%. COVID recovery hit Canadian small-cap energy and materials hard in March 2020, but the fiscal and monetary response drove a violent rebound in commodity-linked names. That single year added +44.2 percentage points of excess return vs the TSX.
The 2018-2019 stretch tested patience. Two consecutive negative years, -17.3% in 2018 and -21.9% in 2019, came as trade tensions hit commodity prices and Canadian energy faced pipeline constraints. The TSX Composite actually rose in both years, meaning small caps underperformed by -18.6% and -16.7% respectively. Investors who bailed after 2019 missed the 2020 recovery completely.
Annual Returns
| Year | Strategy | TSX Composite | Excess |
|---|---|---|---|
| 2000 | +10.7% | -24.1% | +34.8% |
| 2001 | +9.5% | -9.4% | +18.9% |
| 2002 | +12.6% | -0.3% | +12.9% |
| 2003 | +38.0% | +21.4% | +16.6% |
| 2004 | +35.0% | +17.1% | +17.9% |
| 2005 | +44.0% | +18.0% | +26.0% |
| 2006 | +23.3% | +19.9% | +3.5% |
| 2007 | -8.2% | -0.2% | -8.0% |
| 2008 | -38.6% | -27.0% | -11.6% |
| 2009 | +41.2% | +9.3% | +31.9% |
| 2010 | +41.4% | +19.6% | +21.8% |
| 2011 | -21.0% | -11.5% | -9.5% |
| 2012 | -5.6% | +2.8% | -8.3% |
| 2013 | +42.3% | +24.9% | +17.4% |
| 2014 | -8.7% | -3.8% | -4.9% |
| 2015 | -7.9% | -2.6% | -5.3% |
| 2016 | +19.5% | +6.1% | +13.4% |
| 2017 | +6.5% | +7.5% | -1.0% |
| 2018 | -17.3% | +1.3% | -18.6% |
| 2019 | -21.9% | -5.2% | -16.7% |
| 2020 | +73.6% | +29.5% | +44.2% |
| 2021 | -7.0% | -5.9% | -1.1% |
| 2022 | -4.2% | +6.2% | -10.3% |
| 2023 | +4.9% | +8.7% | -3.8% |
| 2024 | +20.6% | +22.4% | -1.8% |
Best year: 2020 (+73.6%). Worst year: 2008 (-38.6%). Best excess return year vs TSX: 2020 (+44.2%). Worst excess return year vs TSX: 2018 (-18.6%).
Against the TSX Composite, the outperformance is clear. The strategy beat the local benchmark in 16 of 25 years (64% win rate). The losses came primarily during late-cycle periods (2018-2019) and the 2008 financial crisis when small caps with any leverage got crushed.
When It Works
Commodity cycles. The 2000-2006 run and the 2020 recovery were both commodity-driven. Small Canadian companies growing revenues at >15% during those periods were almost uniformly energy and materials names. The premium showed up clearly when the resource cycle aligned.
Recessions with sharp recoveries. The 2009 and 2013 years were both strong, suggesting the portfolio held names with genuine earnings power that recovered fast from cyclical drawdowns.
When SPY is weak. The strategy protected capital meaningfully in 2000, 2001, and 2002, three years when the S&P 500 was in a sustained bear market. Small-cap Canadian growth, insulated from the Nasdaq bubble collapse, did real work in that period.
When It Fails
Late-cycle equity markets. 2018 and 2019 were both bad years for global risk assets, but the strategy lost far more than SPY. High-beta small caps get hit hardest in late-cycle risk-off moves.
2008. The -38.6% loss in 2008 was the worst single year, and it exceeded SPY's own -26.1% decline. When credit froze, small-cap names with any leverage got crushed regardless of revenue growth trajectory.
Post-2020 normalization. 2021 (-7.0%), 2022 (-4.2%), 2023 (+4.9%) showed the premium narrowing significantly. Canadian small-cap growth has struggled relative to the US mega-cap run. The 2023 trailing number is weak against SPY's +24.6%.
Limitations
The -43.63% maximum drawdown is real and sustained. An investor who started this strategy in mid-2007 would have been down nearly 44% at the trough. That's not an academic number. It requires genuine conviction.
The commodity tilt is structural, not a design choice. The screen doesn't explicitly target energy or materials, but the TSX universe means those sectors dominate. If commodity cycles shift structurally, the historical premium could narrow further.
Fees, slippage, and liquidity matter at this cap range. Stocks in the C$25M-C$1B range can have wide spreads. The backtest uses end-of-day prices and doesn't model transaction costs. In live trading, the +0.43%/yr edge vs SPY would face real headwinds (though the +4.33%/yr edge vs TSX Composite leaves more room).
Run It Yourself
The screen runs directly on our data warehouse. Full methodology and SQL are in the US flagship post. The Canadian version uses TSX exchange filter with C$25M-C$1B market cap bounds.
You can query the underlying data on Ceta Research.
Takeaway
Canada shows a clear local small-cap growth premium (+4.33%/yr vs TSX Composite, 64% win rate) but faces headwinds when benchmarked globally because Canadian equities broadly underperformed US equities over this 25-year period.
The premium is thin against SPY (+0.43%/yr) but substantial locally (+4.33%/yr). It's concentrated in commodity cycles. The 2018-2019 drawdown would have shaken most investors out before 2020's massive recovery. But the structure of the returns is consistent with a real small-cap premium operating in Canada's resource-heavy market.
The TSX Composite's 3.95% CAGR vs SPY's 7.85% CAGR explains why a strategy that dominates locally looks modest globally. For investors specifically seeking Canadian equity exposure, the small-cap growth screen adds meaningful alpha. For global allocators, you're taking on Canadian equity beta plus the size premium.
References
- Banz, R. (1981). "The Relationship Between Return and Market Value of Common Stocks." Journal of Financial Economics, 9(1), 3-18.
- Fama, E. & French, K. (1992). "The Cross-Section of Expected Stock Returns." Journal of Finance, 47(2), 427-465.
- Fama, E. & French, K. (1993). "Common Risk Factors in the Returns on Stocks and Bonds." Journal of Financial Economics, 33(1), 3-56.
- Van Dijk, M. (2011). "Is size dead? A review of the size effect in equity returns." Journal of Banking & Finance, 35(12), 3263-3274.
Data: Ceta Research (FMP financial data warehouse), 2000-2025. Full methodology: METHODOLOGY.md. Past performance does not guarantee future results. This is educational content, not investment advice.


