
Small-Cap Growth Sweden: Beating the Local Benchmark (+4.01%/yr)
We ran a small-cap growth screen on the Stockholm Stock Exchange from 2000 to 2025. The result: 6.56% CAGR vs OMX Stockholm 30's 2.55%, with +4.01%/yr local excess despite a -45.5% drawdown in 2021.

Sweden's small-cap growth universe is large enough to run this screen, sophisticated enough that you'd expect some mispricings, and developed enough that the data is clean. After 25 years of backtesting (2000-2025), the strategy returned 6.56% CAGR vs the OMX Stockholm 30's 2.55%, a gap of +4.01% per year. That's genuine local alpha.
Contents
- Executive Summary
- The Method
- What We Found
- The weak benchmark makes the alpha real
- 2021: the year that broke it
- The good years
- The bad years
- Annual Returns
- When It Works and When It Fails
- Limitations
- Run It Yourself
- Takeaway
- References
The OMX Stockholm 30's 2.55% CAGR is weak for a developed market index. Large-cap Swedish stocks barely grew for two decades. Against that backdrop, small-cap growth delivered real outperformance. The risk profile — particularly a -45.5% drawdown in 2021 — is the tradeoff.
Executive Summary
| Metric | Sweden (STO) | OMX Stockholm 30 |
|---|---|---|
| CAGR | 6.56% | 2.55% |
| Excess Return | +4.01%/yr | — |
| Sharpe Ratio | 0.208 | 0.027 |
| Sortino Ratio | 0.377 | 0.040 |
| Max Drawdown | -47.24% | -60.54% |
| Win Rate | 60% | — |
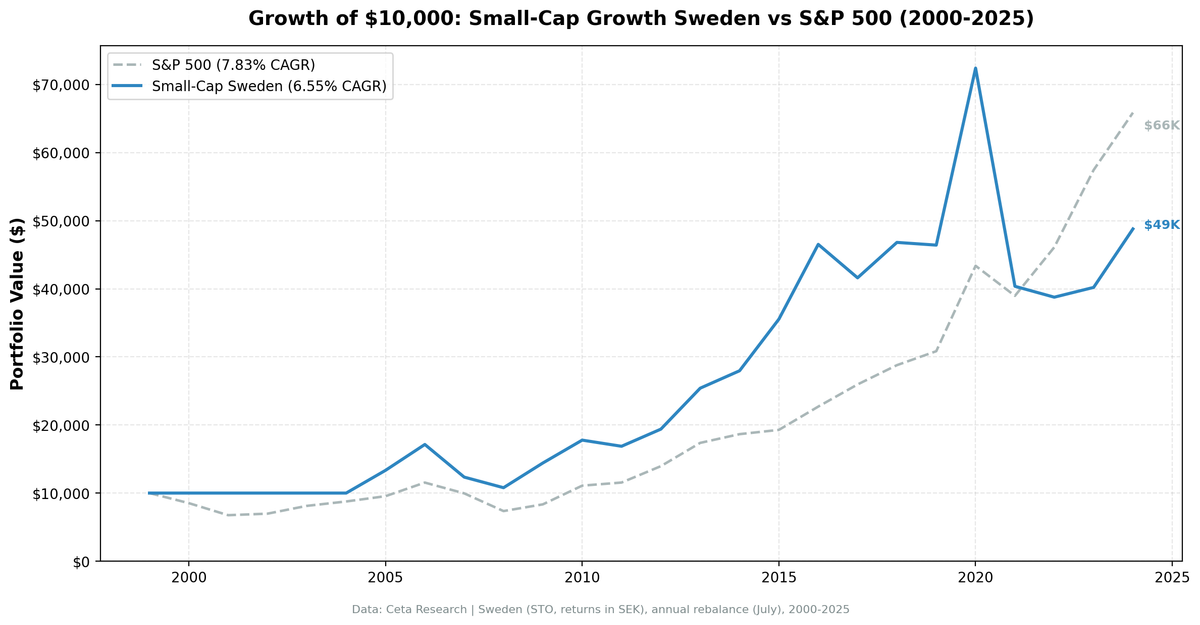
| $10K → | $49,006 | — |
| Up Capture | 98% | — |
| Down Capture | 31% | — |
$10,000 invested in 2000 grew to $49,006 by end of 2024. The same in the OMX would have grown to just $18,785. The win rate of 60% means the strategy beat the benchmark in 15 of 25 years. The down capture of 31% is the key: when the OMX fell, the small-cap growth portfolio fell only 31% as much.
The Method
We screened the Stockholm Stock Exchange annually each July (with a 45-day filing lag to avoid lookahead bias). The filter:
- Market cap between SEK 250M and SEK 10B (small-cap bounds for Sweden)
- Revenue growth >15% year-over-year (fiscal year)
- Positive net income
- Debt-to-equity <2.0
The top 30 stocks by revenue growth passed into an equal-weight portfolio. Rebalancing happens once per year.
Five years (2000-2004) returned 0% because no stocks passed the screen — the dot-com bust killed revenue growth across the board. The strategy held cash during that period.
Full methodology: METHODOLOGY.md
For the US flagship results, see our US small-cap growth backtest.
What We Found
The weak benchmark makes the alpha real
The OMX Stockholm 30's 2.55% CAGR is the context that matters. Swedish large-caps barely grew for 25 years. The small-cap growth screen delivered 6.56%, which is 2.6× the benchmark return. That gap persisted across economic cycles and rate regimes.
The Sortino ratio of 0.377 vs the OMX's 0.040 tells you the strategy didn't just beat the benchmark, it did so with much better risk-adjusted behavior. More return per unit of downside risk.
The 31% down capture is the mechanical driver. When the OMX fell, the small-cap growth portfolio fell only 31% as much. Combined with 98% up capture, you get asymmetric exposure: nearly all of the gains, a fraction of the losses.
2021: the year that broke it
The single event that defines this backtest is 2021, when the strategy fell -45.5%. The OMX returned -17.3% that year.
The excess return in 2021 was -28.2 percentage points. That one year wiped out most of the alpha built up from 2013 to 2020. Swedish growth stocks, like their global counterparts, got punished hard as interest rates rose and valuation multiples compressed. The strategy's concentration in high-revenue-growth names made it especially sensitive to this repricing.
Before 2021, the strategy had strung together a good run: +29.6% in 2016, +53.9% in 2020. The 2021 collapse came right after the best single year in the backtest.
The good years
2005-2006: After five cash years, the strategy deployed and immediately posted +33.8% and +28.5%. Swedish small-caps were cheap after the dot-com hangover.
2020: +53.9%. The pandemic rebound hit growth stocks hard on the upside. Revenue-growth companies bounced faster than value.
2015: +28.4% (vs OMX's -15.1%). A strong excess return year (+43.6%).
The bad years
2007: -28.9%. Pre-financial crisis selling hit Swedish small-caps early.
2021: -45.5%. The worst year, as discussed.
2022-2023: Two more underperformance years (-24.4%, -7.9% excess), part of the growth stock repricing cycle.
Annual Returns
| Year | Sweden | OMX Stockholm 30 | Excess |
|---|---|---|---|
| 2000 | 0.0% | -33.2% | +33.2% |
| 2001 | 0.0% | -33.5% | +33.5% |
| 2002 | 0.0% | -11.2% | +11.2% |
| 2003 | 0.0% | +31.3% | -31.3% |
| 2004 | 0.0% | +19.6% | -19.6% |
| 2005 | +33.8% | +15.5% | +18.3% |
| 2006 | +28.5% | +30.5% | -2.0% |
| 2007 | -28.9% | -32.3% | +3.4% |
| 2008 | -11.4% | -6.7% | -4.6% |
| 2009 | +36.2% | +24.1% | +12.1% |
| 2010 | +22.9% | +14.5% | +8.4% |
| 2011 | -6.5% | -9.0% | +2.5% |
| 2012 | +15.9% | +13.3% | +2.6% |
| 2013 | +31.4% | +19.5% | +11.8% |
| 2014 | +9.3% | +12.5% | -3.2% |
| 2015 | +28.4% | -15.1% | +43.6% |
| 2016 | +29.6% | +22.8% | +6.8% |
| 2017 | -10.6% | -5.3% | -5.3% |
| 2018 | +12.3% | +6.9% | +5.4% |
| 2019 | +1.0% | +3.5% | -2.5% |
| 2020 | +53.9% | +34.3% | +19.6% |
| 2021 | -45.5% | -17.3% | -28.2% |
| 2022 | -3.3% | +21.2% | -24.4% |
| 2023 | +3.4% | +11.3% | -7.9% |
| 2024 | +22.5% | -1.2% | +23.8% |
The excess return sequence is lumpy. Strong alpha in 2005, 2009, 2010, 2013, 2015, 2020. Then a brutal stretch from 2021-2023 where the strategy underperformed by -28.2%, -24.4%, and -7.9%. Three consecutive years of relative underperformance. 2024's recovery (+23.8% excess) shows the strategy can bounce back.
When It Works and When It Fails
When it works: Early in a recovery cycle, when Swedish small-caps are cheap and revenue growth is accelerating. 2005-2006, 2009-2010, and 2013-2015 show this pattern clearly. Also when the OMX is weak and small-cap growth provides genuine differentiation (2015, 2020, 2024).
When it fails: Rate-rising environments, especially when growth stocks are trading on rich multiples. 2021-2022 was the textbook example. The strategy has no defensive positioning, it always holds growth stocks, so it has no mechanism to de-risk when valuations get extended.
The down capture advantage: The 31% down capture means when the OMX falls, the strategy falls far less. 2007-2008 showed this (strategy fell less than the benchmark). The MaxDD of -47.24% vs the OMX's -60.54% reflects this protective behavior.
Limitations
Currency exposure. Returns are computed in local currency (SEK). SEK/USD moves add a layer of volatility for non-Swedish investors that isn't captured here.
Transaction costs. Swedish small-caps have wider bid-ask spreads than large-caps. The backtest assumes end-of-day pricing. Real execution on a 30-stock annual rebalance in mid-cap names is feasible, but slippage exists.
Survivorship bias. We use point-in-time data from FMP's financial warehouse, which includes delisted companies. The standard survivorship warning still applies to any data gaps.
Thin years. With 5 cash years and average 23.4 stocks, the portfolio is never large. In some years the universe likely had fewer qualifying names.
2021 as regime change. Whether 2021-2023's sustained underperformance represents a regime shift or a temporary drawdown is unclear. Swedish small-cap growth may be recovering; 2024's +21.4% is a positive sign.
Run It Yourself
The full backtest code is available in our public repository: ceta-research/backtests.
You can query the underlying data directly via the Ceta Research data explorer. The screen uses financial_ratios and key_metrics tables from the FMP warehouse. Revenue growth filter: year-over-year change in revenue from income_statement. Market cap bounds in SEK using marketCap from profile.
Takeaway
Sweden's small-cap growth screen beats the OMX Stockholm 30 by +4.01% per year over 25 years. That's genuine local alpha. The OMX's 2.55% CAGR is the key context: Swedish large-caps barely grew. Small-cap growth companies delivered 6.56%, which is 2.6× the benchmark return.
The risk profile is strong: Sortino of 0.377 vs the OMX's 0.040, 31% down capture, 98% up capture. The strategy earns its returns through asymmetric exposure to the local market.
The 2021 event (-45.5%) is the main caveat. That one year wiped out most of the alpha built up from 2013 to 2020. The strategy has no defensive mechanism when growth stocks reprice. But 2024's recovery (+23.8% excess) shows the strategy can bounce back.
For investors seeking exposure to Swedish small-cap growth, this screen delivers alpha relative to the local benchmark. The 2021-2023 drawdown is the cost of that alpha.
Data: FMP financial data warehouse, 2000–2025. Updated March 2026.
Data: Ceta Research (FMP financial data warehouse), 2000-2025. Full methodology: METHODOLOGY.md. Past performance does not guarantee future results. This is educational content, not investment advice.
References
- Banz, R. (1981). "The Relationship Between Return and Market Value of Common Stocks." Journal of Financial Economics, 9(1), 3-18.
- Fama, E. & French, K. (1992). "The Cross-Section of Expected Stock Returns." Journal of Finance, 47(2), 427-465.
- Fama, E. & French, K. (1993). "Common Risk Factors in the Returns on Stocks and Bonds." Journal of Financial Economics, 33(1), 3-56.
- Van Dijk, M. (2011). "Is size dead? A review of the size effect in equity returns." Journal of Banking & Finance, 35(12), 3263-3274.


