
Small-Cap Growth Thailand: The Emerging Market That Breaks the Pattern
Thailand's small-cap growth screen returned 2.60% CAGR, underperforming the SET Index (5.13%) by -2.53%/yr and SPY (7.85%) by -5.25%/yr. Near-zero Sharpe of 0.004 and -59.62% max drawdown. The emerging market premium thesis doesn't hold here.

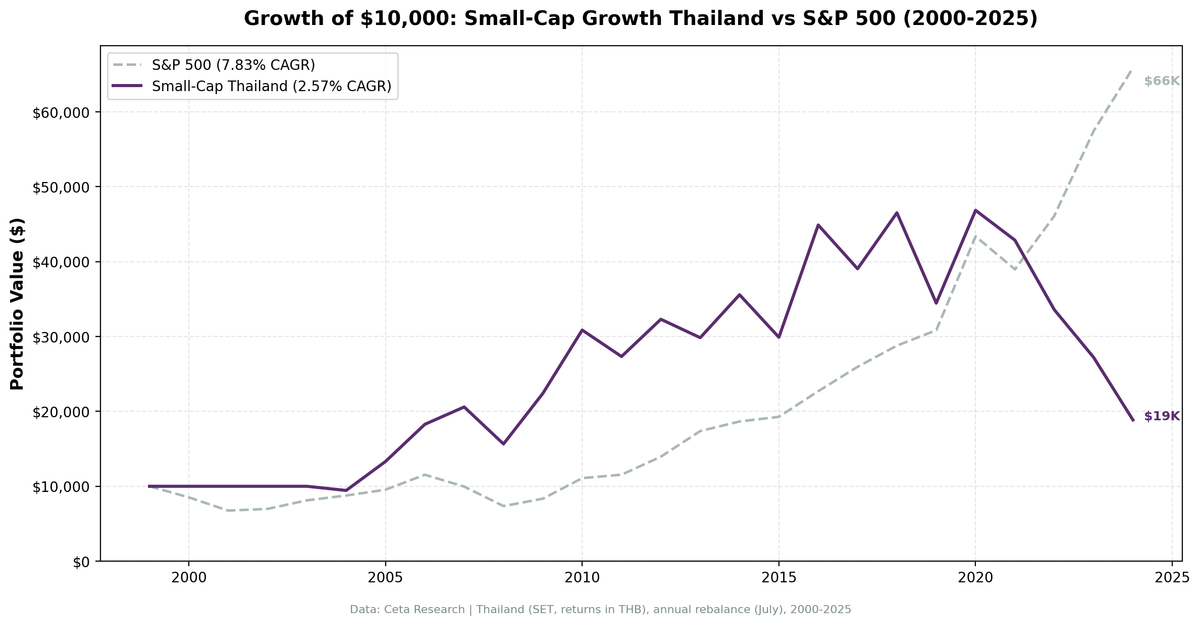
Small-Cap Growth Thailand: Underperforms Both SET Index and SPY
The academic case for small-cap investing in emerging markets is intuitive. Less analyst coverage, less institutional ownership, more mispricings, higher expected growth. Fama-French documented the size premium. The story should work better in less efficient markets.
Contents
- Executive Summary
- The Method
- What We Found
- Near-zero Sharpe: what it means in practice
- 131% down capture versus SET Index: the wrong asymmetry
- 2022-2024: three consecutive bad years
- Why Thailand underperforms despite being an EM
- Annual Returns
- When It Works and When It Fails
- The EM Comparison: China, India vs. Thailand
- Limitations
- Run It Yourself
- Takeaway
- References
Thailand doesn't cooperate. 2.60% CAGR over 25 years. -2.53% per year against the SET Index (5.13% CAGR). -5.25% per year against SPY (7.85% CAGR). A Sharpe ratio of 0.004. That's not a rounding error. It means the strategy earned essentially zero return per unit of risk across 25 years. And 2022-2024 posted three consecutive years of losses: -20.95%, -19.86%, -29.74%.
This is the intellectually honest result. The emerging market premium isn't universal, and even the local benchmark beat this strategy.
Executive Summary
| Metric | Thailand (SET) | SET Index | SPY |
|---|---|---|---|
| CAGR | 2.60% | 5.13% | 7.85% |
| Excess vs SET Index | -2.53%/yr | — | — |
| Excess vs SPY | -5.25%/yr | — | — |
| Sharpe Ratio | 0.004 | 0.160 | 0.360 |
| Sortino Ratio | 0.008 | 0.305 | 0.654 |
| Max Drawdown | -59.62% | -35.59% | -36.27% |
| Win Rate vs SET | 36% | — | — |
| Win Rate vs SPY | 36% | — | — |
| $10K → | $19,010 | $34,946 | — |
| Up Capture vs SET | 99.1% | — | — |
| Down Capture vs SET | 131.0% | — | — |
$10,000 invested in 2000 became $19,010. The SET Index turned it into $34,946. SPY turned it into roughly $78,500. The Sortino of 0.008 is essentially the Sharpe. Both round to nearly zero. The strategy made almost nothing per unit of risk for a quarter century, and it underperformed the local benchmark decisively.
The Method
We screened the Stock Exchange of Thailand (SET) annually each July (with a 45-day filing lag). The filter:
- Market cap between ฿500M and ฿20B (small-cap bounds for Thailand)
- Revenue growth >15% year-over-year (fiscal year)
- Positive net income
- Debt-to-equity <2.0
Top 30 by revenue growth, equal weight. Annual rebalance.
Four cash years (2000-2003) held no positions. The average portfolio held 20.0 stocks, which is a reasonable-sized portfolio for this market.
Full methodology: METHODOLOGY.md
For the US flagship results, see our US small-cap growth backtest.
What We Found
Near-zero Sharpe: what it means in practice
A Sharpe ratio of 0.004 over 25 years means the strategy produced almost no excess return per unit of volatility. Compare: SET Index is 0.160, SPY is 0.360, Switzerland is 0.267, Sweden is 0.208. Even the local benchmark generated something meaningful. Thailand small-cap growth generated noise.
A 36% win rate versus both SET Index and SPY means the strategy beat the benchmarks in just over one-third of years. That's not the full story. The problem is asymmetry: the winning years were moderate, and the losing years were severe. When you lose more than you win in magnitude, and you lose nearly as often as you win, the long-run result is near-zero.
131% down capture versus SET Index: the wrong asymmetry
Thailand's 131% down capture versus the SET Index is catastrophic. When the local benchmark fell, Thai small-cap growth fell 31% more. That's the opposite of what you want. 99% up capture means the strategy participates almost fully in the SET Index's upside, but it amplifies the downside.
The maximum drawdown of -59.62% versus SET Index's -35.59% shows the same pattern: the strategy is riskier than the local benchmark without adding any return. You get the protection asymmetry in the wrong direction completely.
2022-2024: three consecutive bad years
The recent record deserves direct attention. Three years of losses in a row:
- 2022: -20.95% (SET Index -3.42%, SPY +18.3%)
- 2023: -19.86% (SET Index -14.48%, SPY +24.6%)
- 2024: -29.74% (SET Index -13.42%, SPY +14.7%)
The strategy underperformed both benchmarks across all three years. Even the SET Index, which was weak in 2023-2024, beat the strategy. The cumulative gap versus SPY across 2022-2024 is over 100 percentage points. That's not a temporary dip. That's a fundamental disconnection between Thai small-cap growth and both local and global equity performance.
Thailand's political environment in this period was difficult. The 2014 military coup had long-term effects on business investment and foreign capital flows. Rising baht instability added currency headwinds. And the domestic investor base is smaller than China or India, meaning international capital flows dominate sentiment — and those flows moved elsewhere.
Why Thailand underperforms despite being an EM
The standard emerging market premium argument rests on: (1) higher economic growth rates, (2) less market efficiency, (3) expanding middle class, (4) convergence potential. Thailand has some of these.
But there are compounding negatives that the standard thesis doesn't price in adequately:
Political instability. Thailand has experienced multiple military coups and political crises. Business continuity in this environment is harder to sustain. Revenue growth can be disrupted suddenly by political events in ways that don't affect more stable EMs.
Currency exposure. The Thai baht is not a reserve currency and has experienced significant devaluation periods. A -30.7% year in 2024 reflects both baht weakness and stock price declines. For foreign investors, this is a double hit.
Market liquidity. The SET is smaller and less liquid than NSE (India) or HKSE (China). In thin markets, reversals are faster and deeper.
Less domestic institutional base. India and China have deep domestic mutual fund industries and growing retail investor bases. Thailand's domestic capital market is thinner. When foreign institutional investors exit, the market drops harder.
Export dependency and external shocks. Thailand's economy is heavily tourism and export-dependent. COVID hit it disproportionately (tourism collapse), and the recovery was slower than markets expecting a V-shape.
Annual Returns
| Year | Strategy | SET Index | Excess vs SET |
|---|---|---|---|
| 2000 | 0.00% | +1.00% | -1.00% |
| 2001 | 0.00% | +21.19% | -21.19% |
| 2002 | 0.00% | +22.25% | -22.25% |
| 2003 | 0.00% | +35.55% | -35.55% |
| 2004 | -6.88% | +3.43% | -10.31% |
| 2005 | +40.96% | +3.69% | +37.27% |
| 2006 | +37.29% | +14.14% | +23.16% |
| 2007 | +15.84% | -4.13% | +19.96% |
| 2008 | -24.01% | -23.23% | -0.78% |
| 2009 | +44.07% | +37.55% | +6.52% |
| 2010 | +37.29% | +35.85% | +1.44% |
| 2011 | -11.44% | +9.03% | -20.47% |
| 2012 | +18.09% | +23.15% | -5.07% |
| 2013 | -7.62% | +1.90% | -9.52% |
| 2014 | +19.22% | -0.01% | +19.24% |
| 2015 | -15.78% | -2.48% | -13.29% |
| 2016 | +50.15% | +8.58% | +41.57% |
| 2017 | -13.02% | +1.76% | -14.78% |
| 2018 | +18.40% | +7.77% | +10.63% |
| 2019 | -25.02% | -20.67% | -4.34% |
| 2020 | +32.13% | +14.87% | +17.26% |
| 2021 | -8.42% | -1.15% | -7.27% |
| 2022 | -20.95% | -3.42% | -17.53% |
| 2023 | -19.86% | -14.48% | -5.38% |
| 2024 | -29.74% | -13.42% | -16.32% |
The early years (2005-2010) tell a very different story from the later years. 2005-2010 shows Thailand generating genuine outperformance versus the SET Index in several years. Post-2013, the pattern becomes erratic, with large negative excess years interrupting occasional wins. The 2019 (-25.02% vs SET -20.67%) and the 2022-2024 streak show structural deterioration even versus the local benchmark.
When It Works and When It Fails
When it works: Post-crisis recoveries in Asian markets. 2005 (+40.96%, +37.27% vs SET), 2006 (+37.29%, +23.16% vs SET), 2009 (+44.07%, +6.52% vs SET), 2016 (+50.15%, +41.57% vs SET) all show the strategy capturing significant upside in reflationary environments. When Thai domestics are cheap and global capital is flowing into EM, the screen picks up genuine beneficiaries.
When it fails: Political disruption, currency weakness, and global risk-off periods. Thailand is an emerging market that reacts badly to geopolitical events and capital flow reversals. 2019's -25.02% (SET -20.67%) preceded COVID by a year, driven by trade war spillover and domestic political tension. 2022-2024 reflects sustained capital outflow from frontier/secondary EM, and the strategy underperformed even the weak SET Index.
The post-2019 pattern. Something changed after 2018. The strategy hasn't had a clean outperformance year against the SET Index since 2020's +17.26% excess. The 2022-2024 underperformance versus the local benchmark (-17.53%, -5.38%, -16.32%) is particularly damning. Whether this is cyclical or structural is the key question. The political and currency dynamics suggest at least some of it is structural.
The EM Comparison: China, India vs. Thailand
We've tested multiple emerging markets in this series. China (HKSE) and India (NSE) both produce results that give the EM small-cap thesis more support than Thailand does. The key differences:
China and India have massive domestic investor bases, deep institutional markets, and government policies that actively support equity market development. Small-cap growth in those markets benefits from domestic capital formation.
Thailand depends more on foreign institutional flows. When those flows exit, the market lacks the domestic support that China/India have. The SET becomes more volatile and mean-reversion is harder to time.
Regulatory and governance quality also differs. Indian listed companies face SEBI oversight with improving governance standards. Chinese companies have state-backed institutional frameworks. Thai small-caps operate with less institutional accountability on average.
This doesn't mean Thailand is a bad economy. It means systematic small-cap growth investing via this particular screen doesn't extract a premium there.
Limitations
Currency. All returns are in Thai baht. Significant baht weakness adds downside for non-THB investors.
Political risk pricing. The backtest doesn't model political event risk. Coup risk and sudden policy changes create discontinuous returns that historical backtesting can't fully represent.
Liquidity. Some Thai small-caps near the ฿500M threshold have very limited daily trading volume. Real execution at scale would experience meaningful slippage.
Data completeness. FMP's Thailand data coverage may be thinner than developed market exchanges, particularly for earlier years (pre-2010).
Regime change. The pre-2013 and post-2013 periods look like different strategies. Treating them as a single 25-year run may obscure a structural break.
Run It Yourself
Full backtest code is in our public repository: ceta-research/backtests.
The Thailand screen uses exchange = 'SET' in the profile table. Market cap bounds are in Thai baht. Revenue growth uses revenue from income_statement with fiscal year reporting lag.
Takeaway
Thailand is the counterexample in the emerging market small-cap story. -2.53%/yr against the SET Index, -5.25%/yr against SPY, near-zero Sharpe, -59.62% maximum drawdown, and a 2022-2024 streak that is among the worst 3-year runs of any exchange we tested. The strategy underperformed both the local and global benchmarks decisively.
The lesson isn't that EM small-cap doesn't work. It's that the category is too broad. China and India generate different results because they have different structural characteristics: larger domestic investor bases, stronger institutional frameworks, more domestic capital formation. Thailand has meaningful handicaps: political instability, baht volatility, and thinner domestic institutional support. The 131% down capture versus the SET Index shows the strategy is riskier than the local benchmark without adding any return.
The small-cap premium requires frictions to persist. It needs mispricings that arbitrage can't easily correct. Thailand has those frictions, but the returns suggest the wrong kind of friction: execution risk, political risk, and liquidity risk that eats the premium before investors can collect it.
Data: FMP financial data warehouse, 2000–2025. Updated March 2026.
Data: Ceta Research (FMP financial data warehouse), 2000-2025. Full methodology: METHODOLOGY.md. Past performance does not guarantee future results. This is educational content, not investment advice.
References
- Banz, R. (1981). "The Relationship Between Return and Market Value of Common Stocks." Journal of Financial Economics, 9(1), 3-18.
- Fama, E. & French, K. (1992). "The Cross-Section of Expected Stock Returns." Journal of Finance, 47(2), 427-465.
- Fama, E. & French, K. (1993). "Common Risk Factors in the Returns on Stocks and Bonds." Journal of Financial Economics, 33(1), 3-56.
- Van Dijk, M. (2011). "Is size dead? A review of the size effect in equity returns." Journal of Banking & Finance, 35(12), 3263-3274.


