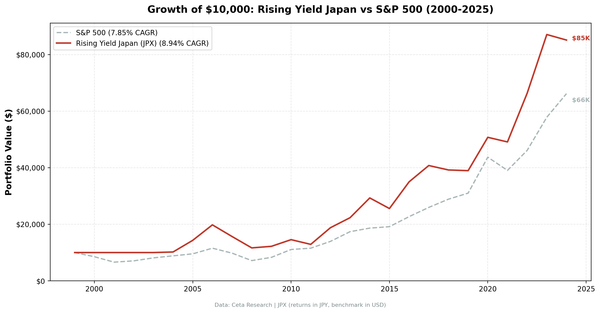
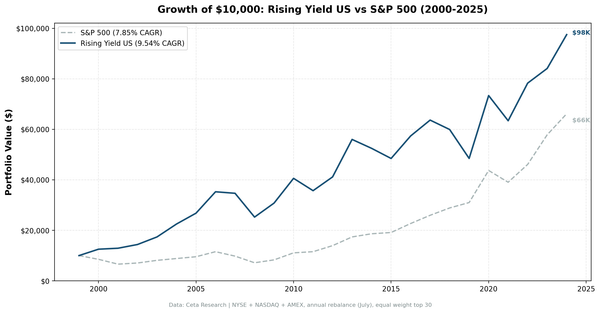
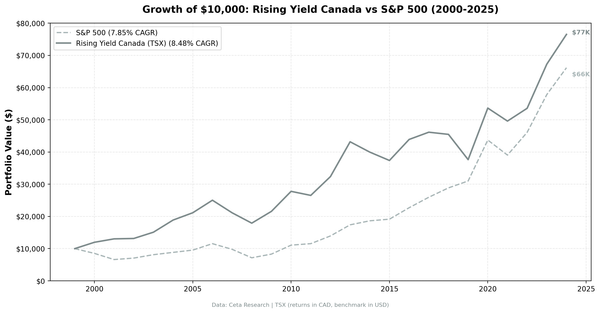
earnings surprise
Earnings Surprise Drift in Canada: Symmetric PEAD on TSX, 26 Years
Canada has a 50.5% beat rate and clean bilateral PEAD. Biggest beats produce +2.27% CAR at T+63, biggest misses -1.87%. Q5-Q1 spread: +4.14%.
earnings surprise
Canada has a 50.5% beat rate and clean bilateral PEAD. Biggest beats produce +2.27% CAR at T+63, biggest misses -1.87%. Q5-Q1 spread: +4.14%.
earnings surprise
China's beat rate is 34.6%, the lowest of 14 exchanges tested. But when Chinese companies beat estimates, the drift is real: +2.48% CAR at T+63. Negative surprises barely drift (-0.08%).
earnings surprise
We tested Post-Earnings Announcement Drift on 14 global exchanges with 300,000+ events from 2000-2025. PEAD is universal. India leads (+6.89% Q5-Q1 spread vs Sensex), Sweden trails (+1.12%). Every exchange shows positive drift.
earnings surprise
India's PEAD is the strongest in our global study. Positive earnings surprises produce +3.77% CAR at T+63 vs Sensex. Q5 biggest beats reach +5.39%. The Q5-Q1 spread of +6.89% is the largest of any exchange we tested.
earnings surprise
Japan PEAD is miss-heavy vs Nikkei 225. Biggest misses produce -2.84% CAR at T+63 (t=-11.3). Biggest beats produce +2.09% (t=8.3). Q5-Q1 spread: +4.93%.
earnings surprise
Taiwan's Q5-Q1 earnings drift spread is +5.47% at T+63, second globally. The story is driven by the miss side: worst misses produce -3.71% CAR at T+63.
earnings surprise
Thailand PEAD works on both sides vs the local SET Index. Q5 beats: +2.49% CAR at T+63 (t=+5.1). Q1 misses: -1.78% (t=-3.8). Q5-Q1 spread: +4.28%. Thailand ranks 6th globally.
earnings surprise
UK earnings beats produce +1.13% CAR at T+63 vs FTSE 100. Q5 biggest beats reach +1.83%. Misses produce -1.01%. The Q5-Q1 spread (+3.19%) has contributions from both sides.
earnings surprise
We ran an event study on 170,000 US earnings announcements from 2000 to 2025. The drift is real, but asymmetric: misses cause 8x more drift than beats.
momentum
We ran the 52-week high proximity screen across 18 exchanges with local benchmark comparisons. 14 of 18 show positive alpha. Thailand +7.56% vs SET Index, India +7.28% vs Sensex, Japan +4.79% vs Nikkei. Even UK now positive (+1.09% vs FTSE). Local currency benchmarks reveal the real story.
momentum
We tested the 52-week high proximity strategy on NSE stocks from 2000 to 2025 with next-day execution. 18.40% CAGR vs 11.12% Sensex, +7.28% excess return. ₹1 grew to ₹77.42 vs ₹15.11 for Sensex. The anchoring effect persists in India's retail-dominated market.
momentum
We tested the 52-week high proximity strategy on Japanese stocks (JPX) from 2000 to 2025. 8.19% CAGR, +4.79% vs Nikkei 225, 42.0% down capture. In a market that went sideways for a decade, the signal found the winners and avoided the worst drawdowns.