
Rising Dividend Yield on German Stocks: 8.94% CAGR With Zero Cash Periods on XETRA
Rising dividend yield on XETRA returned 8.94% annually from 2000 to 2025 with zero cash periods, +3.90% annual alpha vs the DAX. Germany's industrial economy consistently produced dividend growers across all 25 years.

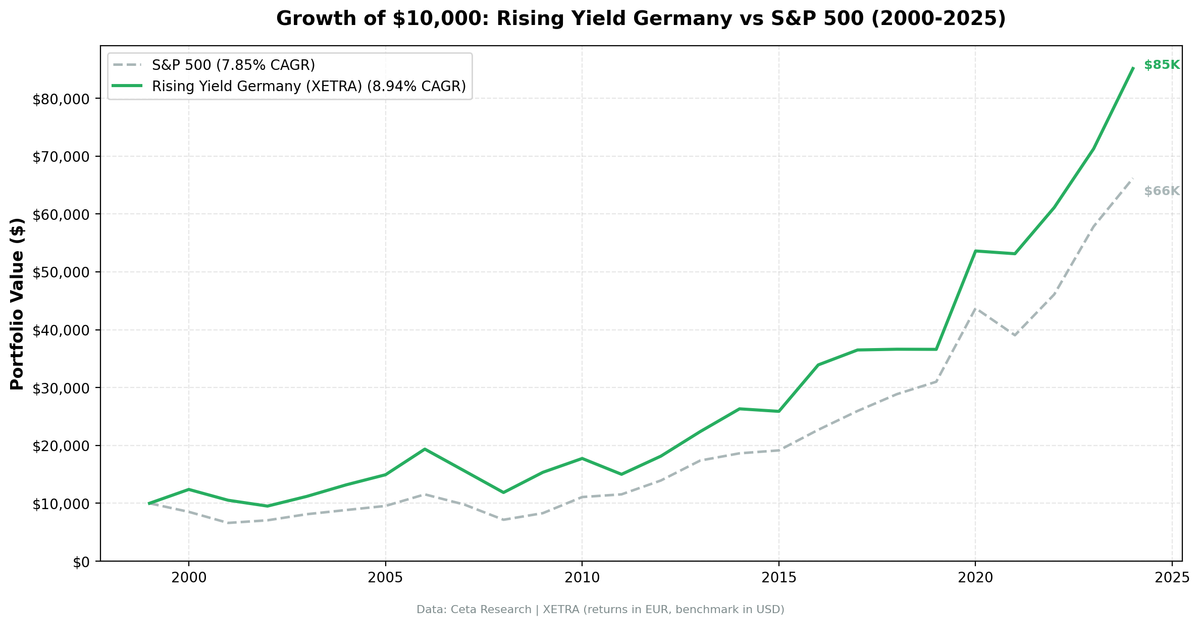
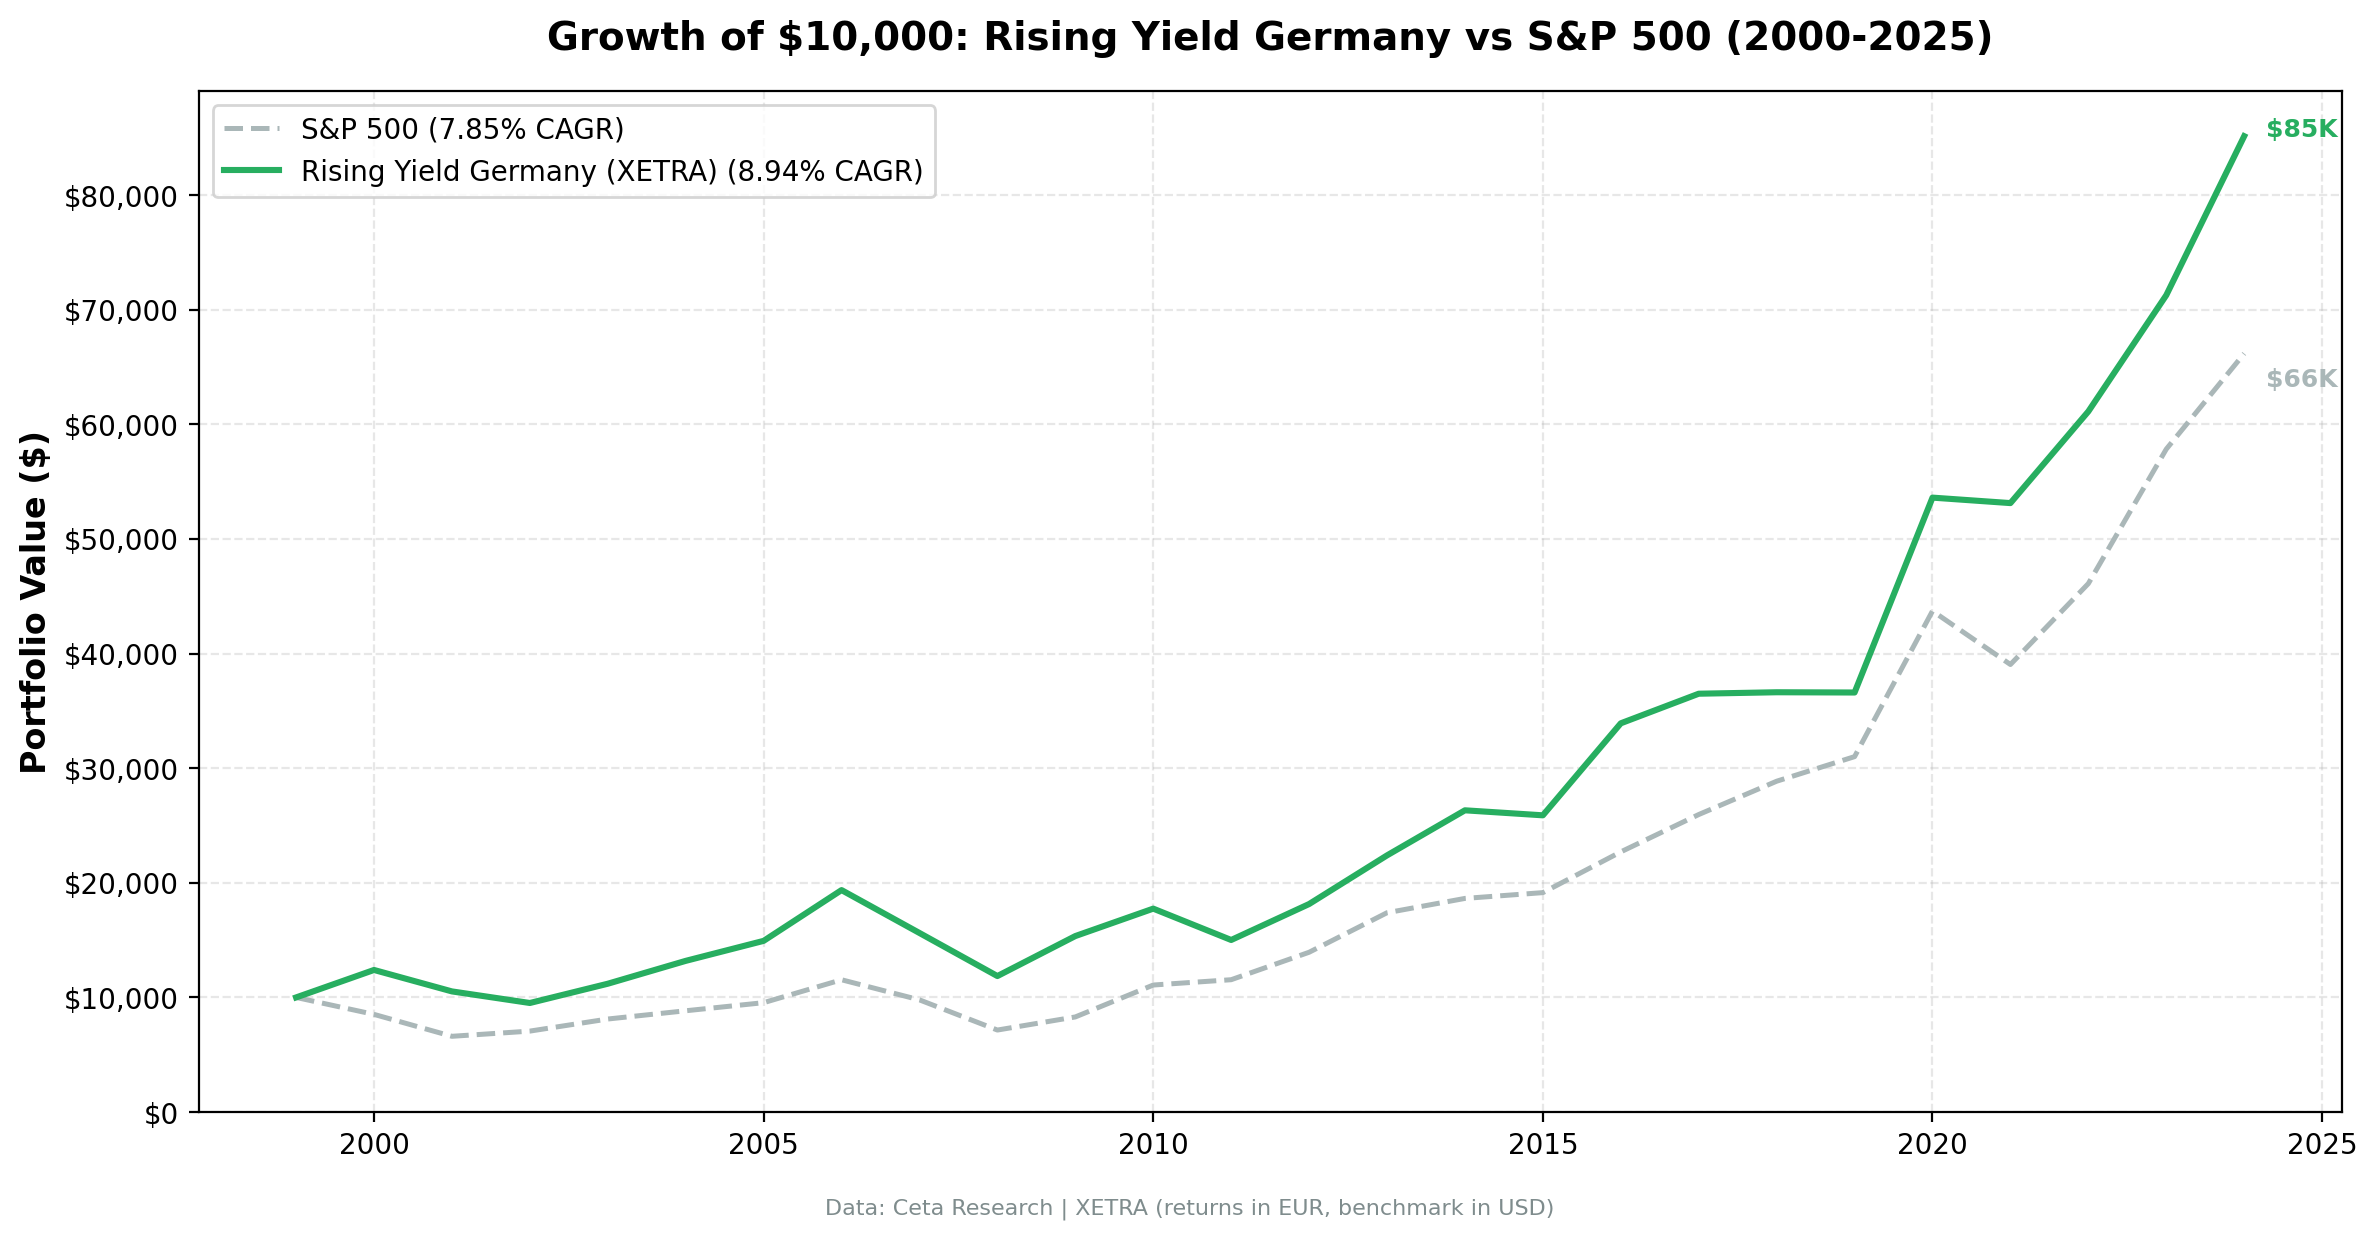
We ran the rising dividend yield screen on XETRA-listed stocks from 2000 to 2025. The portfolio returned 8.94% annually vs 5.04% for the DAX, +3.90% annual alpha, with zero cash periods across 25 years. Germany's Mittelstand and large industrial companies produced a consistent stream of dividend growers in every single rebalancing window. The strategy was always invested, averaging 21 stocks per year. The trade-off: deeper drawdowns than the US version, with a -38.73% max drawdown vs -28.42% for the US rising yield portfolio.
Contents
- Method
- The Screen (SQL)
- What We Found
- 25 years of data. +3.90% annual alpha vs DAX. Zero cash periods.
- Year-by-year returns
- Key Observations
- 2000: Dot-com protection
- 2001-2002: The exception
- The 2003-2006 recovery
- 2008-2009: Crash and recovery
- 2014 and 2016: Divergence years
- 2020: The pandemic rebound
- 2017-2019: The tough stretch
- Currency Note
- Germany vs US: Rising Yield Comparison
- Limitations
- Takeaway
- Part of a Series
- References
- Run This Screen Yourself
Data: FMP financial data warehouse, 2000–2025. Updated March 2026.
Method
Data source: Ceta Research (FMP financial data warehouse) Universe: XETRA, market cap > EUR 500M (~$545M USD) Period: 2000-2025 (25 years, 25 annual periods) Signal: 3 consecutive FY years of rising dividendYield, driven by DPS growth (not price decline) Quality filters: ROE > 10%, Payout < 75% Portfolio: Top 30 by 2-year yield expansion, equal weight Rebalancing: Annual (July) Cash rule: Hold cash if fewer than 10 stocks qualify Benchmark: DAX (EUR, local benchmark) Transaction costs: Size-tiered (0.1-0.5% one-way)
For the full methodology and signal construction, see the main US Rising Yield post.
The Screen (SQL)
WITH yearly_yield AS (
    SELECT r.symbol, r.date, r.fiscalYear AS yr,
        r.dividendYield, r.dividendPerShare, r.dividendPayoutRatio,
        LAG(r.dividendYield, 1) OVER (PARTITION BY r.symbol ORDER BY r.fiscalYear) AS yield_1yr,
        LAG(r.dividendYield, 2) OVER (PARTITION BY r.symbol ORDER BY r.fiscalYear) AS yield_2yr,
        LAG(r.dividendPerShare, 1) OVER (PARTITION BY r.symbol ORDER BY r.fiscalYear) AS dps_1yr,
        LAG(r.dividendPerShare, 2) OVER (PARTITION BY r.symbol ORDER BY r.fiscalYear) AS dps_2yr
    FROM financial_ratios r
    WHERE r.period = 'FY' AND r.dividendYield > 0
),
screened AS (
    SELECT y.symbol, y.date, y.yr,
        y.dividendYield, y.dividendPerShare, y.dividendPayoutRatio,
        (y.dividendYield - y.yield_2yr) AS yield_change_2yr,
        CASE
            WHEN y.dividendPerShare > y.dps_1yr AND y.dps_1yr > y.dps_2yr THEN 'Consecutive DPS Growth'
            WHEN y.dividendPerShare > y.dps_1yr THEN 'Partial DPS Growth'
            ELSE 'Price Decline Driver'
        END AS yield_driver
    FROM yearly_yield y
    WHERE y.yield_2yr IS NOT NULL
      AND y.dividendYield > y.yield_1yr AND y.yield_1yr > y.yield_2yr
      AND y.dividendPerShare > y.dps_1yr
      AND y.dividendPayoutRatio > 0 AND y.dividendPayoutRatio < 0.75
    QUALIFY ROW_NUMBER() OVER (PARTITION BY y.symbol ORDER BY y.date DESC) = 1
)
SELECT s.symbol, p.companyName,
    ROUND(s.dividendYield * 100, 2) AS yield_pct,
    ROUND(s.yield_change_2yr * 100, 2) AS yield_expansion_2yr_pct,
    s.yield_driver,
    ROUND(s.dividendPayoutRatio * 100, 1) AS payout_pct,
    ROUND(k.returnOnEquityTTM * 100, 1) AS roe_pct,
    ROUND(k.marketCap / 1e9, 1) AS market_cap_b
FROM screened s
JOIN key_metrics_ttm k ON s.symbol = k.symbol
JOIN profile p ON s.symbol = p.symbol
WHERE k.returnOnEquityTTM > 0.10
  AND k.marketCap > 500e6  -- €500M (~$545M USD)
  AND p.exchange = 'XETRA'
ORDER BY s.yield_change_2yr DESC
LIMIT 30
What We Found
25 years of data. +3.90% annual alpha vs DAX. Zero cash periods.
| Metric | Rising Yield (EUR) | DAX (EUR) |
|---|---|---|
| CAGR | 8.94% | 5.04% |
| Total Return | 751% | - |
| Volatility | 17.72% | 16.22% |
| Max Drawdown | -38.73% | - |
| Sharpe Ratio | 0.392 | - |
| Sortino Ratio | 0.798 | - |
| Beta | 0.703 | - |
| Alpha | +3.90% annual | - |
| Win Rate (annual) | 56% | - |
| Avg Stocks per Period | 20.6 | - |
| Cash Periods | 0 of 25 | - |
| Invested Periods | 25 of 25 | - |
The strategy delivered 751% total return over 25 years. Zero cash periods across the entire history. Germany's industrial economy consistently produces companies with three consecutive years of rising dividend yield. The screen never struggled to find qualifying stocks.
The 56% win rate is strong. More than half the time, German dividend growers beat the DAX in a given year. The Sortino ratio (0.798) is solid, showing that the downside volatility is contained relative to the upside.
The max drawdown (-38.73%) is the main concern. German stocks are highly correlated with global markets during sell-offs, and dividend growers aren't immune to that.
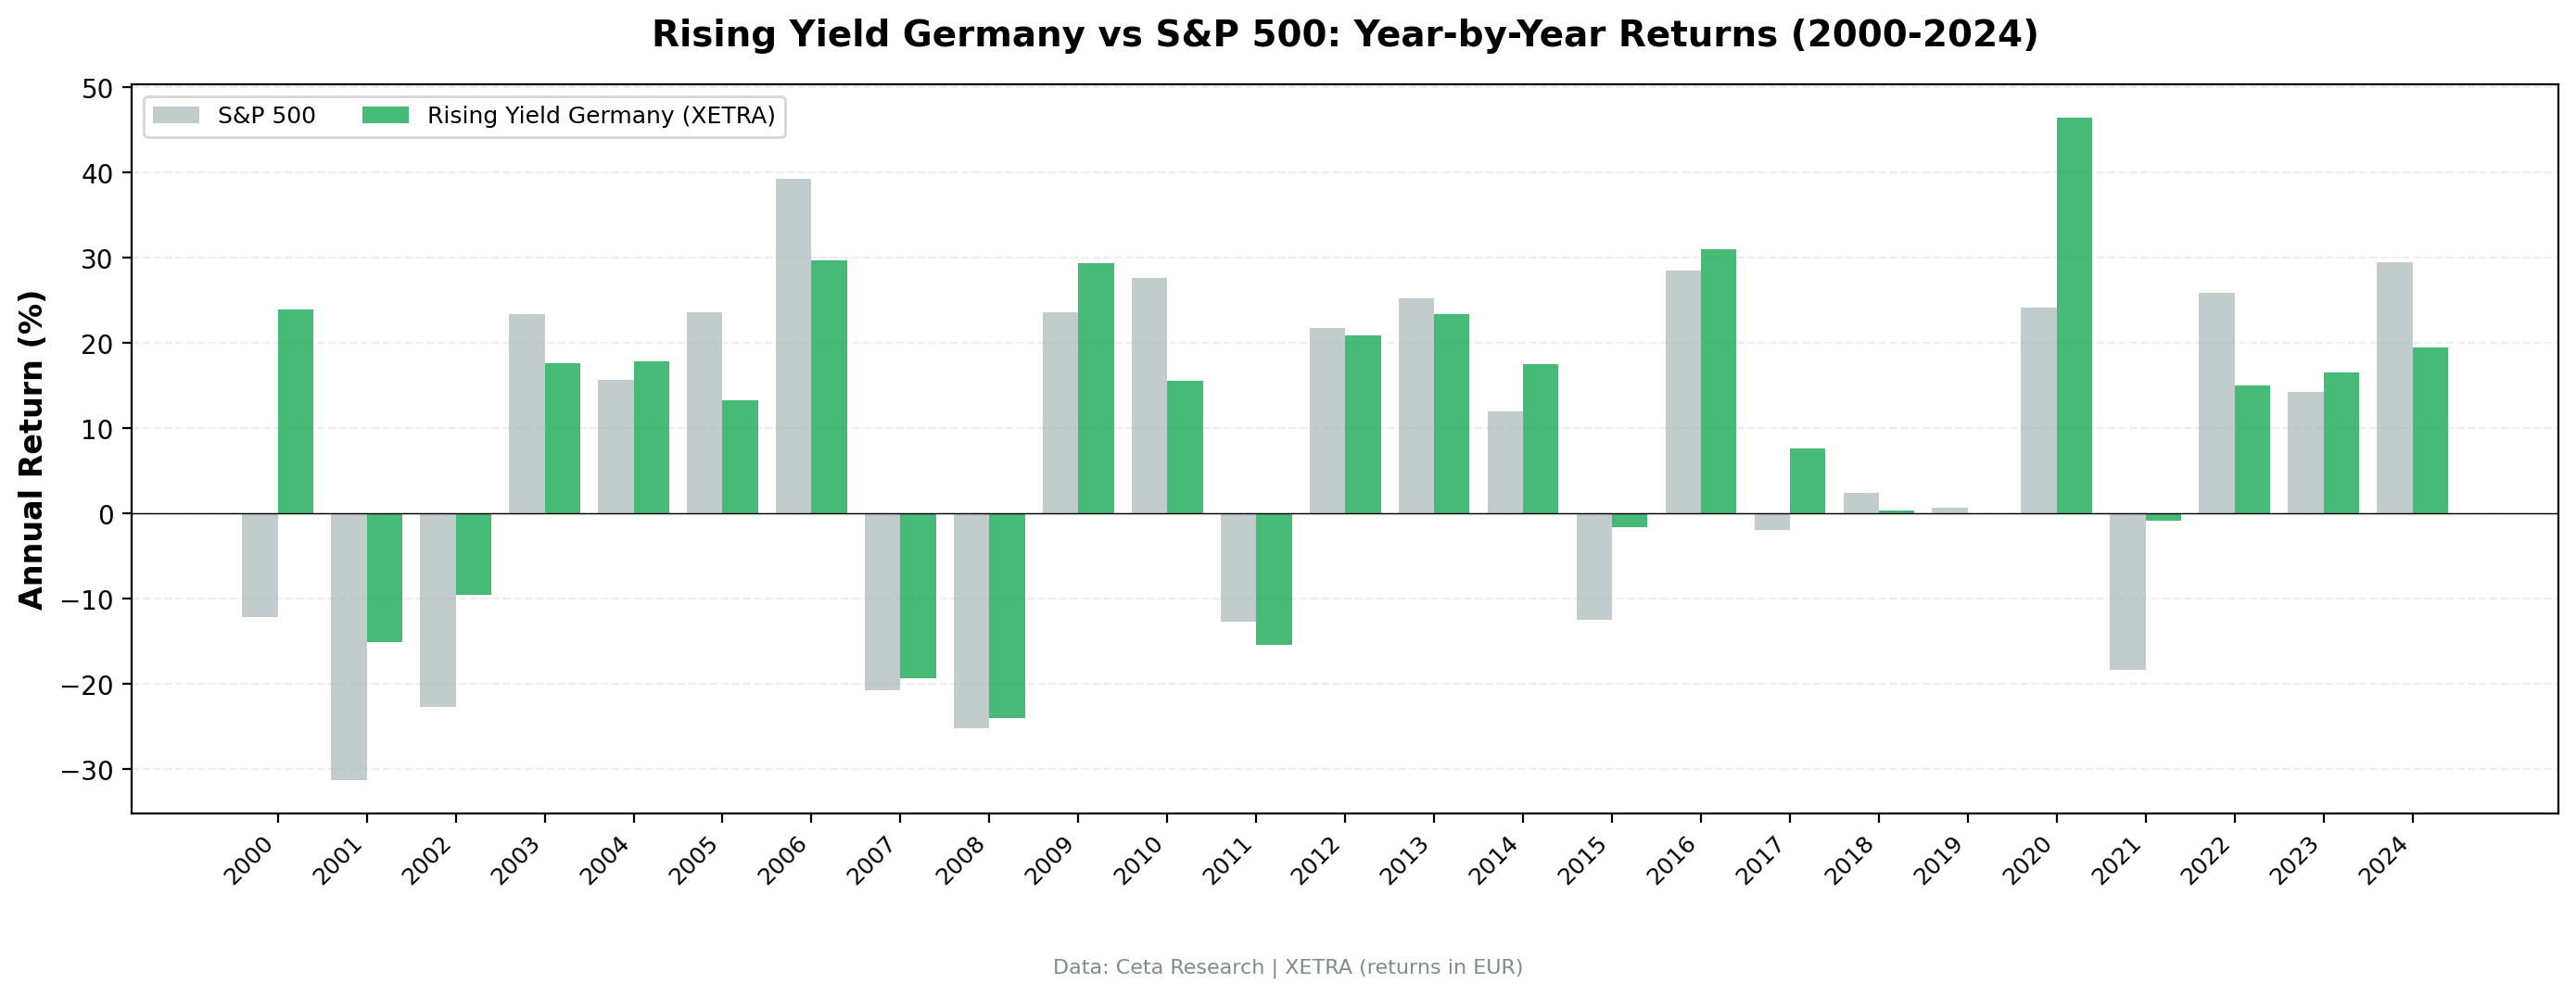
Year-by-year returns
| Year | Rising Yield (EUR) | DAX (EUR) | Excess |
|---|---|---|---|
| 2000 | +24.0% | -12.2% | +36.2% |
| 2001 | -15.1% | -31.3% | +16.2% |
| 2002 | -9.6% | -22.8% | +13.2% |
| 2003 | +17.7% | +23.4% | -5.7% |
| 2004 | +17.8% | +15.6% | +2.2% |
| 2005 | +13.2% | +23.6% | -10.3% |
| 2006 | +29.7% | +39.3% | -9.6% |
| 2007 | -19.3% | -20.8% | +1.4% |
| 2008 | -24.1% | -25.2% | +1.1% |
| 2009 | +29.4% | +23.6% | +5.8% |
| 2010 | +15.6% | +27.6% | -12.0% |
| 2011 | -15.4% | -12.7% | -2.7% |
| 2012 | +20.9% | +21.8% | -0.9% |
| 2013 | +23.4% | +25.3% | -1.9% |
| 2014 | +17.6% | +12.0% | +5.6% |
| 2015 | -1.7% | -12.5% | +10.9% |
| 2016 | +31.0% | +28.5% | +2.5% |
| 2017 | +7.6% | -1.9% | +9.5% |
| 2018 | +0.3% | +2.4% | -2.0% |
| 2019 | -0.1% | +0.7% | -0.7% |
| 2020 | +46.5% | +24.1% | +22.3% |
| 2021 | -0.9% | -18.4% | +17.5% |
| 2022 | +15.1% | +25.9% | -10.8% |
| 2023 | +16.6% | +14.3% | +2.3% |
| 2024 | +19.5% | +29.5% | -10.0% |
Key Observations
2000: Dot-com protection
+24.0% while the DAX dropped 12.2%. German dividend growers were completely disconnected from the tech bubble. XETRA's composition leans industrial and financial, not tech. Companies growing their dividends through the late 1990s were exactly the businesses immune to the dot-com crash.
2001-2002: The exception
The 2001-2002 period was rough. -15.1% in 2001, -9.6% in 2002. Germany's industrial economy slowed after the dot-com bust, and even dividend growers suffered. This two-year stretch contributed to the -38.73% max drawdown. The DAX fell much harder (-31.3% and -22.8%), so the strategy held up relatively well, but absolute losses were still severe. Unlike India's version of this strategy, the German portfolio didn't escape the early-2000s downturn.
The 2003-2006 recovery
Four years of returns: +17.7%, +17.8%, +13.2%, +29.7%. Germany's export economy boomed as the Euro weakened and Chinese demand for industrial goods exploded. Mittelstand companies, the backbone of XETRA's dividend grower universe, were the direct beneficiaries. The DAX outperformed in 2005 and 2006, but the strategy held its own.
2008-2009: Crash and recovery
-24.1% in 2008, then +29.4% in 2009. The drawdown was slightly shallower than the DAX's -25.2%. The recovery was strong, with a 5.8-point excess return in 2009. The quality filter ensured the companies that survived were positioned to bounce.
2014 and 2016: Divergence years
+17.6% in 2014 and +31.0% in 2016, with +5.6% and +2.5% excess vs the DAX respectively. Both years, German industrials benefited from a weak Euro boosting exports. Dividend growers in the automotive, chemical, and engineering sectors captured this tailwind.
2020: The pandemic rebound
+46.5%, the best single year. German dividend growers that passed the screen in July 2019 were mature, cash-rich companies. They survived the pandemic sell-off and recovered aggressively as global demand for industrial goods snapped back. The +22.3% excess vs the DAX was among the largest single-year alphas in the record.
2017-2019: The tough stretch
Three weak years: +7.6%, +0.3%, -0.1%. The same pattern as the US version. Growth stocks dominated globally, and dividend-oriented strategies trailed. Germany had the added headwind of automotive sector uncertainty (diesel scandal, EV transition concerns). Some traditionally strong dividend growers in the auto supply chain stumbled.
Currency Note
Returns are in Euros. The benchmark is the DAX, also in Euros. Currency is consistent for the local comparison. The EUR/USD rate was roughly 0.92 at the start of 2000 and roughly 1.04 at the end of 2024. The Euro strengthened slightly over the period, which adds roughly 0.5% annually for USD-based investors.
For context against US markets:
| Metric | Rising Yield (EUR) | Rising Yield (est. USD) | S&P 500 (USD) |
|---|---|---|---|
| CAGR | 8.94% | ~9.4% | 7.85% |
| Excess vs DAX | +3.90% | - | - |
The local alpha story (+3.90% vs DAX) is the more meaningful comparison for XETRA investors.
Germany vs US: Rising Yield Comparison
| Metric | Germany (EUR) | US (USD) |
|---|---|---|
| CAGR | 8.94% | 9.54% |
| Max Drawdown | -38.73% | -28.42% |
| Sharpe | 0.392 | 0.392 |
| Win Rate | 56% | 52% |
| Cash Periods | 0/25 | 0/25 |
| Avg Stocks | 20.6 | 26.5 |
Germany's win rate is higher (56% vs 52%), but the US version has a shallower drawdown (-28.42% vs -38.73%) at an identical Sharpe (0.392). Germany's advantage is consistency: zero cash periods and a broader set of qualifying years. The US version delivers better risk-adjusted returns overall.
The composition differs. Germany's portfolio is heavy on industrials, chemicals, and financial services. The US version skews more toward consumer staples, healthcare, and diversified industrials. The German portfolio is more cyclical, which explains the deeper drawdowns during global recessions.
Limitations
Cross-currency comparison. The DAX comparison is in Euros throughout, so it is currency-consistent. Where we reference the S&P 500 (in USD) for cross-market ranking, that figure blends stock selection with EUR/USD currency effects, so treat the cross-currency numbers as directional rather than exact.
Deeper drawdowns. The -38.73% max drawdown is among the deeper ones in our series. This strategy doesn't provide crisis protection on XETRA the way it does on BSE/NSE or US exchanges.
Smaller stock pool. The average of 20.6 stocks per period is lower than the mid-20s seen in most other markets. XETRA's qualifying universe is smaller, meaning less diversification and more concentration risk.
Survivorship bias. Exchange membership uses current profiles. German companies that delisted or were acquired aren't captured historically.
FY data lag. German fiscal years mostly end in December, with filings available by April-May. July rebalancing gives ample time, but some companies file later.
Transaction costs are estimated. XETRA has tight spreads for large-caps but wider spreads for mid-caps near the EUR 500M threshold. Actual trading costs may exceed the 0.1-0.5% estimates for less liquid names.
Takeaway
Rising dividend yield on XETRA produces a reliable 8.94% CAGR with +3.90% annual alpha vs the DAX and zero cash periods over 25 years. Germany's industrial economy is a natural fit for this signal. Companies in the chemical, engineering, and automotive sectors grow dividends consistently enough that the screen never fails to fill the portfolio.
The drawback is clear: -38.73% max drawdown. German stocks are globally correlated during crises, and dividend growers don't escape that correlation. The 2001-2002 and 2007-2008 periods show the portfolio tracking the broader market down.
The 56% win rate and zero cash periods make this a consistent strategy. You won't get India's explosive upside years or the US version's downside protection. What you get is a portfolio that's always invested, always finding qualifying stocks, and delivering modest but persistent alpha. For European-focused investors, that's a reasonable proposition.
Part of a Series
This analysis is part of our rising dividend yield global exchange comparison: - Rising Yield on US Stocks (NYSE + NASDAQ + AMEX) - 9.54% CAGR, the baseline - Rising Yield on Indian Stocks (BSE + NSE) - 13.44% CAGR, the standout performer - Rising Yield on Canadian Stocks (TSX) - 8.48% CAGR - Rising Yield on Japanese Stocks (JPX) - 8.94% CAGR, highest Sharpe - Rising Yield on UK Stocks (LSE) - 6.56% CAGR - Rising Yield: 15-Exchange Global Comparison - full comparison table
References
- Campbell, John Y., and Robert J. Shiller. "The Dividend-Price Ratio and Expectations of Future Dividends and Discount Factors." Review of Financial Studies 1, no. 3 (1988): 195-228.
- Cochrane, John H. "The Dog That Did Not Bark: A Defense of Return Predictability." Review of Financial Studies 21, no. 4 (2008): 1533-1575.
Run This Screen Yourself
All metrics used in this analysis (dividendYield, dividendPerShare, ROE, payout ratios) are queryable via SQL on Ceta Research. Filter by exchange (XETRA) and see what passes today.
The full backtest code (Python + DuckDB) is available in our GitHub repository.
Data: Ceta Research, FMP financial data warehouse. Universe: XETRA. Annual rebalance (July), equal weight top 30, 2000-2025. Returns in EUR unless noted.
Past performance does not guarantee future results. This is educational content, not investment advice.


