
Rising Dividend Yield on Japanese Stocks: Best Risk-Adjusted Returns of Any Market
Japan produced the highest Sharpe (0.43) and Sortino (1.168) of any market we tested the rising yield strategy on. 8.94% CAGR, +5.63% annual alpha vs Nikkei 225, a 72% win rate, with explosive individual years and early cash periods.

Japan produced the highest Sharpe ratio (0.43) and highest Sortino ratio (1.168) of any exchange we tested the rising yield strategy on. 8.94% CAGR over 25 years, with explosive individual years that topped +30% eight separate times and a 72% annual win rate against the Nikkei 225. The costs are four early cash periods and a -41.15% drawdown through 2007-2008. Japan rewards patience.
Contents
- Method
- The Screen (SQL)
- What We Found
- Highest Sharpe. Highest Sortino. Explosive upside with deep drawdowns.
- Year-by-Year Returns
- Key Observations
- 2000-2003: Four years of cash
- 2005-2006: The first eruption
- 2007-2008: The crash
- 2012-2016: Abenomics and the dividend revolution
- 2022: Late-cycle outperformance
- Currency Note
- Limitations
- Takeaway
- Part of a Series
- References
- Run This Screen Yourself
Data: FMP financial data warehouse, 2000–2025. Updated March 2026.
Method
Data source: Ceta Research (FMP financial data warehouse) Universe: JPX (Tokyo Stock Exchange), market cap > ¥50B (~$340M USD) Period: 2000-2025 (25 years, 25 annual periods) Rebalancing: Annual (July), equal weight top 30 by 2-year yield expansion Benchmark: Nikkei 225 (JPY, local benchmark) Cash rule: Hold cash if fewer than 10 stocks qualify Transaction costs: Size-tiered (0.1% for >$10B, 0.3% for $2-10B, 0.5% for <$2B, one-way) Returns: Denominated in JPY
For the full methodology and driver classification logic, see the US flagship post.
The Screen (SQL)
WITH yearly_yield AS (
    SELECT r.symbol, r.date,
        r.fiscalYear AS yr,
        r.dividendYield,
        r.dividendPerShare,
        r.dividendPayoutRatio,
        LAG(r.dividendYield, 1) OVER (PARTITION BY r.symbol ORDER BY r.fiscalYear) AS yield_1yr,
        LAG(r.dividendYield, 2) OVER (PARTITION BY r.symbol ORDER BY r.fiscalYear) AS yield_2yr,
        LAG(r.dividendPerShare, 1) OVER (PARTITION BY r.symbol ORDER BY r.fiscalYear) AS dps_1yr,
        LAG(r.dividendPerShare, 2) OVER (PARTITION BY r.symbol ORDER BY r.fiscalYear) AS dps_2yr
    FROM financial_ratios r
    WHERE r.period = 'FY' AND r.dividendYield > 0
),
screened AS (
    SELECT y.symbol, y.date, y.yr,
        y.dividendYield, y.dividendPerShare, y.dividendPayoutRatio,
        (y.dividendYield - y.yield_2yr) AS yield_change_2yr,
        CASE
            WHEN y.dividendPerShare > y.dps_1yr AND y.dps_1yr > y.dps_2yr THEN 'Consecutive DPS Growth'
            WHEN y.dividendPerShare > y.dps_1yr THEN 'Partial DPS Growth'
            ELSE 'Price Decline Driver'
        END AS yield_driver
    FROM yearly_yield y
    WHERE y.yield_2yr IS NOT NULL
      AND y.dividendYield > y.yield_1yr AND y.yield_1yr > y.yield_2yr
      AND y.dividendPerShare > y.dps_1yr
      AND y.dividendPayoutRatio > 0 AND y.dividendPayoutRatio < 0.75
    QUALIFY ROW_NUMBER() OVER (PARTITION BY y.symbol ORDER BY y.date DESC) = 1
)
SELECT s.symbol, p.companyName,
    ROUND(s.dividendYield * 100, 2) AS yield_pct,
    ROUND(s.yield_change_2yr * 100, 2) AS yield_expansion_2yr_pct,
    s.yield_driver,
    ROUND(s.dividendPayoutRatio * 100, 1) AS payout_pct,
    ROUND(k.returnOnEquityTTM * 100, 1) AS roe_pct,
    ROUND(k.marketCap / 1e9, 1) AS market_cap_b
FROM screened s
JOIN key_metrics_ttm k ON s.symbol = k.symbol
JOIN profile p ON s.symbol = p.symbol
WHERE k.returnOnEquityTTM > 0.10
  AND k.marketCap > 50e9  -- ¥50B
  AND p.exchange = 'JPX'
ORDER BY s.yield_change_2yr DESC
LIMIT 30
What We Found
Highest Sharpe. Highest Sortino. Explosive upside with deep drawdowns.
| Metric | Rising Yield (JPX) | Nikkei 225 |
|---|---|---|
| CAGR | 8.94% | 3.31% |
| Total Return | 751% | 126% |
| Volatility | 20.6% | 22.2% |
| Max Drawdown | -41.15% | -50.38% |
| Sharpe Ratio | 0.43 | 0.145 |
| Sortino Ratio | 1.168 | - |
| Win Rate (annual) | 72% | - |
| Avg Stocks per Period | 26.6 | - |
| Cash Periods | 4 of 25 | - |
| Invested Periods | 21 of 25 | - |
A 72% win rate paired with an 8.94% CAGR. The screen beat the Nikkei in roughly seven of every ten years, and its winning years were large. The Sortino ratio of 1.168 is the highest across all 15 exchanges we tested. That metric penalizes downside volatility only, so it's telling us Japan's upside moves are disproportionately large relative to its downside moves.
The Sharpe ratio (0.43) also leads all markets. Higher total volatility would normally drag risk-adjusted returns down, but the magnitude of winning years more than compensates.
Four cash periods (2000-2003) drag the CAGR. Without them, the invested-year returns are much higher. But we don't get to cherry-pick start dates.
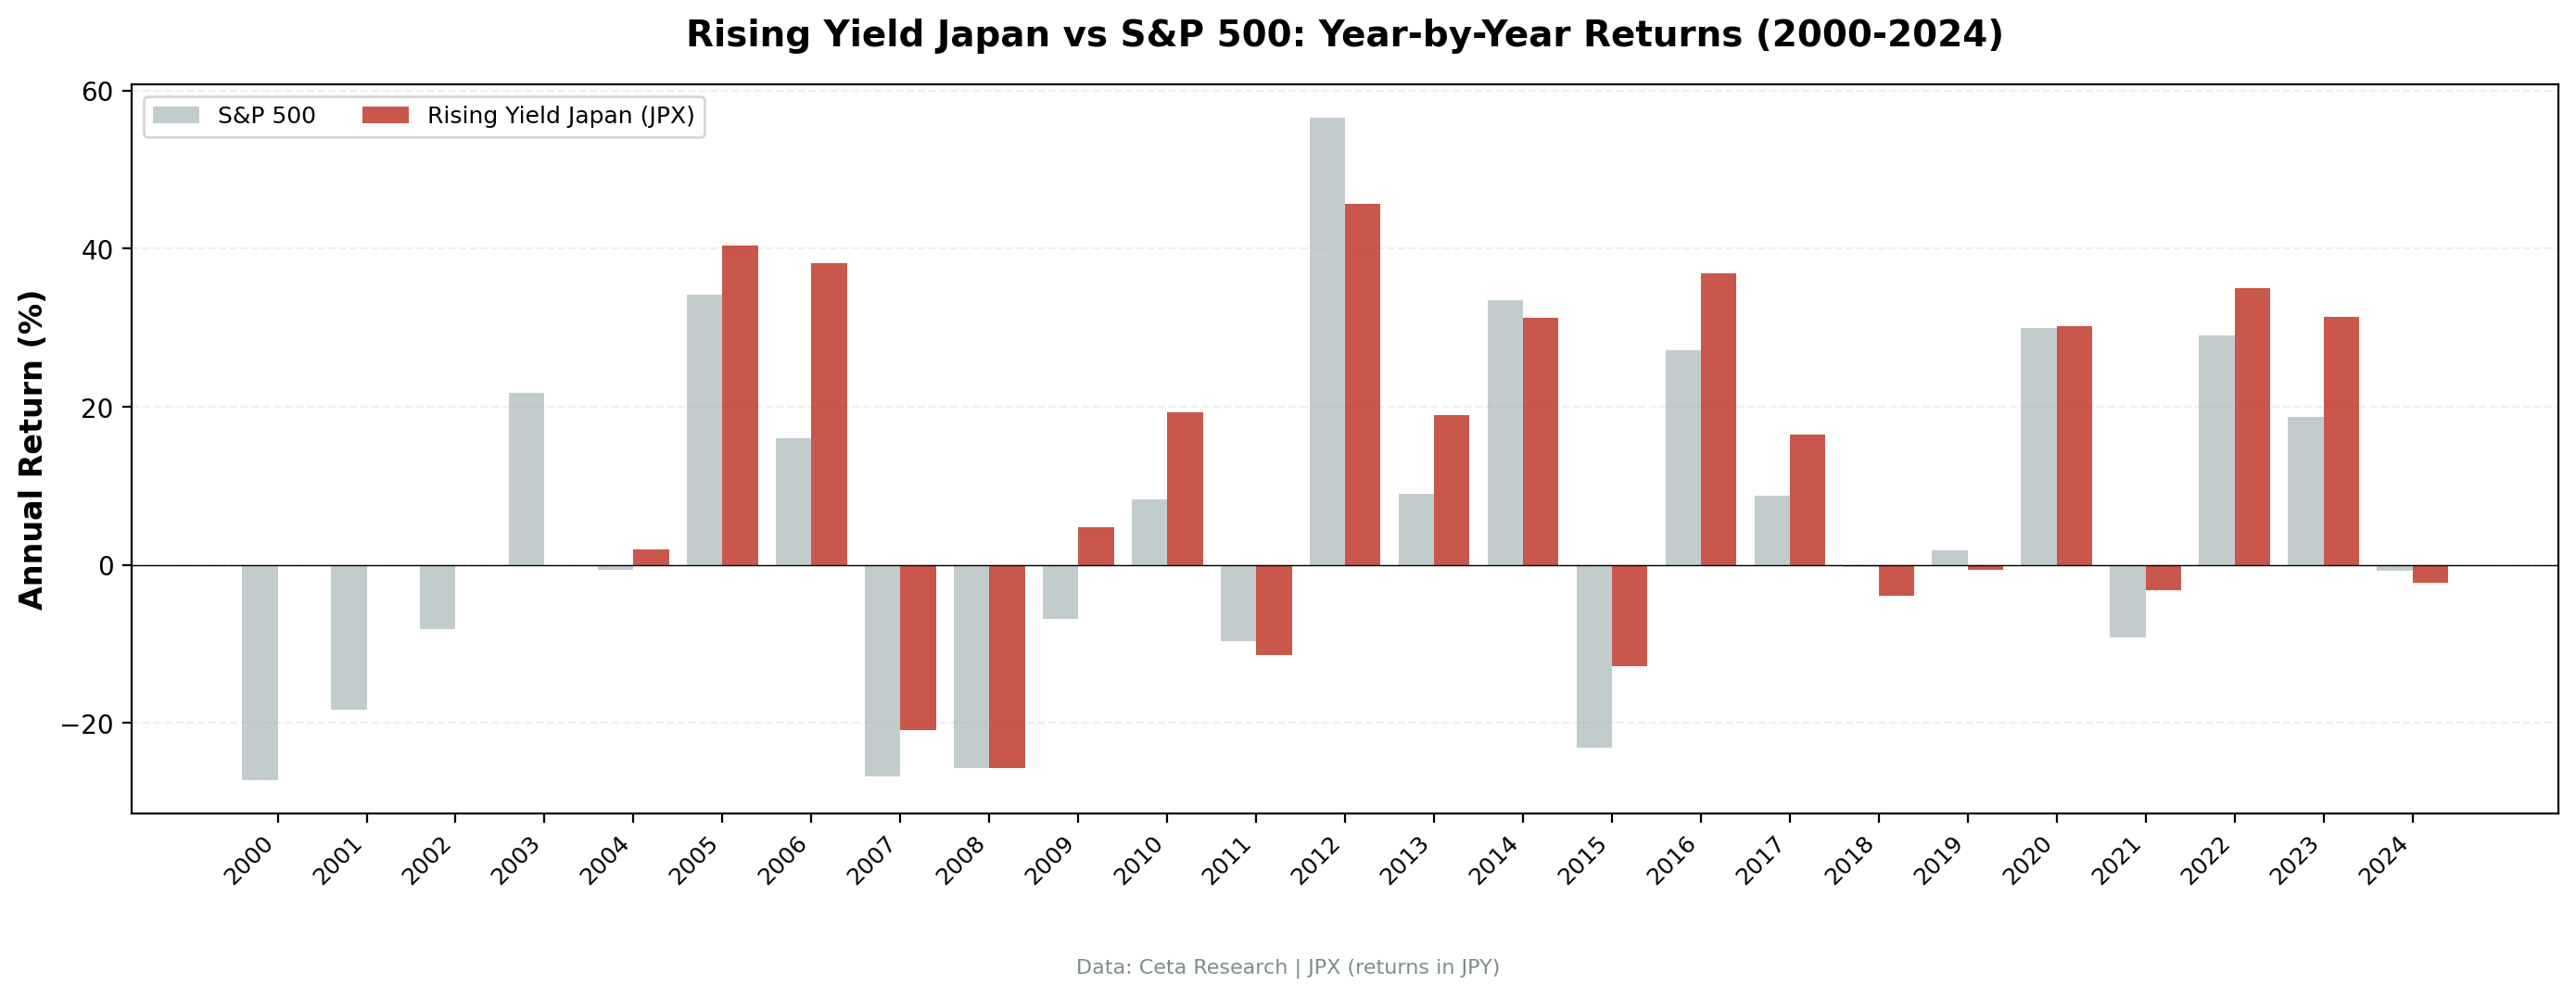
Year-by-Year Returns
| Year | Rising Yield (JPY) | Nikkei 225 | Excess |
|---|---|---|---|
| 2000 | 0.0% (cash) | -27.2% | +27.2% |
| 2001 | 0.0% (cash) | -18.3% | +18.3% |
| 2002 | 0.0% (cash) | -8.1% | +8.1% |
| 2003 | 0.0% (cash) | +21.8% | -21.8% |
| 2004 | +2.0% | -0.6% | +2.6% |
| 2005 | +40.4% | +34.2% | +6.2% |
| 2006 | +38.2% | +16.0% | +22.2% |
| 2007 | -20.8% | -26.8% | +5.9% |
| 2008 | -25.6% | -25.7% | +0.0% |
| 2009 | +4.8% | -6.8% | +11.6% |
| 2010 | +19.3% | +8.3% | +11.0% |
| 2011 | -11.4% | -9.7% | -1.8% |
| 2012 | +45.7% | +56.6% | -10.9% |
| 2013 | +18.9% | +9.0% | +9.9% |
| 2014 | +31.2% | +33.5% | -2.3% |
| 2015 | -12.8% | -23.1% | +10.3% |
| 2016 | +36.9% | +27.1% | +9.8% |
| 2017 | +16.5% | +8.8% | +7.7% |
| 2018 | -3.9% | -0.3% | -3.6% |
| 2019 | -0.6% | +1.8% | -2.4% |
| 2020 | +30.3% | +30.0% | +0.3% |
| 2021 | -3.2% | -9.1% | +5.9% |
| 2022 | +35.0% | +29.1% | +6.0% |
| 2023 | +31.4% | +18.7% | +12.6% |
| 2024 | -2.2% | -0.8% | -1.5% |
Key Observations
2000-2003: Four years of cash
Japan's dividend culture in 2000 was nothing like it is today. The "Lost Decade" had crushed corporate confidence. Few companies were raising dividends at all, let alone for three consecutive years. The screen found fewer than 10 qualifying stocks and held cash. This is the strategy working as designed. It won't invest when the signal isn't present.
2005-2006: The first eruption
+40.4% followed by +38.2%. Japan's economy stabilized in the mid-2000s, and a new cohort of companies began growing dividends. The screen caught them right at the inflection point. These weren't turnarounds. They were well-run companies (Toyota, Canon, KDDI-type names) whose dividend trajectories finally met the three-year rising yield requirement.
2007-2008: The crash
-20.8% in 2007, -25.6% in 2008. This is the deepest two-year drawdown in our series. Japan's export-dependent companies were hit hard by the Yen's appreciation and the global financial crisis. The max drawdown of -41.15% occurred during this period. Quality filters couldn't prevent it.
2012-2016: Abenomics and the dividend revolution
This five-year stretch is where Japan's structural change shows up in the data. Abenomics pushed Japanese corporations toward higher shareholder returns. The Tokyo Stock Exchange's corporate governance reforms explicitly encouraged dividend increases. The rising yield screen captured this policy-driven shift. Four of these five years produced double-digit returns. 2012 delivered +45.7%, 2014 delivered +31.2%, 2016 delivered +36.9%.
Japan went from a market where companies hoarded cash to one where they competed to grow dividends. The rising yield screen is a direct measure of that transition.
2022: Late-cycle outperformance
+35.0%. Japan's continued governance reforms, combined with a weaker Yen boosting exporter earnings, produced another surge in dividend growth. The screen kept finding new stocks because the corporate culture shift was still generating fresh three-year rising yield signals.
Currency Note
Returns are in Japanese Yen. JPY/USD moved from roughly 107 in 2000 to roughly 157 in 2024, a ~32% depreciation. That's about 1.5% annual drag for a USD-based investor.
Against the local Nikkei 225, the strategy delivered +5.63% annual excess return. Even after yen depreciation (~1.5% annual drag), the alpha vs local benchmark is substantial.
Rough currency adjustment:
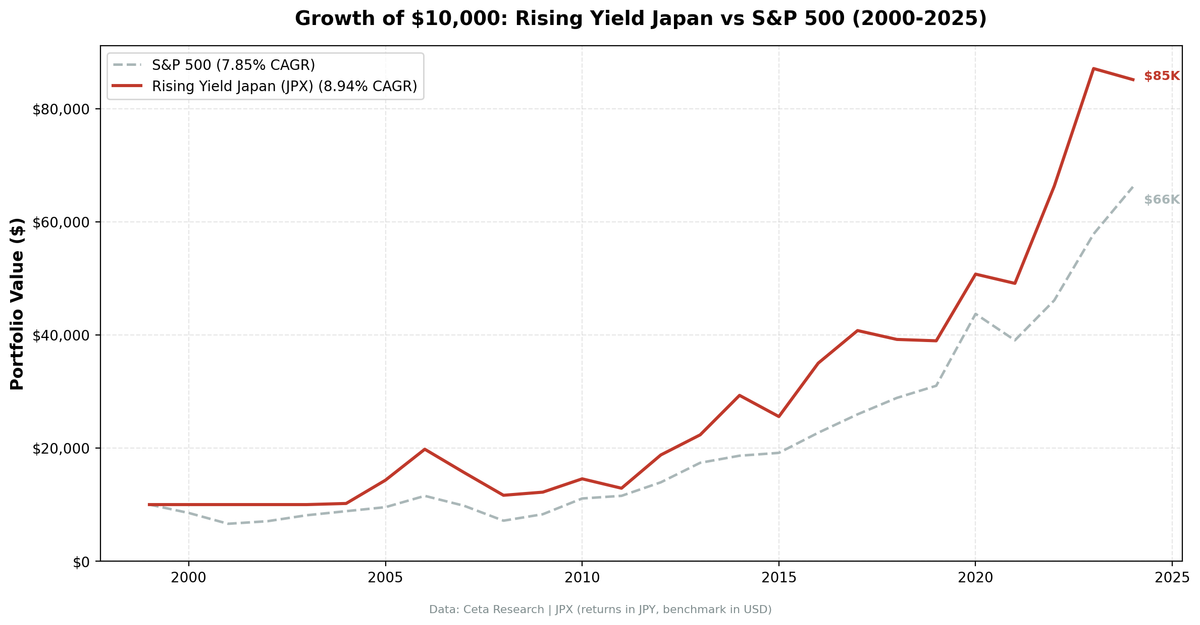
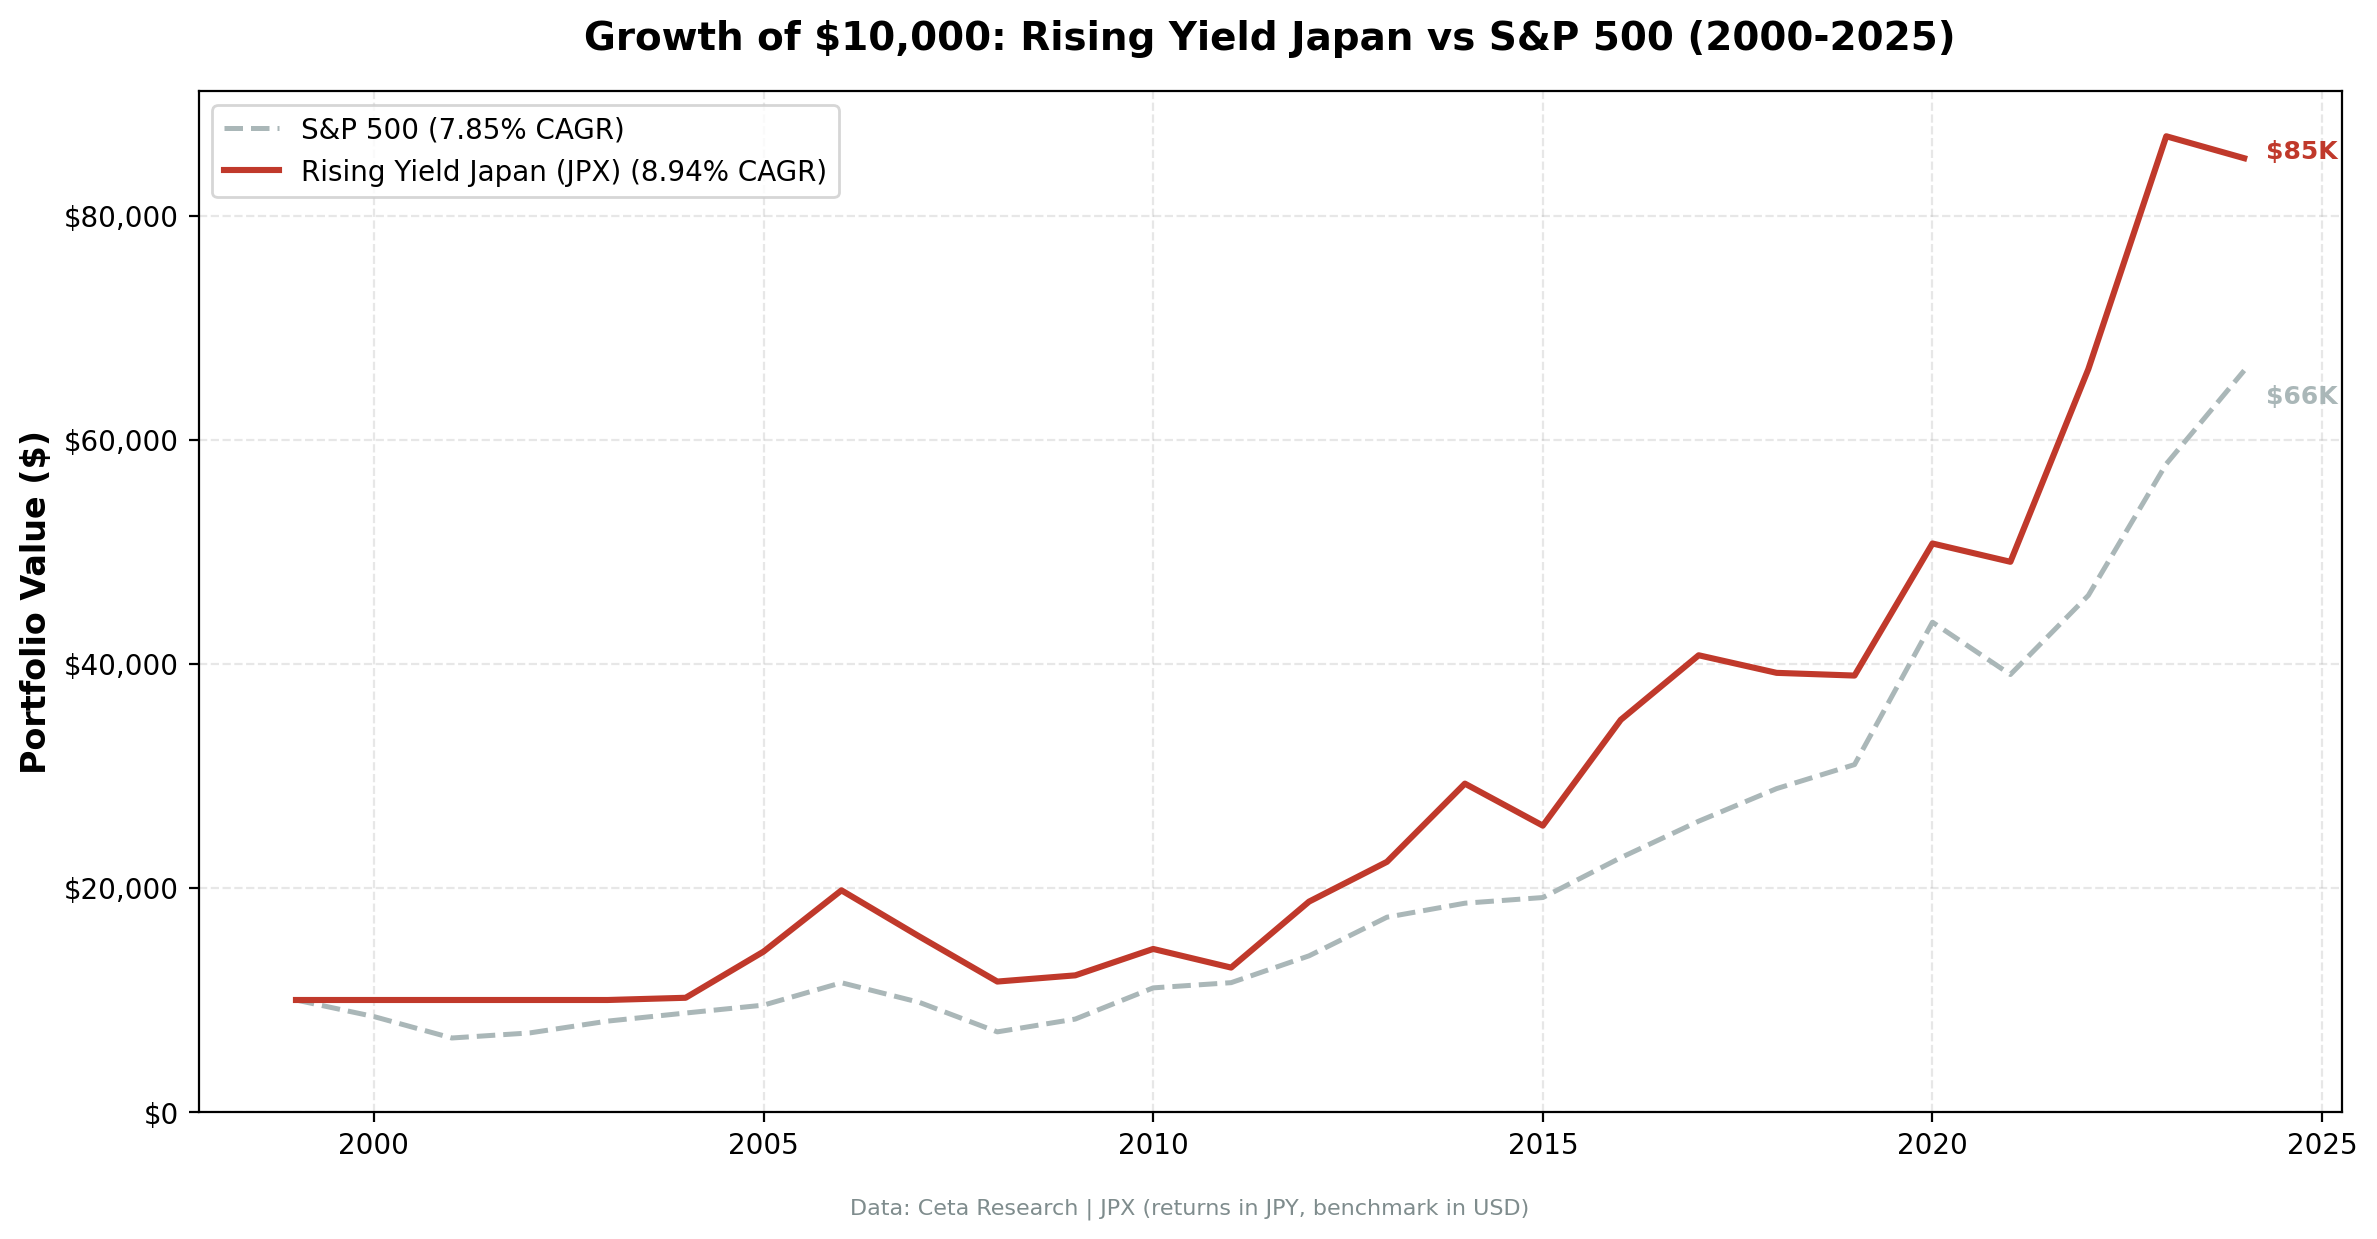
| Metric | JPX (JPY) | JPX (est. USD) | S&P 500 (USD) |
|---|---|---|---|
| CAGR | 8.94% | ~7.4% | 7.85% |
| Excess vs Nikkei | +5.63% | - | - |
For Japanese domestic investors, the +5.63% excess vs Nikkei 225 is the meaningful number. For foreign investors without a currency hedge, the yen drag reduces absolute returns, but the risk-adjusted story holds. The Sharpe and Sortino ratios measure return per unit of volatility in the local currency. Japan's 0.43 Sharpe and 1.168 Sortino are the best we found in any market.
Limitations
Local benchmark. The Nikkei 225 is the local benchmark, both in JPY. The +5.63% excess is meaningful for domestic investors. For foreign investors, yen depreciation reduces absolute returns by ~1.5% annually.
Cash drag. Four years of cash (2000-2003) reduce the CAGR. The invested-only CAGR is materially higher, but reporting it that way would be misleading.
Max drawdown severity. -41.15% is among the deeper drawdowns in our series. Quality filters don't prevent market-wide drawdowns in highly correlated markets.
Survivorship bias. Exchange membership uses current JPX listings. Delisted companies aren't captured, and Japan has had notable delistings over the past 25 years.
Fiscal year timing. Many Japanese companies have March fiscal year ends. The July rebalance gives four months of lag, which should be sufficient for filings, but some late reporters may create look-ahead issues.
Reform-dependent edge. Much of Japan's outperformance clusters in the post-Abenomics governance-reform era. If the corporate push toward higher shareholder returns stalls, the rising yield signal could weaken.
Takeaway
Japan is the best risk-adjusted market for the rising yield strategy. Sharpe of 0.43 and Sortino of 1.168 lead all 15 exchanges. The reason is structural: Japan went through a genuine corporate culture shift from cash hoarding to shareholder returns. The rising yield screen measures exactly that transition. Against the Nikkei 225, the strategy delivered +5.63% annual alpha over 25 years.
The costs are visible. Four cash years at the start, and a -41.15% max drawdown through 2007-2008. The 8.94% CAGR vs the Nikkei's 3.31% tells the core story: the screen captures the dividend revolution without requiring investors to accept the Nikkei's prolonged flat periods.
For investors with a long time horizon and exposure to the Japanese market, this screen captures the ongoing dividend revolution. For those who need consistency or can't tolerate deep drawdowns, Canada's zero-cash, lower-volatility version is a better fit.
Part of a Series
This analysis is part of our rising dividend yield global exchange comparison: - Rising Yield on US Stocks (NYSE + NASDAQ + AMEX) - 9.54% CAGR, the baseline - Rising Yield on Canadian Stocks (TSX) - 8.48% CAGR, zero cash periods - Rising Yield on UK Stocks (LSE) - 6.56% CAGR, +5.34% alpha vs FTSE 100 - Rising Yield: 15-Exchange Global Comparison - full comparison table
References
- Campbell, John Y., and Robert J. Shiller. "The Dividend-Price Ratio and Expectations of Future Dividends and Discount Factors." Review of Financial Studies 1, no. 3 (1988): 195-228.
- Cochrane, John H. "The Dog That Did Not Bark: A Defense of Return Predictability." Review of Financial Studies 21, no. 4 (2008): 1533-1575.
Run This Screen Yourself
All metrics used in this analysis (dividendYield, dividendPerShare, ROE, payout ratio) are queryable via SQL on Ceta Research. Filter by exchange (JPX) and see what passes today.
The full backtest code (Python + DuckDB) is available in our GitHub repository.
Data: Ceta Research, FMP financial data warehouse. Universe: JPX. Annual rebalance (July), equal weight top 30, 2000-2025. Returns in JPY.
Past performance does not guarantee future results. This is educational content, not investment advice.


