ai
Use Your Own AI with Financial Data
Three ways to use your existing AI subscription with Ceta Research: generate SQL queries, fetch data via API, or run and customize 85+ backtesting strategies.
Building CetaResearch. Data analysis for policy, research, and startups.
ai
Three ways to use your existing AI subscription with Ceta Research: generate SQL queries, fetch data via API, or run and customize 85+ backtesting strategies.
ai
Run and customize 85+ trading strategy backtests with your AI. Clone the open-source framework, modify strategies with natural language, or run on cloud compute via the Projects API.
ai
Use your AI to generate Python code that queries the Ceta Research API. Give it the endpoint docs, ask a question, run the code locally.
backtests
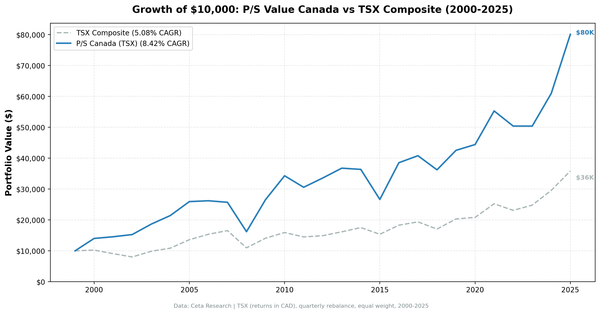
The Graham Number screen applied to Canadian stocks (TSX) returned 10.89% annually from 2000–2024, beating the TSX Composite by 6.46% per year. Down capture: 51.8%. Up capture: 159.5%. In years when the TSX fell, this portfolio fell only about half as much.
backtests
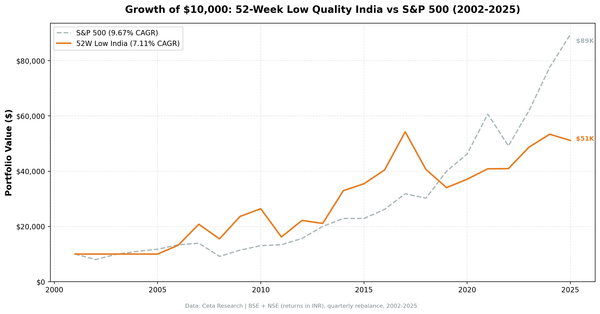
We tested 52-week low stocks filtered by Piotroski F-score on US markets from 2002 to 2025. The strategy returned 6.86% annually vs 9.67% for the S&P 500. Down-capture of 111.5% explains the gap.
value investing
We screened JSE-listed stocks for low price-to-sales ratios with qualifying margins and profitability, then backtested the resulting portfolio from 2000 to 2025. After data-quality fixes (removing price-oscillation artifacts and capping extreme single-period returns from bad adjusted-close data), the strategy returned 6.24% annually vs 8.02% for the S&
value investing
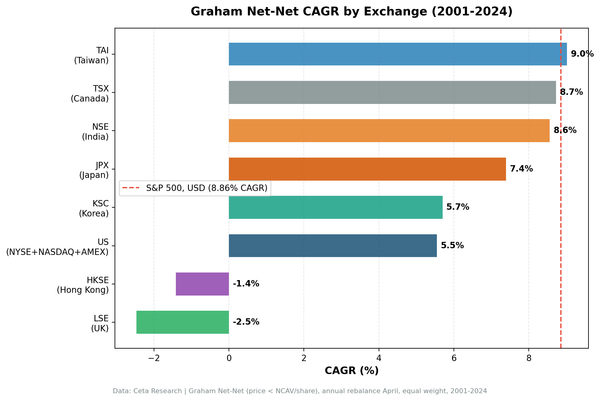
We backtested Graham's net-net strategy on Japan's JPX exchange from 2006 to 2024. Japan net-nets returned 7.39% CAGR vs 4.32% for the Nikkei 225, a +3.1% annual excess with 45% down capture. Japan is the major developed market where the net-net premium shows up most clearly in the data.
backtests
India produced the highest CAGR of any exchange in our 14-market sector momentum study: 26.95% annually over 26 years, +18.93% excess vs S&P 500, and 185.72% up capture. From $10,000 to ~$4.9M in INR-denominated terms. The max drawdown is severe at -63.87%, but the 26-year compound speaks for...
value investing
We screened NYSE, NASDAQ, and AMEX for D/E < 0.5 and Piotroski F-Score >= 7, then held the portfolio annually for 25 years. The result: 7.57% CAGR vs 7.85% for SPY, with max drawdown of -31.41% vs -38.01%. Lower return, but meaningfully better downside protection.
ai
Use your existing AI subscription to query 163 tables of financial data on Ceta Research. No API key, no setup. Copy the schema, paste into your AI, and ask questions in plain English.
momentum
We tested the 52-week high proximity strategy on Korean stocks (KSC) from 2000 to 2025. 12.07% CAGR, +7.26% vs KOSPI, 37.9% down capture. 2024 returned +25.1% when KOSPI fell 10.2%.
ROIC
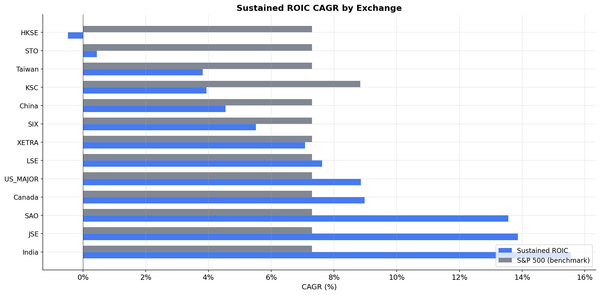
Sustained high ROIC on LSE stocks from 2000 to 2025. 7.62% CAGR vs 7.30% SPY. Borderline alpha (+0.32%), but the quality spread is real: sustained beats low ROIC by 2.74% annually. Down capture of 74.9%.