
52-Week Low Quality: 24-Year Germany Backtest (XETRA)

The same strategy, different market. On XETRA, the 52-Week Low Quality screen returned 7.13% annually over 23.8 years. The DAX returned 6.76% over the same period. That's +0.37% excess return vs the local benchmark, narrower than US-benchmarked results suggested but still positive.
Contents
- Method
- The Strategy
- What We Found
- Year-by-Year
- The Down-Capture Story
- Why Germany Works
- The Local Benchmark Advantage
- Run It Yourself
- Limitations
Sharpe ratio of 0.371. Down-capture of 35.4%. Max drawdown of -30.5%. Alpha of +2.9%.
Germany still produces the cleanest risk-adjusted result we tested for this strategy: lower drawdown than the DAX, lower volatility, modestly higher return. Japan now sits ahead on raw excess CAGR, but Germany remains the most defensive implementation.
Data: FMP financial data warehouse, 2000–2025. Updated May 2026 with next-day-close execution and data-quality guards.
Method
Data source: Ceta Research (FMP financial data warehouse) Universe: XETRA, market cap > €500M Period: 2002–2025 (23.8 years, 95 quarterly periods) Rebalancing: Quarterly (January/April/July/October), equal weight, up to 30 stocks Minimum to deploy: 5 qualifying stocks Benchmark: DAX (local currency) Cash rule: Hold cash if fewer than 5 stocks qualify Transaction costs: 0.1% per trade Filing lag: 45 days Execution: Next-day close (market-on-close)
Historical financial data with 45-day lag. Full methodology: backtests/METHODOLOGY.md
The Strategy
The screen is identical to the US version. Find stocks within 15% of their 52-week low, then apply the Piotroski F-score filter to remove genuinely deteriorating companies. A score of 7 or higher signals a company passing at least 7 of 9 fundamental health tests.
| Filter | Threshold |
|---|---|
| Price vs 52-week low | Within 15% |
| Piotroski F-score | ≥ 7 |
| Market cap | > €500M |
| Price | ≥ €1.00 |
The nine Piotroski tests cover profitability (positive earnings, positive cash flow, improving ROA, cash flow exceeding net income), leverage and liquidity (declining debt ratio, improving current ratio, no dilution), and operating efficiency (improving asset turnover, improving gross margin).
What We Found
| Metric | Portfolio | DAX |
|---|---|---|
| CAGR | 7.13% | 6.76% |
| Total Return | 413.55% | 372.58% |
| Max Drawdown | -30.5% | -51.25% |
| Volatility (ann.) | 13.83% | 21.82% |
| Sharpe Ratio | 0.371 | 0.218 |
| Sortino Ratio | 0.589 | |
| Calmar Ratio | 0.234 | |
| Beta | 0.469 | 1.00 |
| Alpha | +2.9% | |
| Up Capture | 57.18% | |
| Down Capture | 35.4% | |
| Win Rate (vs DAX) | 43.16% | |
| Cash Periods | 2/95 | |
| Avg Stocks | 23.9 |
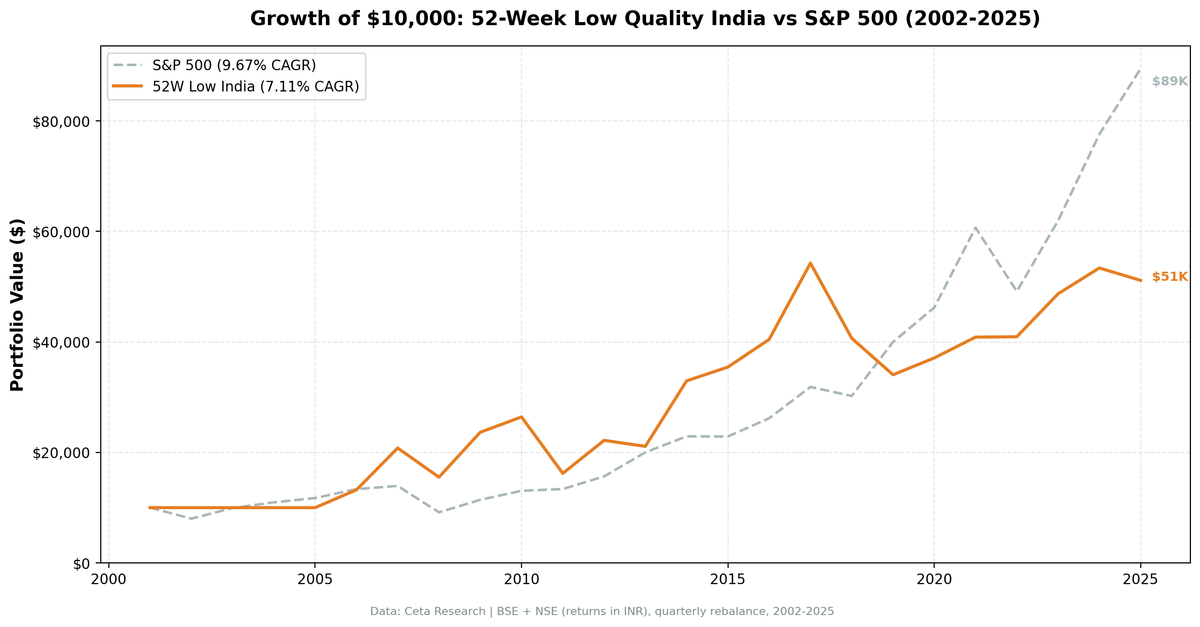
$10,000 invested in January 2002 grew to $51,355 in the portfolio. The same amount in the DAX: $47,258.
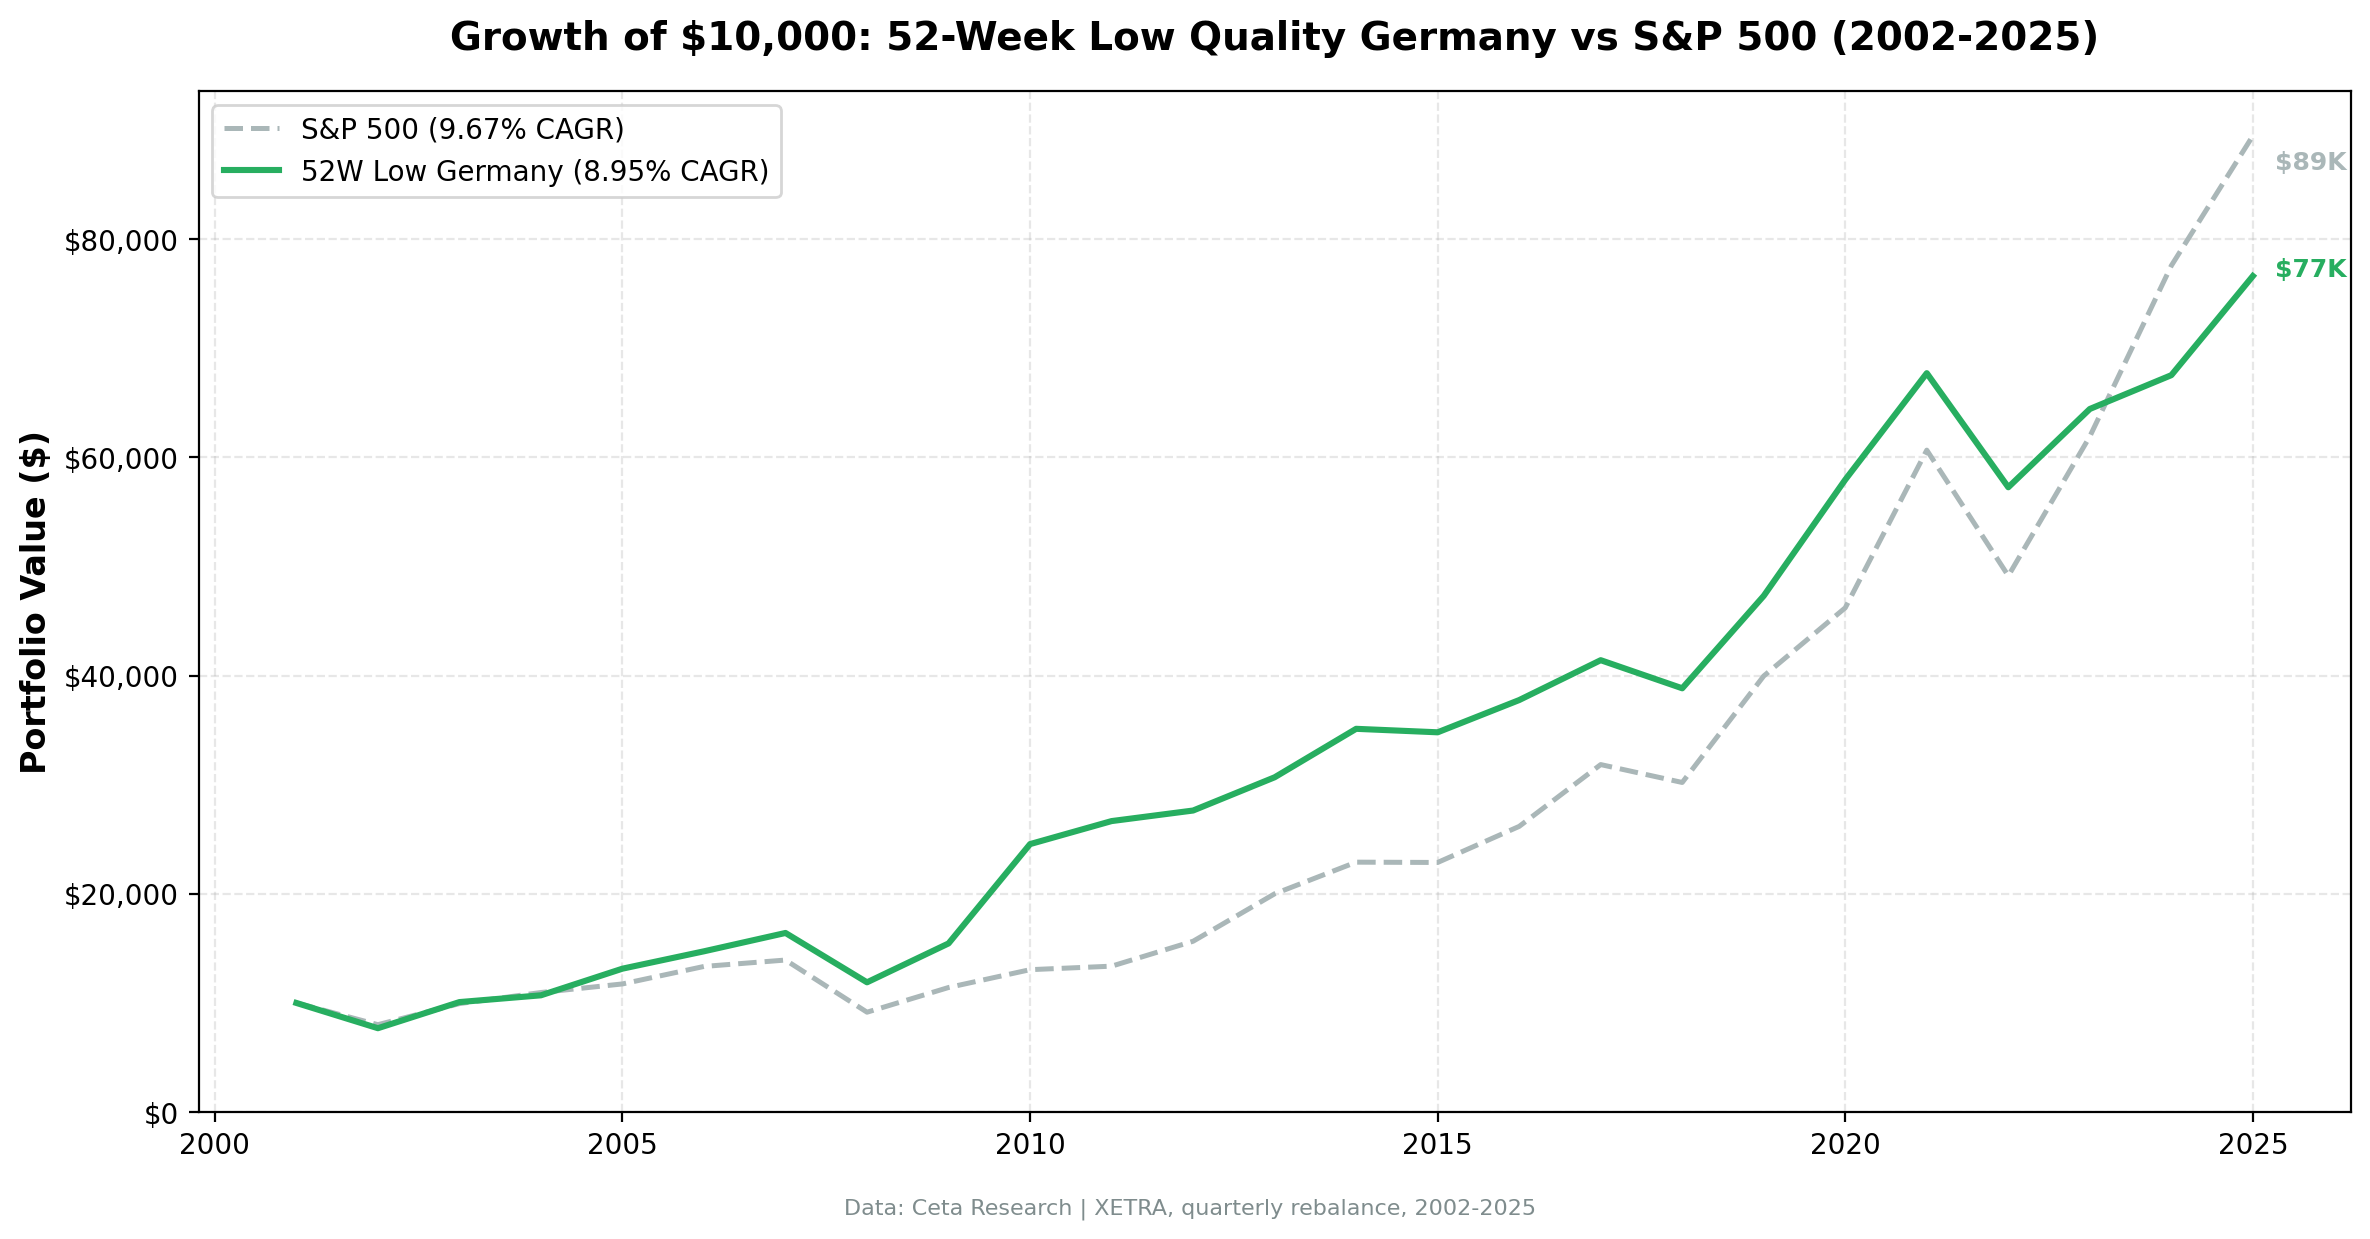
The Sharpe ratio of 0.371 is roughly 1.7x the DAX's 0.218. Lower volatility (13.83% vs 21.82%), shallower drawdown (-30.5% vs -51.25%), positive alpha (+2.9%). This strategy outperforms the DAX on every risk-adjusted metric, though the raw return edge is thinner than earlier (uncorrected) backtests showed.
The win rate of 43.16% deserves attention. The strategy beats the DAX in fewer than half the quarters, but when markets fall, this portfolio falls dramatically less. Down-capture of 35.4% means the typical down year for the DAX translates to roughly a third of that loss in this portfolio. That asymmetry is what builds long-term wealth.
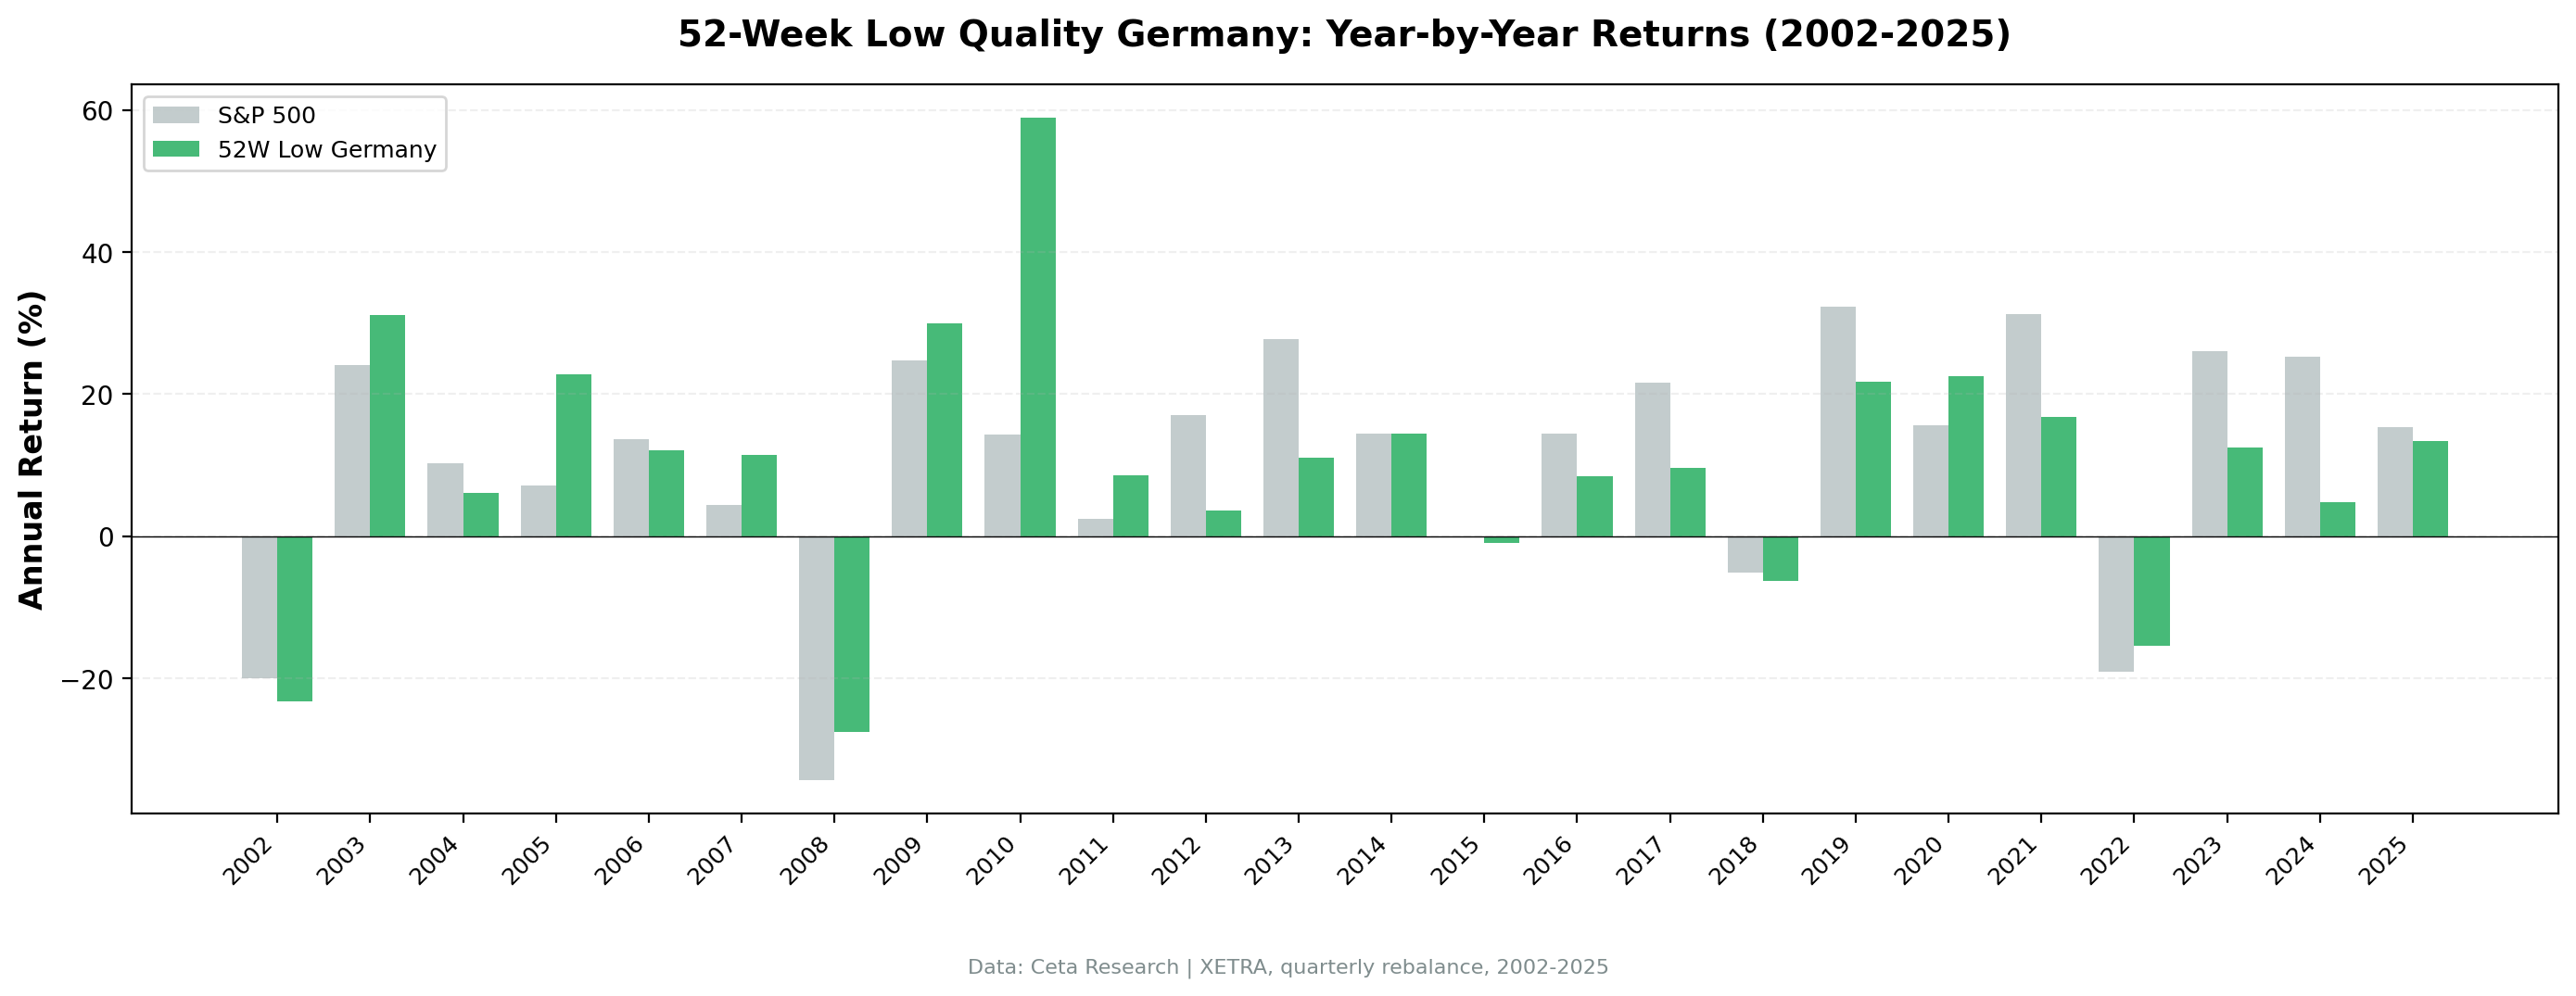
Year-by-Year
| Year | Portfolio | DAX | Excess |
|---|---|---|---|
| 2002 | -16.79% | -39.92% | +23.12% |
| 2003 | +13.18% | +29.42% | -16.23% |
| 2004 | +7.06% | +6.79% | +0.27% |
| 2005 | +11.08% | +26.99% | -15.91% |
| 2006 | +11.03% | +22.59% | -11.56% |
| 2007 | -7.40% | +18.98% | -26.38% |
| 2008 | -24.34% | -37.44% | +13.10% |
| 2009 | +31.36% | +21.62% | +9.74% |
| 2010 | +61.04% | +15.57% | +45.47% |
| 2011 | +2.59% | -13.08% | +15.67% |
| 2012 | +9.45% | +28.03% | -18.58% |
| 2013 | +8.47% | +20.84% | -12.37% |
| 2014 | +15.72% | +3.88% | +11.84% |
| 2015 | +0.35% | +5.31% | -4.96% |
| 2016 | +12.23% | +12.79% | -0.55% |
| 2017 | +2.88% | +10.98% | -8.09% |
| 2018 | -9.54% | -17.80% | +8.26% |
| 2019 | +20.63% | +26.52% | -5.89% |
| 2020 | +19.33% | +2.55% | +16.79% |
| 2021 | +15.38% | +16.71% | -1.33% |
| 2022 | -13.48% | -12.18% | -1.30% |
| 2023 | +10.51% | +19.19% | -8.68% |
| 2024 | +2.36% | +19.41% | -17.05% |
| 2025 | +16.01% | +21.96% | -5.95% |
The Down-Capture Story
The headline number from this backtest is 35.4% down-capture. When the DAX had a losing year, this XETRA portfolio absorbed roughly a third of the benchmark's losses.
The clearest examples:
2002 (Post-dot-com): DAX -39.92%. XETRA portfolio -16.79%. A +23.12% edge. The quality filter avoided the worst of the German tech and telecom blowups.
2008 (Global Financial Crisis): DAX -37.44%. XETRA portfolio -24.34%. A +13.10% edge in the worst market environment of the past two decades.
2011 (European Sovereign Debt): DAX -13.08%. XETRA portfolio +2.59%. A +15.67% edge. The strategy was fully invested in beaten-down German industrials that held up while the broader index sold off on eurozone contagion fears.
2018 (Trade War): DAX -17.80%. XETRA portfolio -9.54%. A +8.26% edge. Quality industrials at depressed prices recovered while growth-sensitive names kept falling.
The pattern is consistent: in major down years for the DAX, this portfolio lost substantially less.
Why Germany Works
The XETRA market has a structural composition that suits this strategy well.
German listed companies skew toward industrial manufacturers, specialty chemicals, automotive suppliers, and export-oriented Mittelstand businesses. These aren't high-multiple growth stocks. They trade on earnings and book value. Their P/E cycles follow industrial demand cycles, not narrative expansion.
When one of these companies hits a 52-week low, it's typically for a concrete reason: a weak export quarter, a margin miss, commodity cost pressure, a bad year in auto production. If the Piotroski score remains 7+, the underlying business is still operationally sound. The stock is pricing in a continuation of the headwind that may not materialize.
That's mean reversion in a market where it isn't arbitraged away as quickly. Germany doesn't have the same density of quant funds scanning for the same signal that US markets do. The reversion takes longer, but it happens.
Beta of 0.469 reflects this independence. XETRA quality near-low stocks move at less than half the rate of the DAX. The lower correlation translates into the 35.4% down-capture that defines the strategy's risk profile.
The Local Benchmark Advantage
With the DAX as benchmark, this strategy's value becomes clear. The DAX returned 6.76% annually over 2002-2025 with a max drawdown of -51.25%. This portfolio returned 7.13% with a max drawdown of -30.5%. You got modestly higher returns with about 21 percentage points less drawdown. That's the kind of risk-adjusted outperformance that compounds into real wealth differences over decades.
Run It Yourself
The live screen finds current XETRA stocks within 15% of their 52-week low with Piotroski F-score ≥ 7.
WITH
inc AS (
    SELECT symbol, netIncome, grossProfit, revenue,
           ROW_NUMBER() OVER (PARTITION BY symbol ORDER BY dateEpoch DESC) AS rn
    FROM income_statement WHERE period = 'FY' AND netIncome IS NOT NULL
),
bal AS (
    SELECT symbol, totalAssets, totalCurrentAssets, totalCurrentLiabilities,
           longTermDebt, totalStockholdersEquity,
           ROW_NUMBER() OVER (PARTITION BY symbol ORDER BY dateEpoch DESC) AS rn
    FROM balance_sheet WHERE period = 'FY' AND totalAssets > 0
),
cf AS (
    SELECT symbol, operatingCashFlow,
           ROW_NUMBER() OVER (PARTITION BY symbol ORDER BY dateEpoch DESC) AS rn
    FROM cash_flow_statement WHERE period = 'FY' AND operatingCashFlow IS NOT NULL
),
piotroski AS (
    SELECT ic.symbol,
        CASE WHEN ic.netIncome > 0 THEN 1 ELSE 0 END
        + CASE WHEN cfc.operatingCashFlow > 0 THEN 1 ELSE 0 END
        + CASE WHEN (ic.netIncome/bc.totalAssets) > (ip.netIncome/bp.totalAssets) THEN 1 ELSE 0 END
        + CASE WHEN cfc.operatingCashFlow/bc.totalAssets > ic.netIncome/bc.totalAssets THEN 1 ELSE 0 END
        + CASE WHEN (COALESCE(bc.longTermDebt,0)/bc.totalAssets) < (COALESCE(bp.longTermDebt,0)/bp.totalAssets) THEN 1 ELSE 0 END
        + CASE WHEN (bc.totalCurrentAssets/bc.totalCurrentLiabilities) > (bp.totalCurrentAssets/bp.totalCurrentLiabilities) THEN 1 ELSE 0 END
        + CASE WHEN bc.totalStockholdersEquity >= bp.totalStockholdersEquity THEN 1 ELSE 0 END
        + CASE WHEN (ic.revenue/bc.totalAssets) > (ip.revenue/bp.totalAssets) THEN 1 ELSE 0 END
        + CASE WHEN (ic.grossProfit/ic.revenue) > (ip.grossProfit/ip.revenue) THEN 1 ELSE 0 END
        AS f_score
    FROM (SELECT * FROM inc WHERE rn=1) ic
    JOIN (SELECT * FROM inc WHERE rn=2) ip ON ic.symbol = ip.symbol
    JOIN (SELECT * FROM bal WHERE rn=1) bc ON ic.symbol = bc.symbol
    JOIN (SELECT * FROM bal WHERE rn=2) bp ON ic.symbol = bp.symbol
    JOIN (SELECT * FROM cf WHERE rn=1) cfc ON ic.symbol = cfc.symbol
),
prices_52w AS (
    SELECT symbol,
           LAST_VALUE(adjClose) OVER (PARTITION BY symbol ORDER BY dateEpoch ROWS BETWEEN UNBOUNDED PRECEDING AND UNBOUNDED FOLLOWING) AS current_price,
           MIN(adjClose) OVER (PARTITION BY symbol) AS low_52w
    FROM stock_eod
    WHERE CAST(date AS DATE) >= CURRENT_DATE - INTERVAL '365 days' AND adjClose > 0
)
SELECT pio.symbol, p.companyName, p.sector,
       pio.f_score,
       ROUND(ps.current_price, 2) AS current_price,
       ROUND(ps.low_52w, 2) AS low_52w,
       ROUND((ps.current_price - ps.low_52w)/ps.low_52w * 100, 1) AS pct_above_low,
       ROUND(k.marketCap/1e9, 2) AS mktcap_b
FROM piotroski pio
JOIN profile p ON pio.symbol = p.symbol
JOIN (SELECT symbol, MAX(current_price) AS current_price, MIN(low_52w) AS low_52w FROM prices_52w GROUP BY symbol) ps ON pio.symbol = ps.symbol
JOIN key_metrics_ttm k ON pio.symbol = k.symbol
WHERE p.exchange = 'XETRA'
  AND k.marketCap > 500000000
  AND pio.f_score >= 7
  AND (ps.current_price - ps.low_52w)/ps.low_52w <= 0.15
  AND ps.current_price >= 1.0
ORDER BY (ps.current_price - ps.low_52w)/ps.low_52w ASC
LIMIT 30
To reproduce the full backtest:
git clone https://github.com/ceta-research/backtests.git
cd backtests

# Germany backtest
python3 52-week-low/backtest.py --preset germany --output results.json --verbose

# Current screen
python3 52-week-low/screen.py --preset germany
Limitations
Only 2 cash periods in 95 quarters. The strategy was almost always fully deployed. That's generally positive, the XETRA universe had sufficient qualifying names, but it means the strategy couldn't raise cash defensively during periods of fundamental deterioration.
Recent underperformance. 2022-2024 saw the strategy lag the DAX by a combined -27.03%. The DAX's strong rally in 2023-2024 was driven by a few large caps (SAP, Siemens, Deutsche Telekom) that don't appear in 52-week-low screens.
Annual financials, quarterly rebalance. The Piotroski F-score uses annual filing data. A company that qualifies in January on the prior year's financials can be held for a full quarter even if the current-year trend has reversed. The 45-day lag prevents look-ahead bias but means the fundamentals data is inherently backward-looking.
Win rate of 43.16%. The strategy beats the DAX in fewer than half the quarters. Investors following this approach need the patience to accept sustained periods of underperformance, particularly in years dominated by large-cap DAX names. The return profile rewards holding through those periods.
Data: Ceta Research (FMP financial data warehouse), 2002-2025. Universe: XETRA. Returns in EUR. Benchmark: DAX. Full methodology: METHODOLOGY.md. Backtest code: backtests/52-week-low/. Past performance does not guarantee future results. This is educational content, not investment advice.


