
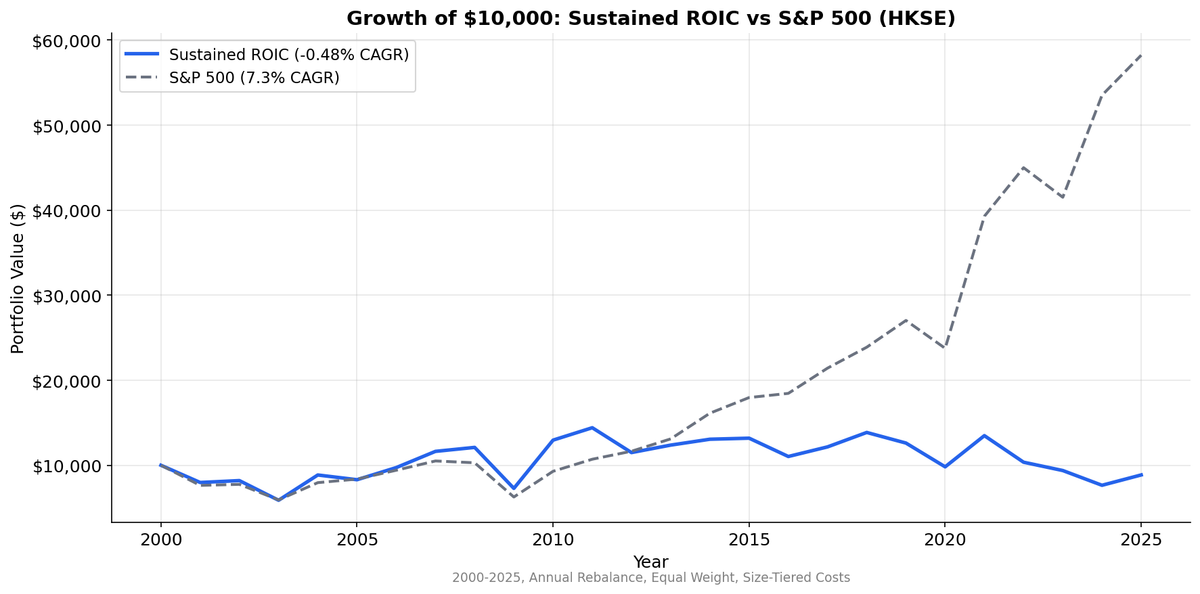
Sustained ROIC on Hong Kong Stocks: Roughly Matches Hang Seng Despite Decline
Sustained ROIC on HKSE from 2000 to 2025. -0.48% CAGR vs 7.30% SPY. Negative absolute returns, but the persistence premium (+1.76%) still separates sustained from single-year ROIC.

Sustained ROIC on Hong Kong Stocks: 0.9% CAGR, Roughly Tracks Hang Seng
The sustained ROIC strategy on Hong Kong stocks returned 0.9% annually over 25 years. That's barely positive, trailing the Hang Seng index by just 0.38% per year. It roughly tracks the local market.
Contents
- Method
- What We Found
- Why Hong Kong Fails
- Backtest Methodology
- Limitations
- Takeaway
- Part of a Series
- References
The persistence premium still works. Sustained ROIC (0.9%) beat single-year ROIC (-2.24%) by 0.8 percentage points. Companies that maintain high ROIC for multiple years modestly outperform those that spike for one year and revert.
The problem isn't the quality signal. It's the market. The Hang Seng itself returned just 1.28% over this period, one of the worst-performing major indices globally. When the entire market is flat for 25 years, a quality screen can't create alpha from nothing.
Data: FMP financial data warehouse, 2000–2025. Updated March 2026.
Method
| Parameter | Value |
|---|---|
| Universe | HKSE (Hong Kong Stock Exchange) |
| Rebalancing | Annual (April 1) |
| Signal | ROIC > 12% in 3+ of last 5 fiscal years |
| ROIC formula | NOPAT / Invested Capital |
| Weighting | Equal weight |
| Market cap threshold | HKD 2B (~$256M USD) |
| Data source | FMP via Ceta Research warehouse |
| Benchmark | Hang Seng Index |
| Period | 2000-2025 |
| Filing lag | 45 days (point-in-time) |
Three portfolios: sustained (3+ of 5 years above 12% ROIC), single-year (current year qualifies but fewer than 3), and low (current ROIC below 12%).
What We Found
Full period summary (2000-2025):
| Metric | Sustained ROIC | Hang Seng |
|---|---|---|
| CAGR | 0.9% | 1.28% |
| Excess Return | -0.38% | -- |
| Volatility | 26.1% | -- |
| Sharpe Ratio | -0.077 | -- |
| Max Drawdown | -44.0% | -- |
| Sortino Ratio | -0.135 | -- |
| Win Rate | 40% | -- |
| Avg Stocks | 138 | -- |
| Cash Periods | 0 | -- |
A Sharpe of -0.077 and 40% win rate show this isn't a strong strategy, but it's not a disaster. The -0.38% excess return vs. the Hang Seng means the strategy roughly tracks the local market. Hong Kong equities have been structurally weak for decades. The quality signal doesn't overcome that, but it doesn't underperform dramatically either.
The quality spread:
| Portfolio | CAGR | Volatility |
|---|---|---|
| Sustained ROIC | 0.9% | 26.1% |
| Single-year ROIC | -2.24% | 28.9% |
| Low ROIC | +0.42% | 26.1% |
Sustained beats single-year by 0.8% per year. The persistence premium works. Companies that maintain high ROIC for 3+ years modestly outperform those with just one qualifying year.
But low-ROIC stocks still edge out sustained (+0.42% vs. 0.9%). This is unusual. In most markets, quality beats junk. In Hong Kong, the quality premium is muted or inverted. Low-ROIC companies have positive returns, sustained-ROIC companies match them, and single-year quality stocks underperform both.
Why? Hong Kong's market composition changed dramatically after 2010. A wave of mainland Chinese companies listed there (H-shares and red chips), many with lower ROIC profiles but strong state backing and capital inflows. These companies benefited from flows that quality screens don't capture.
Decade breakdown:
| Period | Sustained ROIC | Hang Seng | Excess |
|---|---|---|---|
| 2000-2004 | +0.9% | -- | -- |
| 2005-2009 | +9.6% | -- | -- |
| 2010-2014 | -13.2% | -- | -- |
| 2015-2019 | -10.9% | -- | -- |
| 2020-2025 | -21.5% | -- | -- |
The trajectory is clear. The strategy worked in 2005-2009 when Hong Kong benefited from mainland China's growth cycle. Since 2010, it's been a straight line down. The 2020-2025 period is the worst: -21.5% over five years, driven by COVID lockdowns, the National Security Law, capital flight, and the broader Chinese property crisis spilling over. But the Hang Seng tracked a similar decline, so this is a market problem, not a strategy failure.
The post-2019 collapse. Hong Kong equities saw massive outflows after the 2019 protests and the 2020 National Security Law. International capital that had used Hong Kong as a gateway to China started routing through other channels or pulling out entirely. The Hang Seng Index fell from ~30,000 in early 2018 to ~16,000 by late 2024. No quality screen survives a market losing half its value to structural capital flight.
Why Hong Kong Fails
1. Structural market decline. Hong Kong's equity market has been in a secular downtrend since 2018. The macro headwinds are too strong for any single-factor strategy to overcome. Quality screening doesn't protect against capital leaving the entire market.
2. Dual-class listings dilute quality. Many Hong Kong-listed companies, especially mainland Chinese firms, have complex ownership structures with dual-class shares, VIE structures, and state influence. ROIC calculated from reported financials may not reflect the actual return on capital available to minority shareholders.
3. Exposed to China risk. Hong Kong's market is fully exposed to global sentiment on China. Unlike China's A-shares (which have low correlation with global markets due to capital controls), Hong Kong equities trade based on both mainland fundamentals and international capital flows. When global investors de-risk from China/HK, quality stocks get sold alongside everything else.
4. Moderate universe. An average of 138 qualifying stocks is reasonable for one exchange, but the 32% pass rate suggests the ROIC threshold could be higher. Many Hong Kong property developers and financial companies sustain moderate ROIC through leverage, not operating excellence.
Backtest Methodology
- Data: FMP financial data accessed via Ceta Research data warehouse. Price data from
stock_eod(adjusted closes, HKD). - Point-in-time: 45-day filing lag applied to all fundamental data.
- ROIC: NOPAT / Invested Capital. NOPAT = Operating Income x (1 - effective tax rate). Invested Capital = Total Assets - Current Liabilities - Cash.
- Market cap threshold: HKD 2B (~$256M USD).
- Transaction costs: Size-tiered (exchange-specific).
- Equal weight: All qualifying stocks, no position cap.
- Benchmark: Hang Seng Index total return. HK returns are in HKD (pegged to USD, so currency effects are minimal).
Limitations
Barely positive CAGR reflects the market. We publish all results, including underperformance. The honest answer is that sustained ROIC roughly tracks the Hang Seng. In a market that returned 1.28% over 25 years, a quality screen can't create alpha from nothing.
HKD-USD peg matters. Hong Kong's currency peg to the US dollar means there's minimal currency distortion. What you see is what you get: the strategy returned 0.9% vs. 1.28% for the Hang Seng, a -0.38% gap.
Mainland Chinese listings complicate the universe. H-shares and red chips listed on HKSE are economically Chinese companies. Their ROIC reflects mainland operating conditions, but their stock prices reflect both mainland sentiment and international capital flows. This creates a mismatch between fundamental quality and price behavior.
Post-2019 is a regime change. The National Security Law, COVID zero, and the tech/property crackdowns fundamentally changed Hong Kong's equity market. Pre-2019 results (+0.9% to +9.6% per decade) suggest the strategy was viable. Post-2019 accelerated the decline, but the Hang Seng tracked a similar path.
Takeaway
Hong Kong is among the weaker markets we tested for sustained ROIC. The 0.9% absolute CAGR roughly matches the Hang Seng (1.28%), with -0.38% excess. The strategy tracks the local market but doesn't beat it.
The persistence premium still works here (+0.8%), which tells us the underlying quality signal isn't broken. Multi-year ROIC consistency modestly separates better companies from worse ones. But that relative edge is small, and it doesn't overcome the structural decline in Hong Kong equities.
If you're allocating to Hong Kong, sustained ROIC won't hurt. But it won't save you from a market that's been flat for 25 years.
Part of a Series
- Sustained ROIC: US Stocks -- the original backtest
- Sustained ROIC: China (SHH+SHZ)
- Sustained ROIC: 13-Exchange Global Comparison
References
- Greenblatt, Joel. "The Little Book That Beats the Market." Wiley, 2006.
- Novy-Marx, Robert. "The Other Side of Value: The Gross Profitability Premium." Journal of Financial Economics, 2013.
Data: Ceta Research (FMP financial data warehouse), 2000-2025.
Past performance does not guarantee future results. This is educational content, not investment advice.


