
Graham Number in Brazil: 14.04% Nominal CAGR, With Two Layers of Fine Print
The Graham Number strategy returned 14.04% CAGR on Brazil's B3 from 2000–2024 vs 8.44% for the Bovespa, a +5.60% annual excess. All in BRL, where inflation ran 6–8% annually. Plus a known FMP data quality caveat on SAO adjusted-close prices. Here's the honest account.

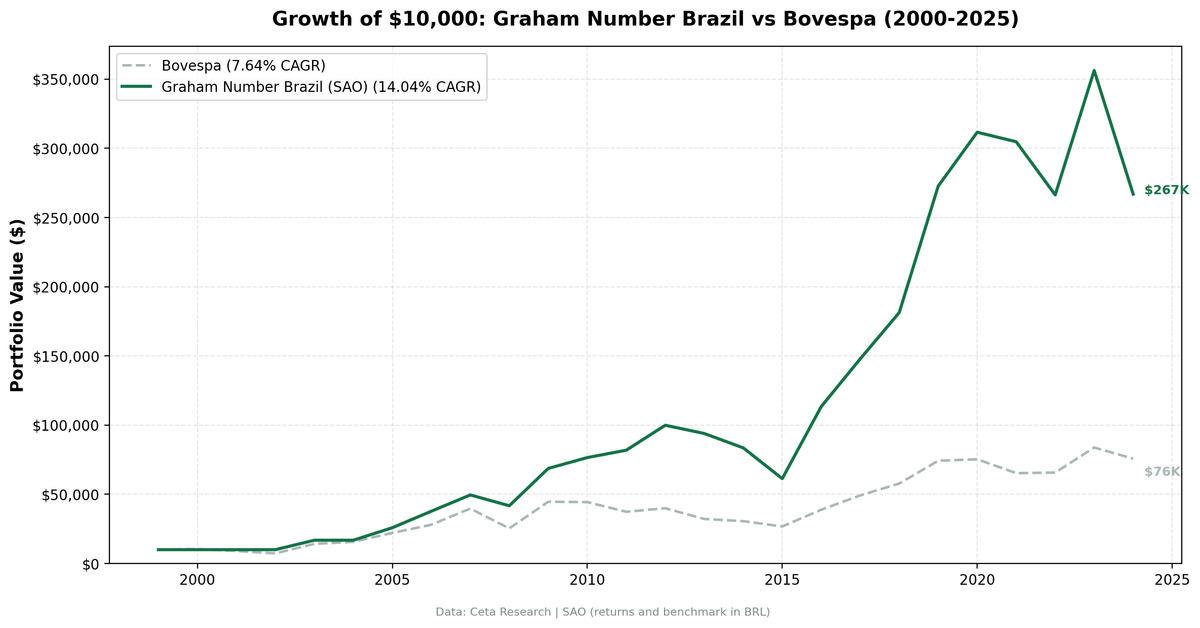
The Graham Number strategy returned 14.04% annually on Brazil's B3 exchange from 2000 to 2024. In BRL. That distinction matters, and so does the data quality caveat below.
Contents
- Method
- What We Found
- Year by Year
- The Early Years: Cash During the Data Gap
- The Commodity Decade: When Brazil Ran Hot
- The Crisis: Where the Strategy Proved Its Worth
- Political and Macro Turbulence: The 2010s
- The Modern Era
- Reading Brazil's Numbers Honestly
- The Selic Rate Context
- The Sharpe Is Modest
- Currency Risk for USD-Based Investors
- Run It Yourself
- Part of a Series
Brazil's central bank benchmark rate (the Selic) averaged 12–15% annually over this period. Consumer price inflation ran 6–8% per year. A nominal 14.04% CAGR in BRL translates to roughly 5–8% in real terms depending on which inflation measure you use. The local-benchmark excess of +5.60% vs Bovespa is genuine. The exact CAGR should be treated as directional.
Data quality caveat: FMP's adjusted-close prices for Brazilian (SAO) stocks include split and consolidation adjustments that don't always propagate correctly. The framework's oscillation filter and 200% single-period return cap catch the worst artifacts, but residual data noise likely still adds 1-3 percentage points of inflation to the headline CAGR. The previous version of this analysis showed 18.37%; the current filters bring it to 14.04%. Treat these numbers as directional, not precise.
This is an honest account of what the strategy did across 25 years of Brazilian market cycles, with the data quality concerns surfaced.
Data: FMP financial data warehouse, 2000–2025. Updated May 2026.
Method
| Parameter | Detail |
|---|---|
| Exchange | B3 (São Paulo, SAO exchange code) |
| Period | 2000–2024 (25 annual rebalance periods) |
| Universe | All B3 stocks with qualifying fundamentals |
| Signal | P/E < 15 and P/B < 1.5 (equivalent to price below Graham Number) |
| Quality filters | ROE > 10%, D/E < 1.0 |
| Ranking | Deepest discount to Graham Number first |
| Portfolio size | Top 30 stocks, equal weight |
| Rebalancing | Annual (January), 45-day filing lag |
| Cash rule | Hold cash if fewer than 10 stocks qualify |
| Benchmark | Bovespa |
| Transaction costs | Size-tiered model (0.1%–0.5%) |
| Currency | All returns in BRL (Brazilian Real) |
Historical financial data with 45-day lag to prevent look-ahead bias. Full methodology: backtests/METHODOLOGY.md
What We Found
| Metric | Graham Brazil | Bovespa |
|---|---|---|
| CAGR | 14.04% | 8.44% |
| Total Return | 2,569.0% | 657.8% |
| Max Drawdown | -38.60% | -40.03% |
| Volatility (ann.) | 30.36% | 30.72% |
| Sharpe Ratio | 0.117 | -0.067 |
| Sortino Ratio | 0.245 | — |
| Calmar Ratio | 0.364 | — |
| Excess CAGR | +5.60% | — |
| Avg Stocks | 24.1 | — |
| Cash Periods | 4/25 | — |
The number that stands out isn't the CAGR. It's the excess over the Bovespa: +5.60% annually. In a market where the index itself returned 8.44%, beating it consistently through a simple value screen is significant. The strategy built a ~2,569% nominal total return over 25 years vs ~658% for Bovespa.
The Sharpe ratio of 0.117 is modest. Brazilian equity markets carry high nominal volatility (30.36%) partly because inflation is embedded in asset prices. The risk-adjusted returns are real but not exceptional by Sharpe standards. The strategy earns its keep through asymmetry, not smooth compounding.
Year by Year
The Early Years: Cash During the Data Gap
| Year | Graham Brazil (BRL) | Bovespa | Excess |
|---|---|---|---|
| 2000 | 0.00% (cash) | +4.7% | -4.7% |
| 2001 | 0.00% (cash) | -14.1% | +14.1% |
| 2002 | 0.00% (cash) | -18.7% | +18.7% |
| 2003 | +68.2% | +93.5% | -25.3% |
| 2004 | 0.00% (cash) | +10.7% | -10.7% |
The strategy held cash in 2000-2002 and again in 2004 because fewer than 10 stocks qualified. This is both a feature and a limitation: the screen kept capital out of a thin, early-data market, but those cash years contribute zero to the return stack while the index rallied or fell.
The Commodity Decade: When Brazil Ran Hot
2005 through 2007 was Brazil's commodity supercycle. Iron ore, soybeans, oil. B3 ran hard. The Graham Number screen caught the industrial and commodity companies that looked cheapest on fundamentals as prices ripped. The +53.7% in 2005 and +46.0% in 2006 (in BRL) were value investing meeting a commodity boom.
The Crisis: Where the Strategy Proved Its Worth
| Year | Graham Brazil (BRL) | Bovespa | Excess |
|---|---|---|---|
| 2008 | -15.8% | -36.0% | +20.2% |
| 2009 | +64.7% | +75.8% | -11.1% |
2008 is the clearest demonstration of the value floor. The Graham Brazil strategy fell only -15.8% while the Bovespa fell -36.0%, a +20.2% protective gap. The portfolio held undervalued, asset-heavy stocks that were less exposed to the financial sector leverage that drove the global crisis. The 2009 recovery lagged the Bovespa's massive snapback (+75.8%), with the portfolio up +64.7%.
Political and Macro Turbulence: The 2010s
| Year | Graham Brazil (BRL) | Bovespa | Excess |
|---|---|---|---|
| 2011 | +7.0% | -15.7% | +22.7% |
| 2013 | -6.0% | -19.5% | +13.5% |
| 2015 | -26.6% | -12.6% | -14.0% |
| 2016 | +84.9% | +45.2% | +39.7% |
| 2017 | +30.4% | +26.6% | +3.8% |
| 2018 | +22.6% | +17.4% | +5.2% |
| 2019 | +50.4% | +28.6% | +21.9% |
2015 was brutal. Brazil's political instability (the Dilma Rousseff government, the Lava Jato corruption investigation) combined with a commodity price collapse and recession. The strategy fell -26.6% in 2015 while the Bovespa fell -12.6%.
Then 2016 delivered +84.9% vs the Bovespa's +45.2%, a +39.7% excess. The Temer government stabilized the macro environment and commodity prices recovered. This extreme sequence tells you something important about Brazil: the macro regime swings are large, and the Graham Number screen amplifies them on the upside. 2019 showed the same pattern: +50.4% vs +28.6% for the Bovespa.
The Modern Era
| Year | Graham Brazil (BRL) | Bovespa | Excess |
|---|---|---|---|
| 2020 | +14.3% | +1.4% | +12.8% |
| 2021 | -2.2% | -13.3% | +11.1% |
| 2022 | -12.6% | +0.6% | -13.2% |
| 2023 | +33.7% | +27.5% | +6.2% |
| 2024 | -25.1% | -9.6% | -15.5% |
2024 was a difficult year. The strategy fell -25.1% in BRL. The BRL also depreciated sharply against the USD in 2024, which would compound losses for USD-based investors.
Reading Brazil's Numbers Honestly
The Selic Rate Context
The Selic rate, Brazil's central bank benchmark, averaged 12–15% over this period and has rarely fallen below 8%. When you earn 14.04% CAGR in a currency where the risk-free rate is ~12%, the excess return over cash is roughly 2%. That's a modest premium, before accounting for the equity volatility.
This matters for anyone benchmarking against Brazilian alternatives. A Brazilian investor holding Tesouro Direto (government bonds) would have earned roughly 12–14% annually with zero equity risk. The Graham Number strategy added a thin premium over that, while requiring tolerance for 30.36% annual volatility and a -38.60% max drawdown.
Against the Bovespa itself, the excess is cleaner: +5.60% per year. The index returned 8.44% annually, and the Graham Number screen beat it consistently. This is genuine stock-selection alpha in local-currency terms (with the data quality caveat noted at the top).
The Sharpe Is Modest
A Sharpe of 0.117 means the strategy earned only ~0.12 units of excess return per unit of volatility. That's well below what comparable strategies achieve in lower-rate markets. The reason is simple: 30.36% annual volatility is high, and Brazil's risk-free rate is also high. The strategy produces strong nominal returns partly by accepting that volatility.
If you're comparing Sharpe ratios across markets, note that a Sharpe of 0.117 in Brazil is not directly comparable to 0.459 in Sweden or 0.234 in the US. The risk-free rates and currency dynamics differ in kind.
Currency Risk for USD-Based Investors
All returns here are in BRL. The Brazilian Real has depreciated substantially against the USD over the 25-year period. In 2000, the BRL/USD rate was roughly 1.8. By 2024, it was above 5.5. A strategy returning 2,569% in BRL delivered substantially less in USD terms.
USD-based investors allocating to Brazil absorb that currency risk on top of the equity risk. The strategy's strong local-currency excess may be partially or fully offset by BRL depreciation. 2024 is a concrete example: -25.07% in BRL, plus BRL depreciation, produced a painful USD return.
Run It Yourself
-- Graham Number screen for Brazil (B3 / SAO exchange)
-- Point-in-time: use FY data with 45-day filing lag
-- Rank by deepest discount to Graham Number (lowest P/E first)
SELECT
    r.symbol,
    ROUND(r.priceToEarningsRatio, 2) AS pe,
    ROUND(r.priceToBookRatio, 2) AS pb,
    ROUND(m.returnOnEquity * 100, 1) AS roe_pct,
    ROUND(r.debtToEquityRatio, 2) AS de,
    ROUND(p.marketCap / 1e9, 1) AS mktcap_bn
FROM financial_ratios r
JOIN key_metrics m ON r.symbol = m.symbol
JOIN profile p ON r.symbol = p.symbol
WHERE p.exchange IN ('SAO')          -- B3 / São Paulo
  AND r.period = 'FY'
  AND r.priceToEarningsRatio > 0
  AND r.priceToEarningsRatio < 15   -- Graham P/E threshold
  AND r.priceToBookRatio > 0
  AND r.priceToBookRatio < 1.5      -- Graham P/B threshold
  AND m.returnOnEquity > 0.10       -- ROE > 10%
  AND r.debtToEquityRatio < 1.0     -- D/E < 1.0
  AND p.isFund = false
  AND p.isEtf = false
  AND p.isActivelyTrading = true
QUALIFY ROW_NUMBER() OVER (PARTITION BY p.companyName
                           ORDER BY p.averageVolume DESC) = 1
ORDER BY r.priceToEarningsRatio ASC
LIMIT 30;
Run Brazil Graham Number screen live →
To run the full backtest:
git clone https://github.com/ceta-research/backtests.git
cd backtests

# Brazil backtest
python3 graham-number/backtest.py --preset brazil --output results.json --verbose
Part of a Series
This is the Brazil analysis. We tested the same Graham Number strategy across multiple global markets:
- US analysis →: 25 years on US exchanges, the shrinking qualifying universe problem
- Japan analysis →: The market where Graham Number has the deepest qualifying pool
- Global comparison →: How results vary across 12 exchanges
Data: Ceta Research (FMP financial data warehouse), 2000–2024. Exchange: B3 (SAO). All returns in BRL (Brazilian Real). Benchmark: Bovespa. Selic rate context: Brazil's central bank benchmark averaged 12–15% annually over this period. Nominal returns should be interpreted relative to local inflation (avg 6–8%) and local risk-free rates. Full methodology: METHODOLOGY.md. Past performance does not guarantee future results. This is educational content, not investment advice.

