Graham Net-Net on 8 Global Markets: Three Beat Their Local Index
We ran Graham's net-net strategy on 8 global markets over 24 years with local benchmarks. Canada beat the TSX by +3.6% per year, Taiwan and Japan also outperformed. The UK lost 69% peak-to-trough. India badly trailed the Sensex. Here's the full cross-market comparison.

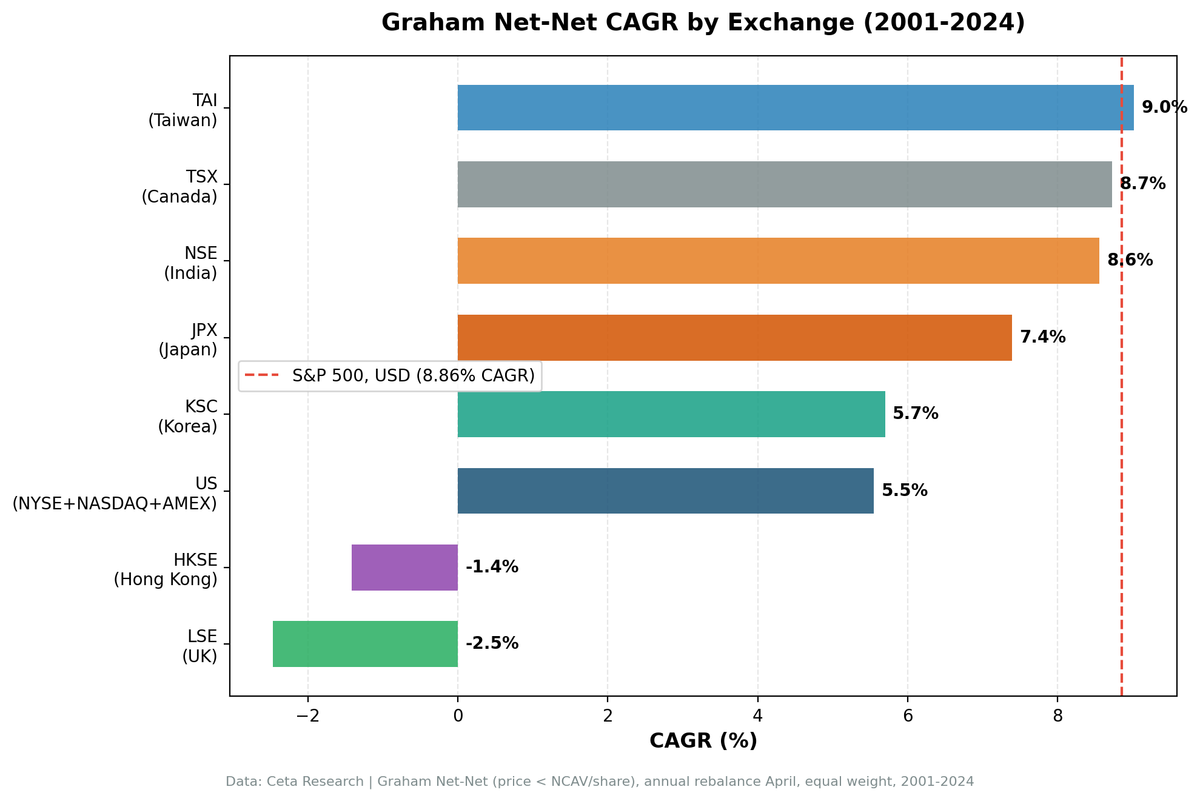
We ran Graham's net-net strategy, buying stocks trading below their net current asset value, across eight global markets over 24 years. Each exchange is benchmarked against its local index (Nikkei for Japan, Sensex for India, FTSE for UK, etc.) rather than the S&P 500. Canada, Taiwan, and Japan beat their local benchmarks. The other five don't, and the UK and Hong Kong lost money outright.
Contents
- The Strategy
- The Summary Table
- Japan: Why It Works
- United States: The Eroded Premium
- Hong Kong: The Cautionary Tale
- India: Strong Returns, Stronger Benchmark
- Canada: The Biggest Premium, With a High-Beta Catch
- Taiwan: Strong Numbers, Thin Universe
- Korea and the UK
- What to Take From This
- Excluded Markets
Here's the full cross-market breakdown with year-by-year data.
Data: FMP financial data warehouse, 2000–2025. Updated June 2026.
The Strategy
A net-net stock trades below its liquidation value. Specifically:
NCAV per share = Current Assets − Total Liabilities − Preferred Stock (per share)
If a stock's price is below this figure, you're theoretically buying the liquid assets at a discount before the business operations factor in at all. Graham called these "bargain issues": the margin of safety is in the balance sheet, not in earnings projections.
Backtest setup: - Annual rebalancing (April) - Equal weight all qualifying stocks - Hold cash if fewer than 5 qualify - 45-day lag on financial data (no look-ahead bias) - MOC execution (next-day close for entry/exit) - Market cap thresholds set per exchange to match net-net universe (all are small/micro-cap) - Benchmark: local currency index per exchange (Nikkei 225, Sensex, FTSE 100, etc.)
The Summary Table
Each exchange is benchmarked against its local currency index, the correct comparison for measuring alpha.
| Exchange | CAGR | Local Benchmark | Excess | Sharpe | MaxDD | Avg Stocks | Cash Periods |
|---|---|---|---|---|---|---|---|
| Canada (TSX) | 8.73% | TSX Comp 5.12% | +3.61% | 0.176 | -52.9% | 21.4 | 2/24 |
| Taiwan (TAI+TWO)** | 9.02% | TAIEX 5.72% | +3.30% | 0.292 | -39.0% | 11.4 | 7/24 |
| Japan (JPX) | 7.39% | Nikkei 4.32% | +3.06% | 0.318 | -45.5% | 26.8 | 5/24 |
| Korea (KSC) | 5.70% | KOSPI 6.81% | -1.11% | 0.138 | -32.0% | 25.7 | 7/24 |
| US (NYSE+NASDAQ+AMEX) | 5.55% | S&P 500 8.86% | -3.32% | 0.091 | -60.4% | 28.7 | 0/24 |
| Hong Kong (HKSE) | -1.42% | Hang Seng 2.53% | -3.95% | -0.162 | -63.9% | 24.8 | 3/24 |
| UK (LSE) | -2.47% | FTSE 100 1.81% | -4.28% | -0.287 | -69.1% | 16.2 | 8/24 |
| India (NSE)* | 8.56% | Sensex 13.63% | -5.07% | 0.049 | -58.1% | 24.9 | 8/24 |
India (NSE): data coverage starts 2009. See note below. *Taiwan: thin universe (11.4 stocks on average when invested). See note below.
Three markets beat their local benchmarks: Canada (+3.61%), Taiwan (+3.30%), and Japan (+3.06%). The rest underperformed. When measured against local indices rather than the S&P 500, the picture shifts. India's apparent near-parity with SPY becomes a clear -5.1% underperformance vs the Sensex. Japan's "barely matching SPY" becomes genuine outperformance of the Nikkei.
Japan: Why It Works
Japan averaged over 100 qualifying net-net stocks per year (the portfolio holds up to 30 of them, equal-weighted, which is why the table shows ~27 average holdings). The structural reasons: companies hoard cash, governance reform was slow, and decades of deflation meant many profitable businesses traded at distressed valuations.
Japan net-nets returned 7.39% CAGR over 19 active years (2006-2024), beating the Nikkei 225 (4.32%) by 3.06 percentage points per year:
- Win rate: 58.3% (beat the Nikkei in 14 of 24 years)
- Max drawdown: -45.5% vs -49.6% for the Nikkei
- Down capture: 45.0% (when the Nikkei falls, net-nets fall less than half as much)
- Alpha: +4.7% annually
The strategy outperformed in 11 of 19 active years. Notable runs: 2008 (financial crisis protection: -17.8% vs the Nikkei's -33.9%), 2010-2013 (Abenomics governance reform), 2022-2024 (Japan equity renaissance).
The risk-adjusted case for Japan net-nets is real. It's not a guarantee, 2018-2020 were rough, but the structural supply of net-nets combined with an identifiable catalyst (governance pressure to return cash) creates a genuine edge.
United States: The Eroded Premium
Academic research from the 1980s found substantial net-net premiums in US markets. Oppenheimer (1986) documented 29% annual returns from 1970-1983. That premium has largely disappeared.
Our data: 5.55% CAGR over 24 years, underperforming the S&P 500 by 3.3% annually. The strategy had zero cash periods, stocks were always available, but holding them didn't pay.
The exception was crash-recovery years: 2001 (+27.8%), 2003 (+87.3%), 2009 (+98.9%), 2020 (+98.7%). In years following severe market dislocations, deeply discounted stocks bounced hard. The problem: the losses in non-crash years were severe enough to offset those recoveries over the full period.
US net-nets today are predominantly struggling companies in secular decline: retail, energy micro-caps, burn-rate bio-pharma. They're cheap for real reasons that often don't resolve within a year.
Hong Kong: The Cautionary Tale
Hong Kong net-nets performed reasonably well through 2010, the strategy delivered +59.7% in 2006 and +63.8% in 2009. Then the deterioration began.
Year-by-year after 2010 (vs Hang Seng):
| Year | HKSE Net-Net | Hang Seng | Excess |
|---|---|---|---|
| 2011 | -26.9% | -15.0% | -11.9% |
| 2012 | +9.1% | +9.0% | +0.2% |
| 2013 | +21.9% | +0.7% | +21.2% |
| 2014 | +6.6% | +12.2% | -5.6% |
| 2015 | -18.6% | -20.2% | +1.6% |
| 2016 | +3.3% | +20.2% | -16.9% |
| 2017 | +4.4% | +24.4% | -20.0% |
| 2018 | -12.3% | -1.8% | -10.5% |
| 2019 | -31.3% | -21.4% | -9.9% |
| 2020 | +41.0% | +23.2% | +17.8% |
| 2021 | -19.9% | -21.5% | +1.6% |
| 2022 | -15.3% | -9.3% | -6.0% |
| 2023 | -19.3% | -17.0% | -2.3% |
| 2024 | +22.0% | +37.0% | -15.1% |
Even against the weak Hang Seng (which itself returned only 2.53% CAGR over the period), Hong Kong net-nets underperformed by 3.95% per year and lost money in absolute terms (-1.42% CAGR). This is not a data artifact. It reflects real-world events: the 2014-2015 Occupy Central movement, the 2019 protests, the 2020 National Security Law, and ongoing regulatory crackdowns.
Hong Kong net-nets lost money even as underlying companies had positive NCAV. The discount widened rather than closing. When political risk is extreme and persistent, value investing doesn't work because there's no catalyst to close the gap between price and fundamental value.
The -63.9% peak-to-trough drawdown is among the starkest numbers in this dataset.
India: Strong Returns, Stronger Benchmark
India (NSE-only) shows CAGR of 8.56% over 24 years, with 8 cash periods (2001-2008 due to data coverage). From 2009 onward, the NSE data is solid.
The headline number looks decent until you see the benchmark. The Sensex returned 13.63% CAGR over the same period. India net-nets underperformed the local market by 5.1 percentage points per year. This is a major finding: what appeared to be near-parity with the S&P 500 in our earlier analysis was actually significant underperformance vs the correct benchmark.
Key years (vs Sensex): - 2009: +123.7% vs Sensex +73.3% (crash recovery, net-nets bounced hard) - 2014: +52.3% vs Sensex +26.4% (Modi election rally) - 2015: +32.0% vs Sensex -10.9% (net-nets outperformed in a down market) - 2019: -47.0% vs Sensex -29.4% (liquidity crunch, shadow banking crisis) - 2020: +104.5% (COVID recovery) - 2021: +54.4% vs Sensex +23.3% (India growth optimism) - 2023: +88.3% vs Sensex +25.0% (India outperformance year)
India net-nets produce episodic outsized returns but with significant volatility. The -58.1% max drawdown reflects how deeply distressed the underlying companies are. And the Sensex's strong structural growth (driven by India's economic expansion) means even a strategy that returns 8.6% annually still loses to the local market.
Note: We ran BSE+NSE combined initially, which creates a methodological problem: many Indian companies are dual-listed on both exchanges. The NSE-only results above correct for this.
Canada: The Biggest Premium, With a High-Beta Catch
Canada (TSX): 8.73% CAGR vs TSX Composite 5.12%, +3.61% excess. This is the largest local-benchmark premium in the study. Canada produces consistent net-net candidates (21.4 stocks on average, with only two cash years, 2004-2005) and the TSX Composite's modest 5.1% CAGR over this period means the premium is meaningful.
The catch: Canadian net-nets are a high-beta ride, not a downside-protection story. Beta is 1.49, up capture is 171%, and down capture is 117%. The strategy wins by recovering harder after busts (+76.4% in 2009, +99.3% in 2020), not by falling less (-47.5% in 2008 vs the TSX's -32.9%). The energy and resource concentration in TSX small-caps ties results to commodity cycles.
Taiwan: Strong Numbers, Thin Universe
Taiwan (TAI+TWO): 9.02% CAGR vs TAIEX 5.72%, +3.30% excess, with the second-best Sharpe in the study (0.292) and down capture of just 27.7%.
The caveat is supply. Taiwan averaged only 11.4 qualifying stocks when invested and spent 7 of 24 years in cash (2001-2007, before data coverage filled in). A portfolio of 11 micro-caps is noisier than Japan's 27 or Canada's 21, and single-stock outcomes move the results. We treat Taiwan as a genuine positive signal with wide error bars rather than a strategy you'd run on its own.
Korea and the UK
Korea (KSC): 5.70% CAGR vs KOSPI 6.81%, -1.11% excess. Korean net-nets underperform the local index by about a point a year. The portfolio is strikingly defensive (beta 0.31, down capture near zero), so it loses far less than the KOSPI in bad years, but it gives up too much upside to keep pace. Korean corporate governance has similar issues to Japan (chaebols hoard cash), but the market is more export-dependent and politically sensitive than Japan's domestic net-net universe.
UK (LSE): -2.47% CAGR vs FTSE 100 1.81%, -4.28% excess. The worst absolute performer in the study, with a -69.1% max drawdown and 8 cash years. UK small-caps have faced persistent headwinds: Brexit uncertainty, post-financial-crisis deleveraging, and structural decline in sectors like retail and media that produce the most net-nets. A data note: after cleaning phantom price spikes from the source data, three years that previously sat in cash (2008, 2010, 2012) now have enough qualifying stocks to invest, and all three lost money. The cleaner data made the UK picture worse, not better.
What to Take From This
The net-net premium documented in academic research from the 1970s-1980s exists in different forms in different markets today:
- Canada: The largest premium: +3.61% excess vs TSX Composite. Consistent net-net supply and a weak local benchmark combine to make net-nets work, but it's a high-beta ride (beta 1.49) tied to commodity cycles.
- Japan: Structural supply from corporate culture + identifiable catalyst from governance reform. Premium is real and the best risk-adjusted in the study: +3.06% vs Nikkei, +4.7% alpha, 45% down capture.
- Taiwan: +3.30% excess vs TAIEX with strong risk numbers, but a thin universe (11.4 stocks on average) makes it a noisy signal.
- India: Despite impressive absolute returns (8.56% CAGR), net-nets badly trail the Sensex (-5.1% excess). India's growth market rewards being in the index, not hunting for distressed stocks.
- Most markets: Premium has eroded vs local benchmarks. Stocks are cheap for real reasons. Holding them for a year typically doesn't close the discount.
- Hong Kong: When systematic political risk overrides fundamental value, the strategy fails. Even against the weak Hang Seng, net-nets lost 3.95% per year and went backwards in absolute terms.
- Crash years: Universally, net-nets bounce hard after market dislocations. The strategy works best as a post-crash recovery play, not as a steady-state strategy.
If you're going to run net-nets, Japan has the best risk-adjusted case and Canada the biggest premium. Taiwan is a positive signal with wide error bars. For US, UK, India, Korea, and Hong Kong, the historical evidence no longer supports it.
Excluded Markets
Australia (ASX) and Brazil (SAO): Excluded due to adjusted-close price data quality issues. Historical price splits aren't consistently reflected in the adjClose field, which creates systematic errors in return calculations. Data quality, not strategy performance, drove these exclusions.
China (SHH/SHZ): Average 4 qualifying stocks per year, too thin for a 30-stock portfolio. Results would be driven by idiosyncratic company outcomes, not strategy performance.
Disclaimer: This is research content, not investment advice. Past performance does not guarantee future results. Backtest results do not account for transaction costs, slippage, or other real-world constraints. Always conduct your own due diligence before making investment decisions.
Run the current global net-net screen on Ceta Research Data Explorer.
Data: FMP financial data warehouse via Ceta Research. Annual rebalance April, equal weight, MOC execution (next-day close), 2001-2024. Each exchange benchmarked against local currency index. India (NSE) covers 2009-2024 due to data availability. Detailed regional posts: US, Japan. Backtest code: github.com/ceta-research/backtests