Cash Flow
Japan: -4.6% Underperformance, 24% Cash Periods
OCF momentum returned 3.2% annually on Japanese stocks, underperforming SPY by 4.6%. 24% cash drag + weak shareholder orientation = signal failure. Cash generation without value creation.
Cash Flow
OCF momentum returned 3.2% annually on Japanese stocks, underperforming SPY by 4.6%. 24% cash drag + weak shareholder orientation = signal failure. Cash generation without value creation.
Cash Flow
OCF momentum returned 6.2% annually on Swiss stocks, -1.6% vs SPY but with solid Sharpe (0.37) and lowest volatility (15.7%). Defensive quality, no alpha.
Cash Flow
OCF momentum returned 2.1% annually on Thai stocks, worst performance of any market tested. -5.7% vs SPY, negative Sharpe, 24% cash drag. Political instability + weak governance = signal irrelevant.
Cash Flow
OCF momentum returned 7.7% annually on UK stocks, essentially matching SPY's 7.8%. Extreme volatility (+66% best year, -27% worst) with no alpha. Developed market reality check.
Cash Flow
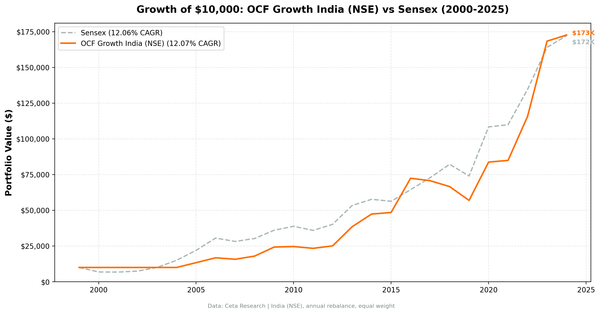
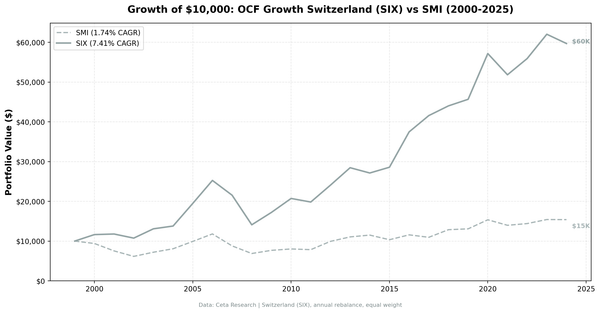
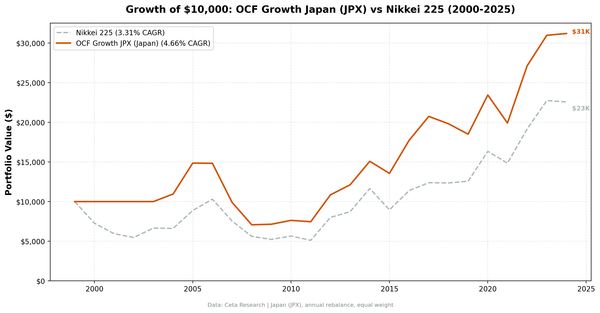
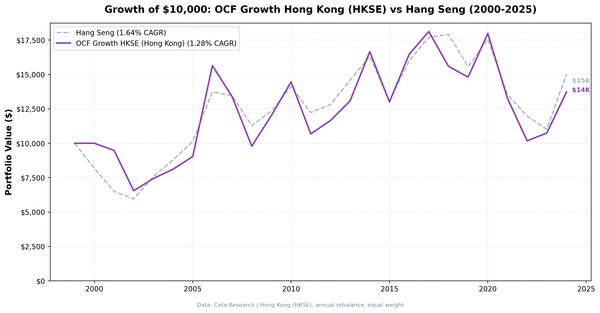
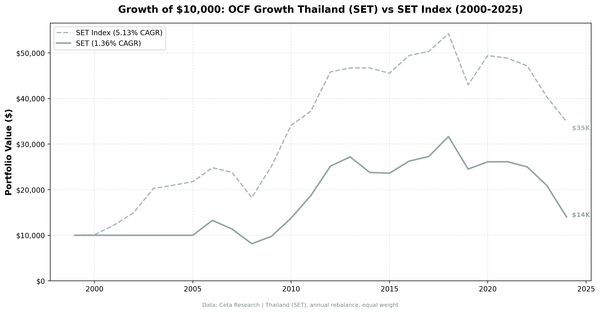
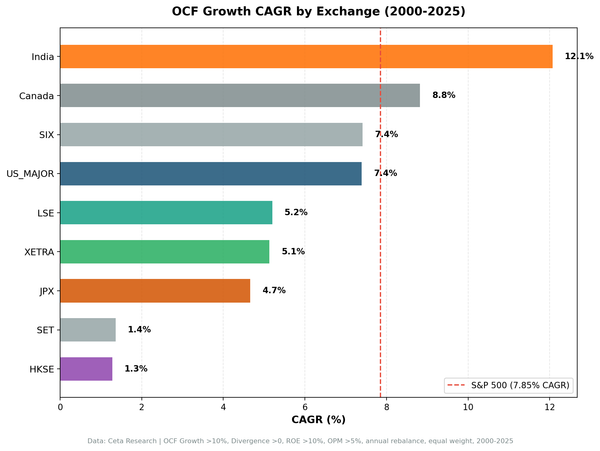
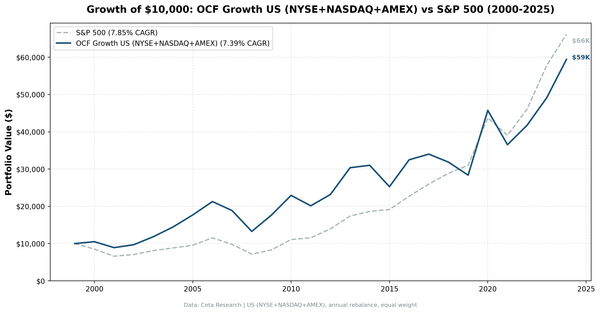
We tested a cash flow quality screen on 25 years of US stock data. The strategy matched the S&P 500's 7.8% return, crushing the market during the dot-com bust but struggling in growth-dominated years.
Cash Flow
OCF momentum returned 10.2% annually on TSX stocks, 2000-2025. TSX Composite returned just 4.0%. $10K → $102K. Zero cash periods, 56% win rate, -22% max drawdown.
Cash Flow
Same signal, 9 markets, 25 years. India: +13.3% CAGR (+5.4% alpha). Thailand: +2.1% (-5.7% alpha). Cash flow quality works where accounting is weak, fails where it's strong.
Cash Flow
OCF momentum returned 6.6% annually on German stocks, underperforming SPY by 1.2% with -50% max drawdown. Export-heavy economy where cash flows are more volatile than earnings.
Cash Flow
OCF momentum returned 2.8% annually on Hong Kong stocks with negative Sharpe (-0.01). Holding company structures + China macro risk = worst risk-adjusted returns of any market tested.
Cash Flow
Operating cash flow momentum returned 13.0% annually on NSE stocks from 2000-2025, vs the Sensex's 12.1%. Max drawdown: -20.6% vs Sensex's -32.2%. $10,000 → $201,000.