
Sector Momentum Rotation: Tested on 14 Global Markets (2000-2025)

We ran the same strategy on 14 stock exchanges. 13 of 14 beat SPY. One market failed completely, and the failure tells you exactly when momentum stops working.
Contents
- The Setup
- Full Results: 14 Exchanges
- What the Pattern Shows
- Asia dominates
- Canada surprises
- Switzerland: the case study in failure
- China: volatility without alpha
- Thailand: uncorrelated with global crashes
- South Africa: too thin for significance
- The Regional Pattern
- Limitations
- Run It Yourself
The strategy: rank all sectors by 12-month equal-weighted trailing return, buy stocks in the top 2, rebalance every quarter. No fundamental screening. No valuation filters. Pure price momentum applied at the sector level.
The Setup
- Data source: Ceta Research (FMP financial data warehouse)
- Universe: 14 global exchanges, market cap thresholds in local currency
- Period: 2000-2025 (26 years, 104 quarterly periods)
- Signal: Top 2 sectors by 12-month equal-weighted trailing return
- Portfolio: All qualifying stocks in top 2 sectors, equal weight. Cash if fewer than 5 stocks qualify.
- Benchmark: S&P 500 Total Return (SPY, used as global reference)
- Transaction costs: Size-tiered per trade: 0.1% (market cap >$10B), 0.3% ($2–10B), 0.5% (<$2B), one-way
For full methodology detail, see the US flagship analysis or backtests/METHODOLOGY.md.
Full Results: 14 Exchanges
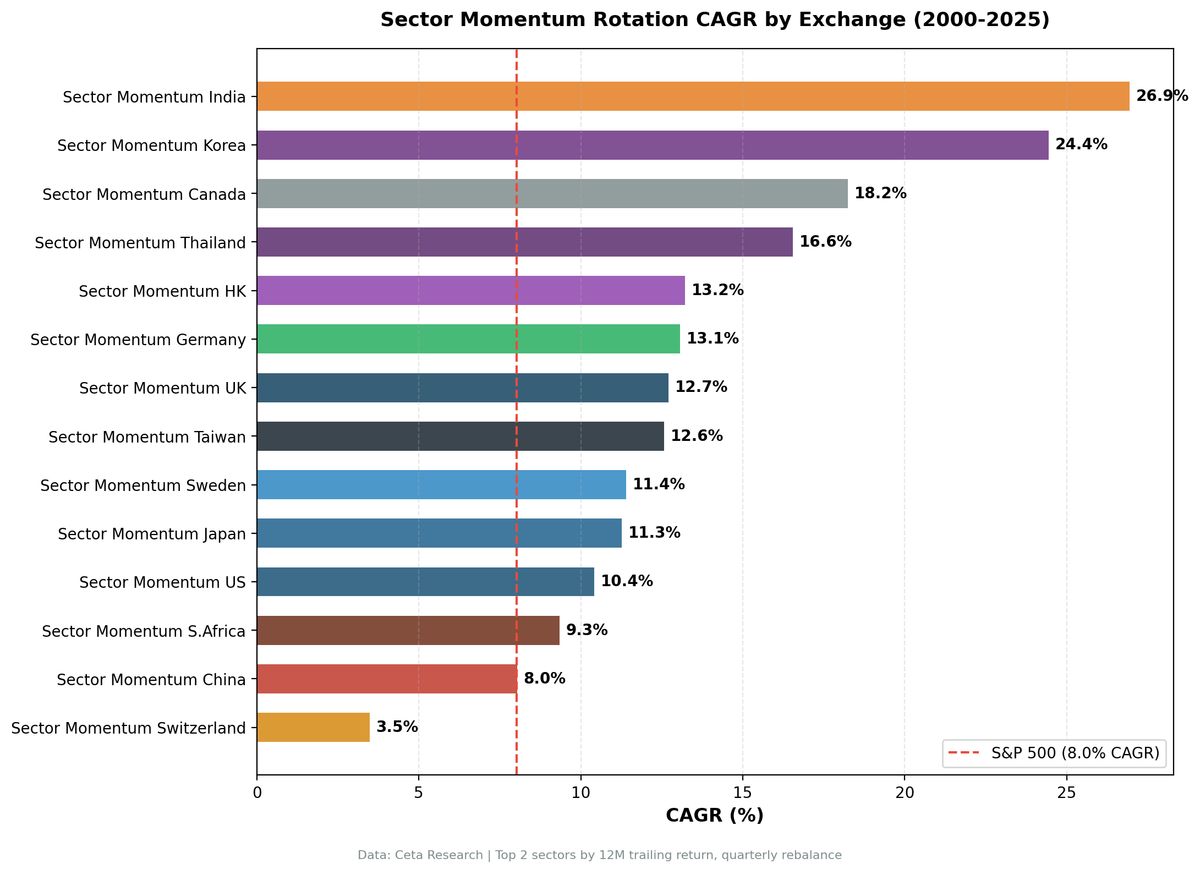
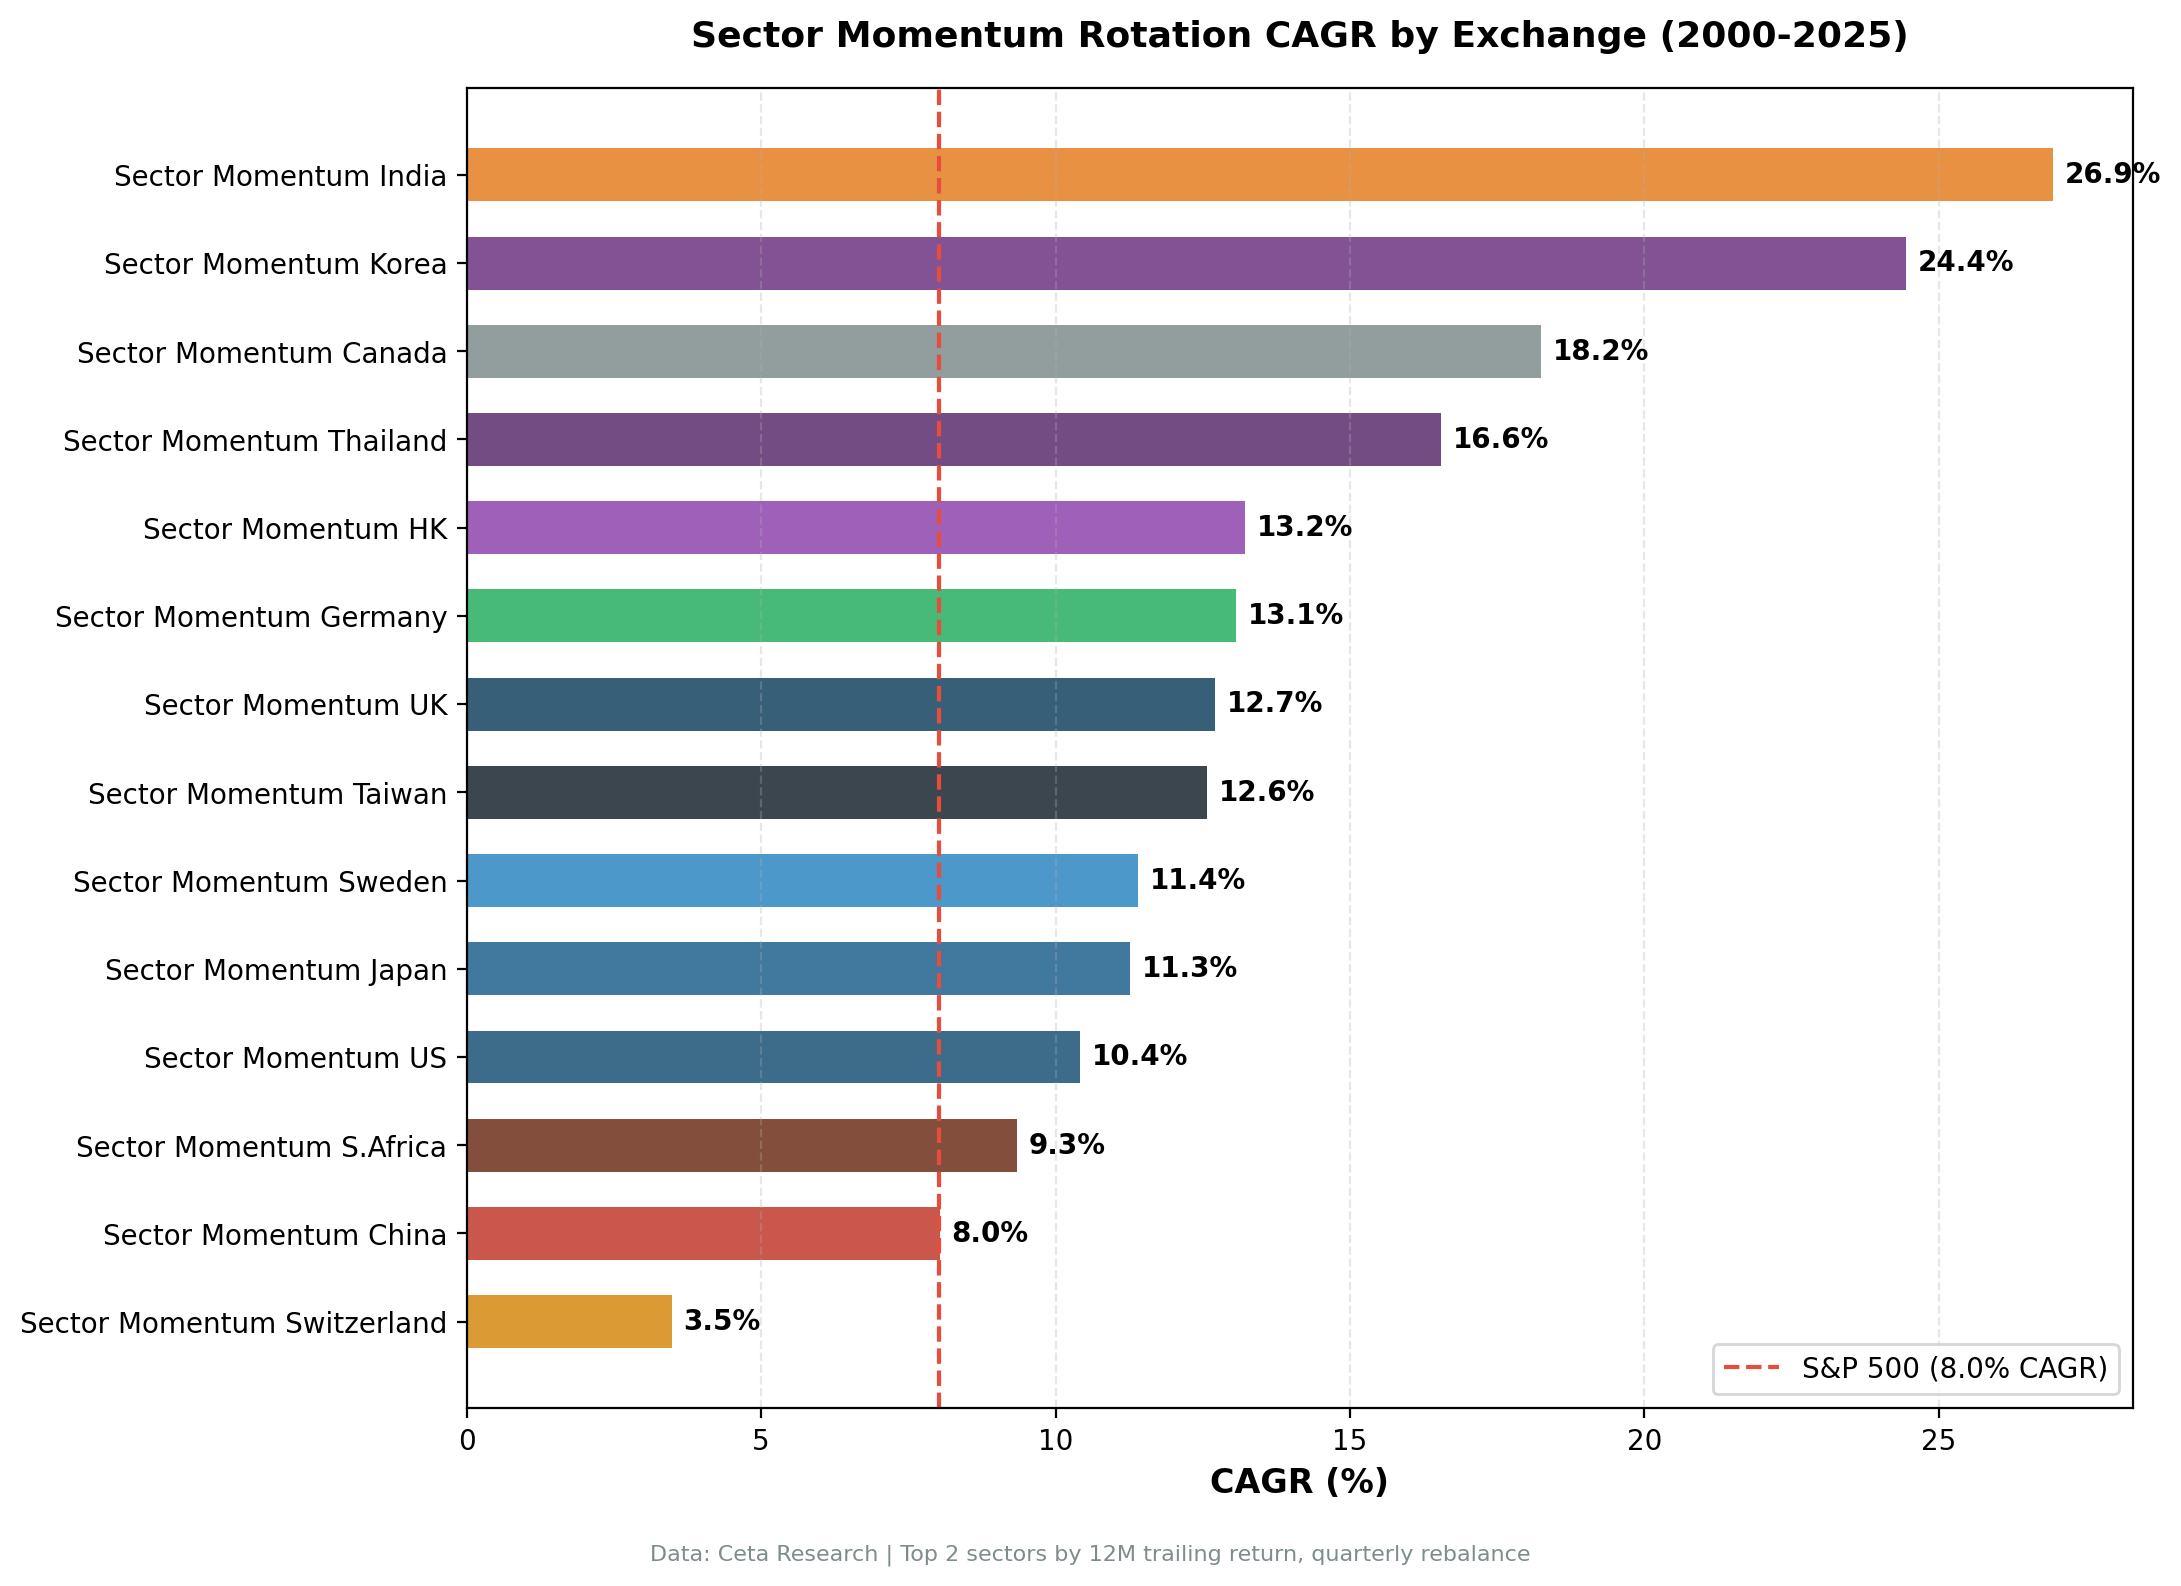
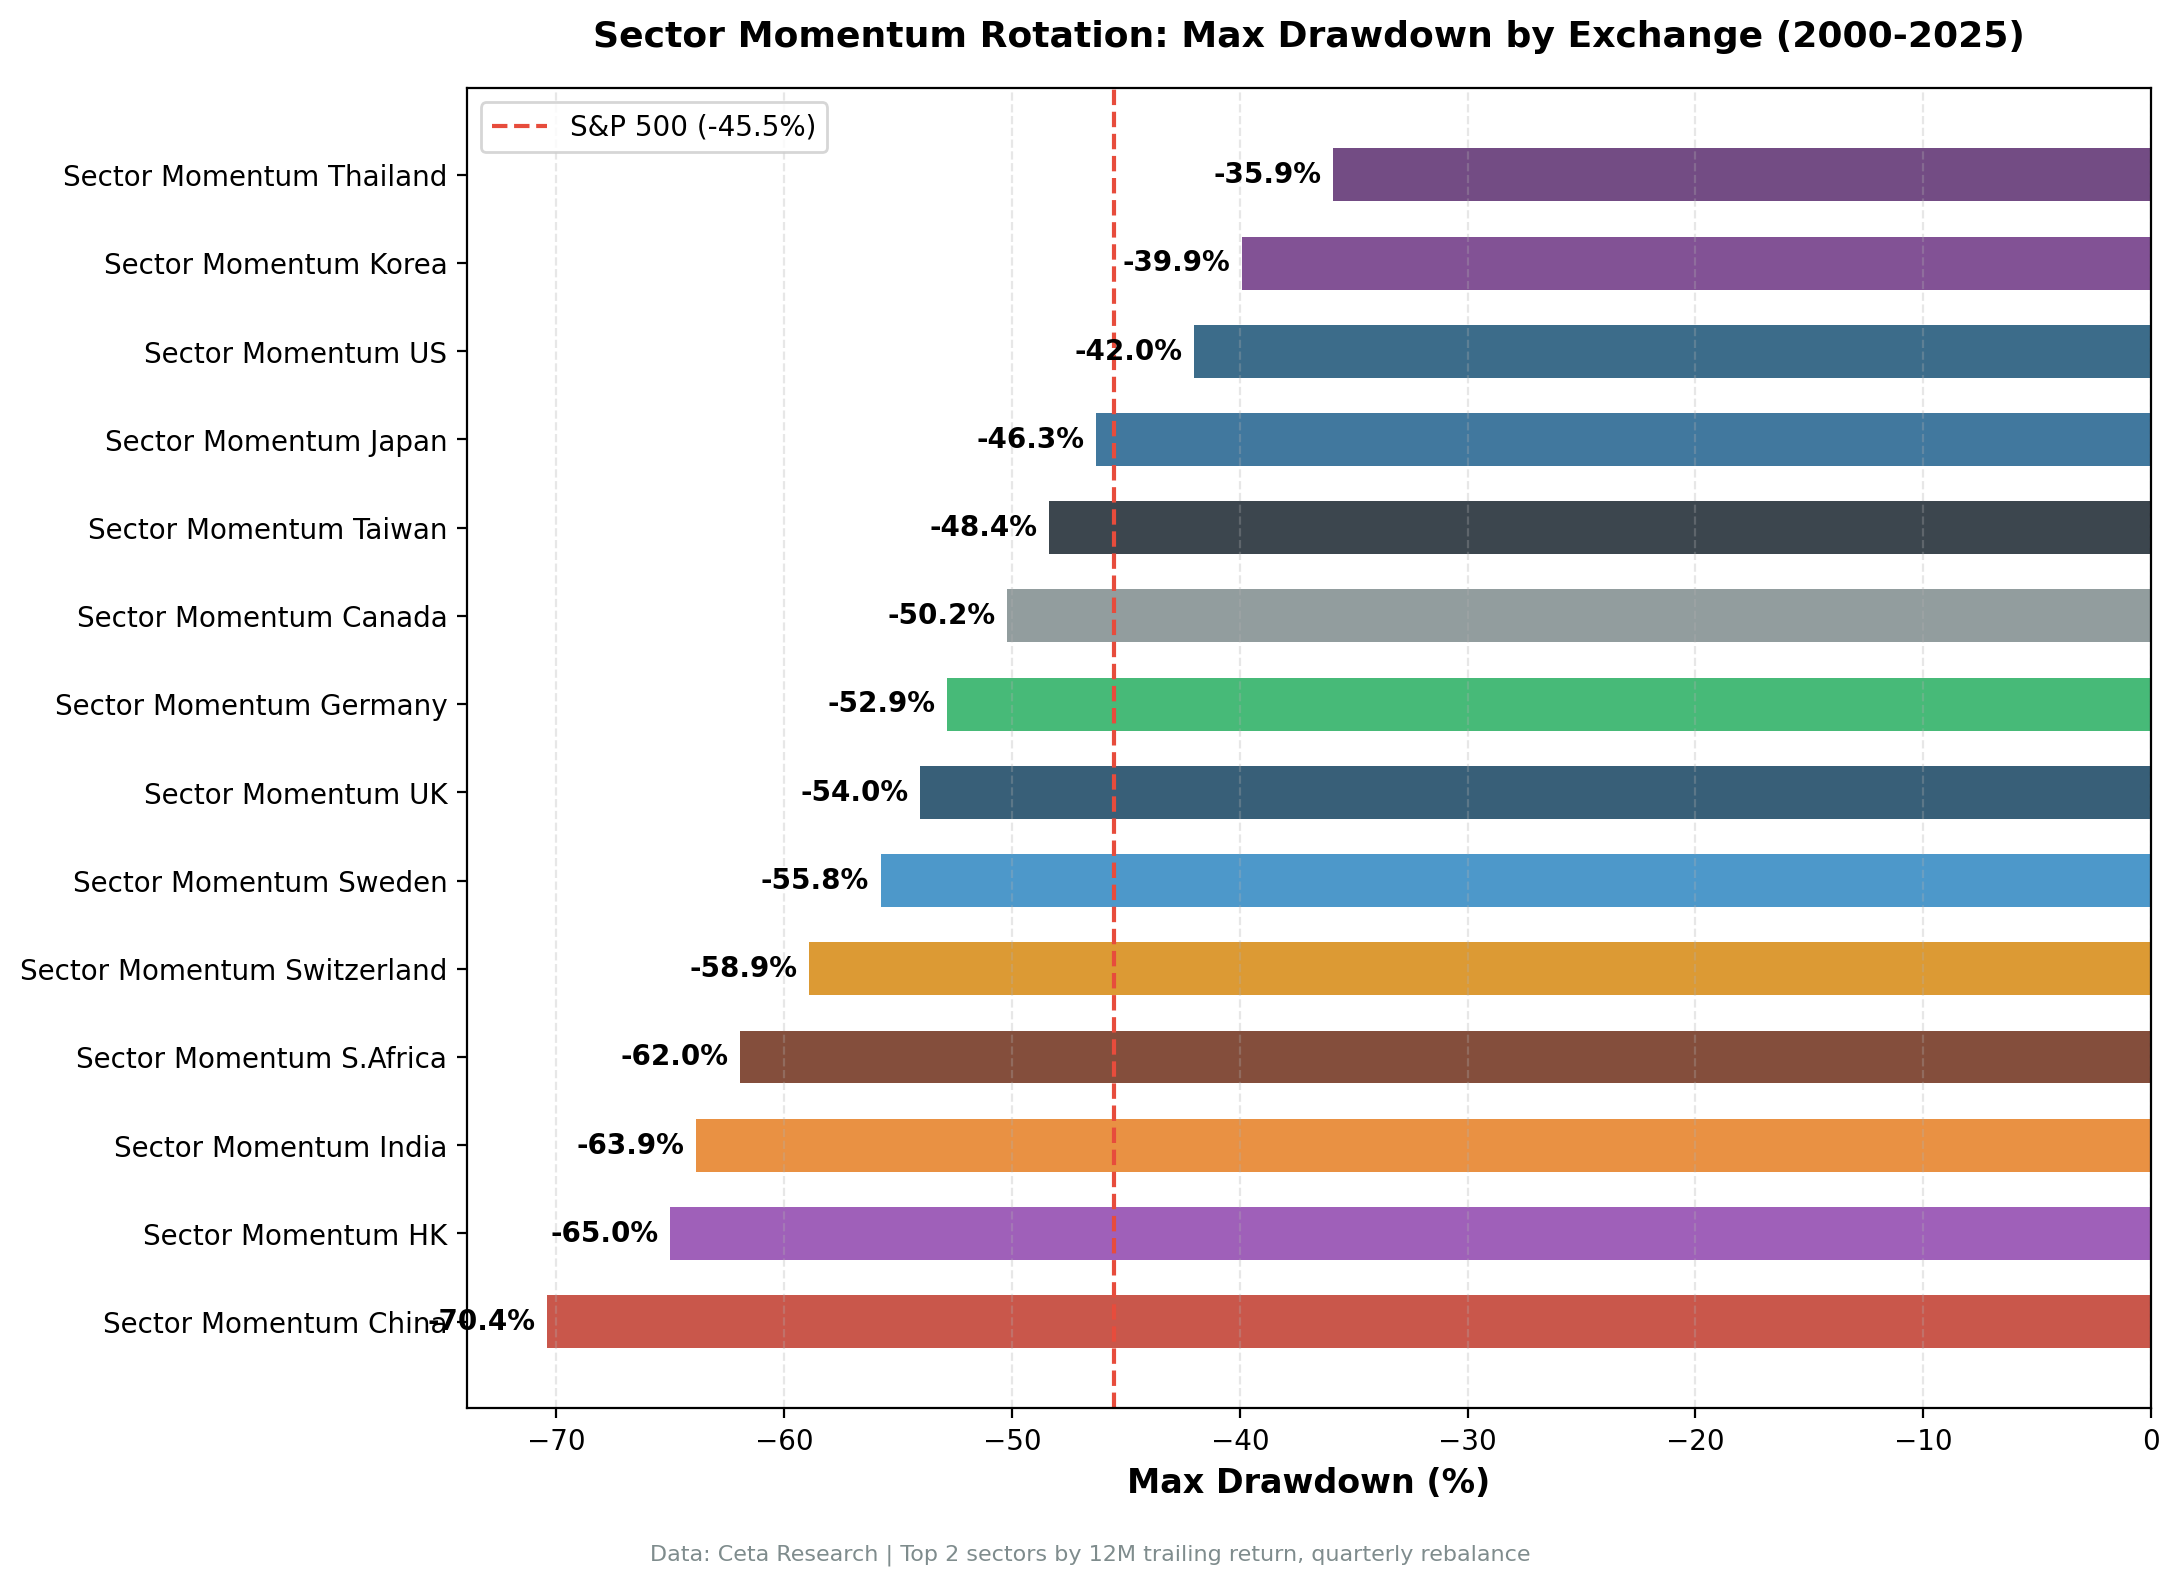
| Exchange | Market | CAGR | Excess vs SPY | Sharpe | Max DD | Down Capture | Avg Stocks |
|---|---|---|---|---|---|---|---|
| BSE_NSE | India | 26.95% | +18.93% | 0.560 | -63.87% | 42.4% | 186.7 |
| KSC | Korea | 24.44% | +16.41% | 0.747 | -39.91% | 16.5% | 55.2 |
| TSX | Canada | 18.25% | +10.23% | 0.612 | -50.21% | 51.4% | 70.7 |
| SET | Thailand | 16.55% | +8.53% | 0.674 | -35.90% | 8.0% | 26.2 |
| HKSE | Hong Kong | 13.22% | +5.20% | 0.356 | -65.02% | 97.0% | 66.3 |
| XETRA | Germany | 13.07% | +5.05% | 0.620 | -52.85% | 55.3% | 64.6 |
| LSE | UK | 12.71% | +4.69% | 0.454 | -54.04% | 65.4% | 75.5 |
| TAI_TWO | Taiwan | 12.57% | +4.54% | 0.495 | -48.38% | 52.7% | 124.6 |
| STO | Sweden | 11.40% | +3.37% | 0.444 | -55.77% | 92.0% | 29.6 |
| JPX | Japan | 11.26% | +3.24% | 0.605 | -46.31% | 54.7% | 134.0 |
| NYSE_NASDAQ_AMEX | US | 10.42% | +2.40% | 0.405 | -42.02% | 81.2% | 315.8 |
| JNB | S.Africa | 9.34% | +1.31% | 0.011 | -61.95% | 55.1% | 16.7 |
| SHH_SHZ | China | 8.03% | +0.01% | 0.166 | -70.41% | 45.6% | 325.3 |
| SIX | Switzerland | 3.48% | -4.54% | 0.170 | -58.90% | 83.1% | 36.5 |
SPY reference: 8.02% CAGR, -45.53% Max DD, Sharpe 0.357
What the Pattern Shows
Asia dominates
Korea (24.44% CAGR, Sharpe 0.747), India (26.95% CAGR), and Thailand (16.55% CAGR) are in a different category from every Western developed market. The gap isn't marginal. Korea's excess return is +16.41% annualized over 26 years. That compounds to roughly 50x more wealth than SPY over the period.
Korea's down capture of 16.5% is the most striking number in this dataset. When SPY falls in a given quarter, this portfolio falls about one-sixth as much on average. Over 26 years, that structural cushion on the downside drives extraordinary risk-adjusted returns. Korea's Sharpe of 0.747 is the highest we've measured across any sector strategy on any exchange.
The explanation is sector persistence. Korea's Healthcare sector appeared in the top 2 for 34 out of 104 quarters. Consumer Defensive for 28 quarters. These aren't short-term blips. Korea's aging demographics created a structural demand trend for medical services and consumer staples that persisted across multiple market cycles.
India's Technology sector appeared in the top 2 for 29 quarters. Healthcare for 26 quarters. Utilities for 25 quarters. India is a high-growth economy where certain sectors genuinely run hotter for years. When a sector starts outperforming, the capital flows and earnings cycles sustain it longer than in a mature market.
Canada surprises
Canada's +10.23% excess return is the biggest surprise in the developed world set. Basic Materials appeared in the top 2 for 39 quarters. Energy for 37 quarters. Technology for 36 quarters.
Canada's sector composition is concentrated in resources. When commodity cycles run, they run for years, not quarters. The basic materials and energy sectors in Canada were persistently dominant during the 2002-2007 commodity boom, then again during the 2020-2022 energy cycle. Sector momentum caught both of these and held positions throughout.
The cost: Canada's 2008 drawdown was -43.75%, worse than SPY (-34.31%). Commodity concentration cuts both ways.
Switzerland: the case study in failure
Switzerland is the only market in the dataset with negative excess returns (-4.54%). Technology appeared in the top 2 for 42 out of 104 quarters. That's 40% of all periods.
When a single sector dominates the ranking for 40% of the time, the rotation mechanism breaks down. Sector momentum works by systematically rotating into the current cycle's leaders. In Switzerland, there wasn't much rotation happening. The strategy sat in Technology for years, missed diversification benefits, and underperformed a passive approach.
Swiss Technology is essentially Logitech and a cluster of mid-cap semiconductor and precision equipment companies. These are high-quality businesses, but the sector's persistent dominance in the Swiss price signal meant the momentum screen wasn't adding information. It was just overweighting the same names that happened to be doing well for non-cyclical reasons.
The lesson: sector momentum requires actual sector rotation to add value. If one sector structurally dominates and doesn't rotate, you're running a concentrated thematic bet, not a momentum strategy.
China: volatility without alpha
China's excess return is literally +0.01% over 26 years. The strategy matched SPY exactly, but with a -70.41% max drawdown. That's the third-worst drawdown in the dataset, behind only India (-63.87%) and Hong Kong (-65.02%).
China's Energy sector appeared in the top 2 for 33 quarters. Technology for 32. Consumer Defensive for 31. The distribution is relatively balanced, which is why the strategy wasn't structurally broken in the same way as Switzerland. But the A-share market is highly volatile and momentum signals are noisy. Sector trends in China are partly driven by government policy shifts, speculative retail participation, and index rebalancing, rather than sustained earnings cycles. The signal fires, but the follow-through is inconsistent.
China is the clearest case of "strategy works in backtesting theory but the underlying market dynamics undermine it in practice."
Thailand: uncorrelated with global crashes
Thailand's 8.0% down capture is the lowest in the dataset, lower even than Korea's 16.5%. The caveat: Thailand averages only 26.2 stocks when invested, and had 9 cash periods out of 104 quarters (the most of any exchange).
When the strategy is invested, it's in domestically-oriented Thai sectors. Consumer Cyclical appeared for 31 quarters. Healthcare for 29. Consumer Defensive for 27. These sectors serve local demand, not global export cycles. When global markets crashed in 2008 or 2022, Thai consumer demand kept running. The portfolio didn't fall because its holdings weren't correlated with the global shock.
The thin universe is a real constraint. 26 average stocks with meaningful sector concentration means individual stock risk is higher than the aggregate numbers suggest.
South Africa: too thin for significance
JNB's Sharpe of 0.011 is essentially zero. The strategy averaged only 16.7 stocks when invested and had 12 cash periods. South Africa's sector structure concentrates in Basic Materials (32q), Consumer Cyclical (32q), Industrials (30q), and Consumer Defensive (30q). The signals are spread but the universe is too small to generate statistical confidence.
The +1.31% excess return over 26 years may be real or may be noise. With 16.7 average stocks, the error bars are wide. We don't produce dedicated content for this market.
The Regional Pattern
The results split into two clusters with almost no overlap:
Asian markets (Korea, India, Thailand, Taiwan): High excess returns, sector trends are long-lived, markets have lower efficiency than Western developed markets. Momentum anomalies persist longer because institutional arbitrage capital is smaller relative to market size.
Western developed markets (US, Germany, UK, Japan, Sweden, Switzerland): Modest excess returns (2-5%), sector rotations are shorter-lived, significant institutional participation means momentum gets arbed away faster. The strategy still beats SPY in most of these markets, but the edge is thinner.
Commodity-heavy Canada: Outlier in the developed world due to structural concentration in resources. Sector momentum works because commodity cycles are long and persistent.
The Moskowitz and Grinblatt (1999) paper that established sector momentum as an academic anomaly was based on US data. The US results (+2.40% excess) are consistent with that literature, but modest. The paper's authors were likely correct about the mechanism. The size of the anomaly scales with market inefficiency.
Limitations
Benchmark: We use SPY as a global benchmark for comparability. This is an imperfect reference for non-US exchanges. A local index benchmark would change the excess return numbers, though not the absolute CAGR.
Currency: All returns are in local currency. A US investor accessing Korean or Indian stocks would face currency risk and additional transaction costs.
Data quality: FMP data includes most delisted stocks for larger exchanges (reducing survivorship bias), but coverage varies. Smaller exchanges (JNB, SET) may have incomplete historical data for early years.
Cash periods: Thailand had 9 cash periods (87% invested). Some of these coincided with market crashes, which partially explains the low down capture. A different data source could change this.
Small universes: JNB (16.7 stocks) and SET (26.2 stocks) results should be interpreted cautiously. The strategy requires at least 10-15 qualifying stocks per sector for results to be statistically meaningful.
Part of a Series: US | Korea | Japan | India | Germany | Canada
Run It Yourself
The full backtest code is available at github.com/ceta-research/backtests.
Run the live sector ranking screen on Ceta Research: cetaresearch.com/data-explorer?q=-oJZC4EYnB
Data: Ceta Research (FMP financial data warehouse). Backtest period: 2000-2025. All returns in local currency unless otherwise noted.


