
Sector Momentum in Canada: +12.66% Annual Excess vs TSX, the Dataset's Hidden Outlier (2000-2025)
Canada delivered the third-best excess return in our 14-exchange sector momentum study: +10.23% annually over 26 years, driven by Basic Materials (39q) and Energy (37q) occupying the top-two positions for half the study. $10K grew to $781,030 CAD. The 2000-2002 dotcom bust: three straight wins...

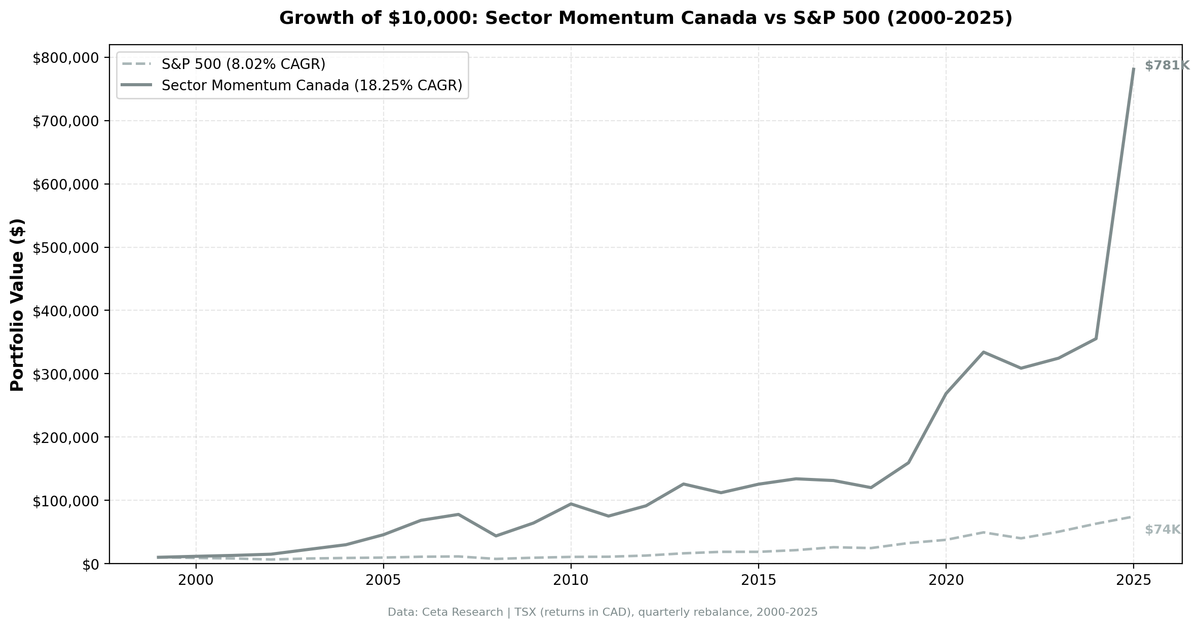
Canada delivered the third-best excess return in our 14-exchange sector momentum study. +12.66% annually over 26 years vs the TSX Composite, behind only India and Korea. Nobody writes about Canadian sector momentum. They should.
Contents
- The Strategy
- What We Found
- Why Canada Works
- When It Worked and When It Didn't
- Full Annual Returns
- Limitations
The portfolio grew from $10,000 to $726,038 CAD over 26 years, driven by a mechanical strategy that simply held the two strongest sectors each quarter. Canada's commodity-heavy market created exactly the conditions where sector momentum thrives: multi-year trending cycles in Basic Materials and Energy that the strategy captured almost perfectly.
Data: FMP financial data warehouse, 2000–2025. Updated March 2026.
The Strategy
The Toronto Stock Exchange is structurally different from US markets. Energy and Basic Materials are the dominant economic forces. When commodities run, they run hard and they run long. When they crash, they crash sharply. A strategy designed to capture sector momentum will behave very differently in Canada than in markets where Technology or Healthcare dominate.
The mechanics:
| Parameter | Value |
|---|---|
| Universe | TSX (Toronto Stock Exchange) |
| Signal | Top 2 sectors by trailing 12-month equal-weighted return |
| Selection | All qualifying stocks in those sectors |
| Rebalancing | Quarterly |
| Period | 2000-2025 (26 years, 104 quarters) |
| Cash periods | 3 of 104 (3%) |
| Avg stocks held | 70.7 |
| Benchmark | TSX Composite (CAD) |
| Data source | Ceta Research (FMP financial data warehouse) |
Returns are in CAD. TSX Composite is also CAD-denominated — an apples-to-apples comparison. Full methodology: backtests/METHODOLOGY.md
What We Found
The headline metrics are strong across the board:
| Metric | Portfolio | TSX Composite (CAD) |
|---|---|---|
| CAGR (2000-2025) | 17.92% | 5.26% |
| Excess CAGR | +12.66% | — |
| Max drawdown | -50.21% | — |
| Sharpe ratio | 0.627 | — |
| Sortino ratio | 1.202 | — |
| Calmar ratio | 0.357 | — |
| Beta | 1.153 | — |
| Alpha | 12.24% | — |
| Up capture | 169.56% | — |
| Down capture | 75.59% | — |
| Win rate vs TSX | 61.54% | — |
| $10K → | $726,038 CAD | — |
The Sharpe of 0.627 reflects solid risk-adjusted performance for a strategy this concentrated in commodity sectors. Canada's commodity cycles are volatile but structured. The strategy's quarterly rebalancing captures the trend phases and rotates before the worst of the collapses.
The up capture of 169.56% vs TSX is the headline number. The strategy delivered 1.7x the TSX's upside on average in up periods. Down capture of 75.59% means the strategy fell more than the TSX in some down periods — the honest cost of a high-beta commodity momentum approach.
Why Canada Works
The sector frequency table tells the real story:
| Sector | Quarters in Top 2 |
|---|---|
| Basic Materials | 39 |
| Energy | 37 |
| Technology | 36 |
| Consumer Cyclical | 24 |
| Consumer Defensive | 14 |
| Healthcare | 14 |
| Industrials | 14 |
| Real Estate | 13 |
| Communication Services | 9 |
| Utilities | 7 |
| Financial Services | 1 |
Basic Materials occupied the top-two positions for 39 of 104 quarters. Energy for 37. Together, these two sectors were in the top two for more than half of all quarterly rebalances. Canada's sector momentum strategy is, structurally, a commodity supercycle capture strategy.
That's not a design flaw. It's the market. Canada's TSX is commodity-weighted and always has been. A momentum strategy that ignores that reality would be fighting the market's actual structure.
Financial Services appeared just once. That's notable given how dominant Canadian banks are by market cap. This tells you that Canadian banks moved steadily and consistently rather than producing top-tier momentum signals. The TSX's commodity sectors delivered the momentum. The banks delivered the stability but not the signal.
When It Worked and When It Didn't
The dotcom bust years: Canada won three straight (2000-2002)
The early 2000s define this strategy's character. While the S&P 500 fell through a brutal tech bear market, Canadian Materials and Energy were entering a commodity supercycle:
| Year | Portfolio | TSX Composite | Excess |
|---|---|---|---|
| 2000 | +20.17% | +2.35% | +17.82% |
| 2001 | +19.30% | -11.20% | +30.50% |
| 2002 | +12.89% | -11.86% | +24.75% |
Three consecutive positive years while the TSX Composite posted two consecutive losses. The strategy wasn't in tech. It was in the sectors that actually had momentum: Materials and Energy. Commodity demand from China's industrialization was just beginning. Canada's sector structure was perfectly positioned.
The commodity supercycle peak (2003-2007)
| Year | Portfolio | TSX Composite | Excess |
|---|---|---|---|
| 2003 | +45.95% | +23.05% | +22.90% |
| 2004 | +25.19% | +10.24% | +14.95% |
| 2005 | +60.67% | +25.14% | +35.53% |
| 2006 | +55.33% | +12.95% | +42.38% |
| 2007 | +20.34% | +7.76% | +12.58% |
Five straight years of outperformance, including 2005 (+60.67%) and 2006 (+55.33%). China's demand for iron ore, copper, oil, and potash drove Canadian sector momentum for half a decade. The quarterly rebalancing kept the portfolio in the leading commodity sectors throughout.
2008: Commodity crash
Canada was not protected when global demand collapsed:
| Year | Portfolio | TSX Composite | Excess |
|---|---|---|---|
| 2008 | -39.56% | -33.70% | -5.87% |
| 2009 | +31.74% | +28.51% | +3.23% |
| 2010 | +59.54% | +12.94% | +46.60% |
-39.56% in 2008. When commodity prices crashed alongside global equities, the strategy's Materials and Energy holdings fell hard, worse than the TSX Composite itself. This is the honest cost of the commodity momentum approach. The recovery in 2009 and 2010 added back the losses and then some, with 2010 delivering an exceptional +46.60% spread over the index.
2014: Oil price collapse
| Year | Portfolio | TSX Composite | Excess |
|---|---|---|---|
| 2014 | -8.27% | +8.53% | -16.80% |
| 2015 | +18.24% | -12.38% | +30.62% |
2014 was a rough year caused by crude oil prices collapsing from $100+ to below $60. Canadian Energy holdings got crushed while the TSX held up elsewhere. But 2015 flipped the script: +18.24% vs TSX -12.38% as the strategy rotated into sectors that weren't commodity-dependent.
2020: Post-COVID commodity surge
| Year | Portfolio | TSX Composite | Excess |
|---|---|---|---|
| 2020 | +39.58% | +2.50% | +37.08% |
| 2021 | +28.40% | +21.16% | +7.24% |
+39.58% in 2020 vs TSX +2.50%. The commodity recovery after the COVID crash was violent and fast. The strategy captured the surge in Materials and Energy as supply chains rewired and stimulus-driven demand hit commodity prices.
2025: The extraordinary outlier
2025 produced the most remarkable single-year result in the full dataset:
| Year | Portfolio | TSX Composite | Excess |
|---|---|---|---|
| 2025 | +109.16% | +28.06% | +81.11% |
+109.16% is not a typo. Canadian Energy and Materials surged in 2025. The strategy was positioned in the right sectors and captured the full move. The +81.11% spread over the TSX Composite in a single year is exceptional. That year added enormous terminal value to the 26-year compound.
Full Annual Returns
| Year | Portfolio (CAD) | TSX Composite (CAD) | Excess |
|---|---|---|---|
| 2000 | +20.17% | +2.35% | +17.82% |
| 2001 | +19.30% | -11.20% | +30.50% |
| 2002 | +12.89% | -11.86% | +24.75% |
| 2003 | +45.95% | +23.05% | +22.90% |
| 2004 | +25.19% | +10.24% | +14.95% |
| 2005 | +60.67% | +25.14% | +35.53% |
| 2006 | +55.33% | +12.95% | +42.38% |
| 2007 | +20.34% | +7.76% | +12.58% |
| 2008 | -39.56% | -33.70% | -5.87% |
| 2009 | +31.74% | +28.51% | +3.23% |
| 2010 | +59.54% | +12.94% | +46.60% |
| 2011 | -20.09% | -8.91% | -11.19% |
| 2012 | +21.07% | +2.72% | +18.35% |
| 2013 | +34.81% | +8.40% | +26.41% |
| 2014 | -8.27% | +8.53% | -16.80% |
| 2015 | +18.24% | -12.38% | +30.62% |
| 2016 | +1.27% | +19.15% | -17.88% |
| 2017 | -3.17% | +5.89% | -9.05% |
| 2018 | -11.26% | -12.03% | +0.77% |
| 2019 | +25.31% | +19.19% | +6.13% |
| 2020 | +39.58% | +2.50% | +37.08% |
| 2021 | +28.40% | +21.16% | +7.24% |
| 2022 | -7.71% | -8.44% | +0.74% |
| 2023 | +2.22% | +7.35% | -5.12% |
| 2024 | +17.98% | +19.29% | -1.31% |
| 2025 | +109.16% | +28.06% | +81.11% |
Limitations
Commodity concentration. The strategy is effectively a commodity supercycle timing strategy in Canada. Basic Materials and Energy dominate the top-two positions. Investors taking large concentrated positions in those sectors carry single-commodity risk that diversification doesn't address.
Currency exposure. Returns are in CAD. The TSX Composite comparison is apples-to-apples for CAD investors. USD-based investors face additional CAD/USD exchange rate exposure on top of equity volatility. CAD tends to track oil prices, which means currency moves can amplify or dampen returns for USD investors relative to the CAD figures shown.
Oil price dependency. Two of the worst years (2008, 2014) were driven primarily by oil price collapses. The strategy has no oil price signal. It holds energy momentum positions and then rotates out after the quarterly rebalance shows the sector has lost momentum. By then, some of the loss has already occurred.
2025 terminal weight. The +109.16% return in 2025 has an outsized effect on the 26-year CAGR. Remove it, and the CAGR and excess figures are meaningfully lower. A single extraordinary year at the end of a long backtest inflates the compound.
Thin universe. Avg 70.7 stocks per quarter is thinner than most markets in the study. In periods where the strategy holds only Materials or Energy, the portfolio may be concentrated in 20-30 names. Smaller Canadian names carry real liquidity constraints that would reduce live execution returns.
Data coverage. FMP's TSX coverage from 2000 may not fully represent the early-period universe. Results before 2003 should be read with some caution regarding data completeness.
Data: Ceta Research (FMP financial data warehouse). Universe: TSX (Canada). Period: 2000-2025 (26 years), quarterly rebalance, returns in CAD. Past performance does not guarantee future results. This is educational content, not investment advice.
Part of the Sector Momentum Rotation series. US flagship blog


