
Sector Momentum in India: 21.45% CAGR, +10.21% Excess vs Sensex Over 26 Years (NSE)
India produced the highest CAGR of any exchange in our 13-market sector momentum study: 21.45% annually over 26 years, +10.21% excess vs Sensex, 159.36% up capture. The drawdown is severe at -66.28%, and 120.56% down capture means it amplifies bear markets.

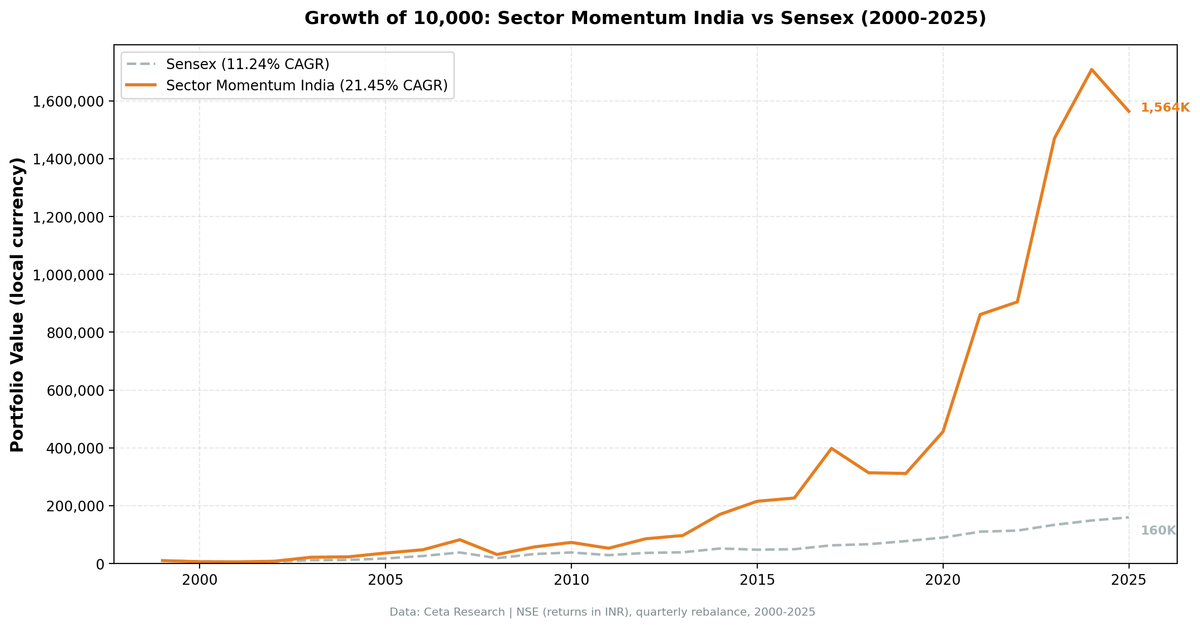
India produced the highest absolute CAGR of any exchange in our 13-market sector momentum study. 21.45% annually over 26 years. ₹10,000 grew to roughly ₹1.56 million. No other market in the dataset came close on raw return.
Contents
- The Strategy
- What We Found
- Sector Rotation Patterns
- When It Worked and When It Didn't
- Full Annual Returns
- Run It Yourself
- Limitations
The strategy is simple: every quarter, identify the two sectors with the strongest trailing 12-month returns and hold the stocks within them. Rotate when the leaders change. That mechanical rule, applied to India's NSE from 2000 to 2025, produced returns that look impossible until you study how India's sector cycles actually work, and until you look at what the investor had to survive to collect them.
Data: FMP financial data warehouse, 2000-2025. Updated August 2026.
The Strategy
Indian equity markets don't move uniformly. Technology ran for years. Healthcare ran for years. Energy and Utilities showed up repeatedly as top-two sectors across two dozen quarters each. When a sector catches a structural tailwind in India's growth economy, it tends to sustain momentum for multiple rebalance periods. That persistence is exactly what this strategy exploits.
The mechanics:
| Parameter | Value |
|---|---|
| Universe | NSE (India) |
| Signal | Top 2 sectors by trailing 12-month equal-weighted return |
| Selection | All qualifying stocks in those sectors |
| Rebalancing | Quarterly |
| Period | 2000-2025 (26 years, 104 quarters) |
| Execution | Next-day close after each rebalance date |
| Cash rule | Cash if fewer than 5 sectors qualify or fewer than 10 stocks pass |
| Cash periods | 0 of 104 |
| Avg stocks held | 95.6 |
| Benchmark | Sensex (BSE SENSEX 30, INR) |
| Transaction costs | Size-tiered by market cap, 0.1% to 0.5% one-way |
| Data source | Ceta Research (FMP financial data warehouse) |
The tier is a one-way rate and the model charges a full round trip every quarter, on every holding, even when a sector stays in the top 2 and the position carries over untouched. That's deliberately conservative: real turnover is lower than the cost model assumes.
Returns are in INR. Benchmark is Sensex (also INR). This is an apples-to-apples comparison. Full methodology: backtests/METHODOLOGY.md
What We Found
Start with the calendar years. In 2003, the portfolio returned +176.62% while Sensex returned +79.09%. In 2007: +73.58% vs +46.79%. In 2021: +88.83% vs +22.85%. In 2023: +62.61% vs +17.53%.
These aren't one-off flukes scattered across 26 years. They're a pattern. India's sector momentum strategy produced explosive calendar-year gains repeatedly, in different macro environments, driven by different sectors each time.
The aggregate numbers reflect that, and they also reflect the cost:
| Metric | Portfolio | Sensex (INR) |
|---|---|---|
| CAGR (2000-2025) | 21.45% | 11.24% |
| Excess CAGR | +10.21% | |
| Alpha (Jensen) | +8.88% | |
| Total return | 15,542% | 1,496% |
| ₹10K grows to | ₹1,563,957 | ₹159,580 |
| Max drawdown | -66.28% | -51.34% |
| Annualized volatility | 36.40% | 23.72% |
| Sharpe ratio | 0.411 | |
| Sortino ratio | 0.767 | |
| Calmar ratio | 0.324 | |
| Beta | 1.28 | 1.0 |
| Up capture | 159.36% | 100% |
| Down capture | 120.56% | 100% |
| Win rate vs Sensex (quarterly) | 61.54% |
The up capture of 159.36% is the central result. When the Sensex rises, this strategy rises about 60% faster. That's what 21.45% CAGR over 26 years looks like mechanically: sustained outperformance in up markets.
The down capture of 120.56% tells the other half. The portfolio doesn't just fail to protect during Sensex declines, it falls roughly a fifth harder than the local benchmark. Max drawdown of -66.28% against the Sensex's -51.34% is the same fact stated another way. The outperformance is earned entirely in bull markets, and it's paid for in bear markets.
That gap between excess return and alpha is worth naming. India's excess CAGR is +10.21%, but the portfolio runs a beta of 1.28. Adjust for that extra market risk and Jensen alpha is +8.88%. India is still adding genuine value, but 1.3 points of the headline excess is leverage, not skill.
Sector Rotation Patterns
The strategy doesn't hold one sector forever. It rotates as momentum shifts. But some sectors dominated the top-two positions far more than others across 104 quarterly rebalances:
| Sector | Quarters in Top 2 |
|---|---|
| Technology | 30 |
| Healthcare | 28 |
| Energy | 24 |
| Utilities | 24 |
| Consumer Defensive | 23 |
| Consumer Cyclical | 22 |
| Industrials | 17 |
| Financial Services | 16 |
| Basic Materials | 11 |
| Real Estate | 9 |
| Communication Services | 4 |
Technology, Healthcare, Energy, and Utilities occupied the top-two positions for 24 or more quarters each. That's not random rotation. India's IT sector (Infosys, TCS, Wipro, HCL) and its pharma sector (Sun Pharma, Dr. Reddy's, Cipla) have sustained structural growth stories that produced multi-year momentum trends. Utilities and Consumer Defensive showed up in defensive rotation periods. The strategy captured all of it.
Communication Services appeared only 4 times. Real Estate 9. Basic Materials 11. India's sector momentum is concentrated in quality-growth, energy, and defensive sectors, not in materials. That's the opposite of Canada's pattern, where Basic Materials led the study.
When It Worked and When It Didn't
The early boom years (2002-2007)
After a difficult 2000 (-38.62%, tech crash), the strategy strung together extraordinary returns:
| Year | Portfolio | Sensex | Excess |
|---|---|---|---|
| 2002 | +36.11% | +2.93% | +33.17% |
| 2003 | +176.62% | +79.09% | +97.52% |
| 2004 | +6.63% | +10.83% | -4.20% |
| 2005 | +57.33% | +40.59% | +16.75% |
| 2006 | +30.64% | +48.48% | -17.84% |
| 2007 | +73.58% | +46.79% | +26.79% |
Four of six years with substantial outperformance. India's IT sector was in a global outsourcing boom. Healthcare was expanding domestically. The strategy rotated through these momentum leaders and captured the bulk of the gains. 2003's +97.52% excess is the largest single-year margin anywhere in the 13-market study.
2008: The severity of the drawdown
India was not insulated from the global financial crisis:
| Year | Portfolio | Sensex | Excess |
|---|---|---|---|
| 2008 | -62.24% | -51.34% | -10.90% |
| 2009 | +84.20% | +76.32% | +7.88% |
A -62.24% single-year loss is severe. The strategy's max drawdown of -66.28% came primarily from this period. The recovery in 2009 was swift, but 2008 is the honest caveat in this dataset. When Indian sectors got caught in momentum positions heading into the global crash, the portfolio fell 11 points further than the index it's measured against. The 120.56% down capture is not an abstraction; this is what it looks like.
The Modi years and beyond (2014-2017)
| Year | Portfolio | Sensex | Excess |
|---|---|---|---|
| 2014 | +75.46% | +33.51% | +41.95% |
| 2015 | +26.55% | -8.12% | +34.67% |
| 2016 | +5.21% | +3.79% | +1.42% |
| 2017 | +75.79% | +27.14% | +48.66% |
2014 was an election year. The BJP's decisive victory unleashed a broad equity rally across Indian sectors. The momentum strategy was already positioned in the leading sectors and captured most of that move. 2015 and 2017 continued the theme.
2021-2023: The recent run
| Year | Portfolio | Sensex | Excess |
|---|---|---|---|
| 2021 | +88.83% | +22.85% | +65.98% |
| 2022 | +5.07% | +3.35% | +1.71% |
| 2023 | +62.61% | +17.53% | +45.08% |
2021 and 2023 produced the second and fourth largest excess returns in India's series. 2022 was roughly flat for both the portfolio and the Sensex.
Difficult years: 2018, 2019 and 2025
| Year | Portfolio | Sensex | Excess |
|---|---|---|---|
| 2018 | -21.19% | +6.15% | -27.34% |
| 2019 | -0.76% | +15.98% | -16.74% |
| 2025 | -8.47% | +7.28% | -15.75% |
2018 is the worst relative year in India's series: the Sensex gained 6% while the momentum portfolio lost 21%. 2019 repeated the pattern with a 16.74-point gap, and 2025 has done it again. Indian equity markets ran a split cycle through these years, with large-cap indices holding up while the broader names inside the momentum portfolio's sectors reversed sharply. Three of the last eight years have been double-digit relative losses.
Full Annual Returns
| Year | Portfolio (INR) | Sensex (INR) | Excess |
|---|---|---|---|
| 2000 | -38.62% | -25.23% | -13.39% |
| 2001 | -6.41% | -18.65% | +12.25% |
| 2002 | +36.11% | +2.93% | +33.17% |
| 2003 | +176.62% | +79.09% | +97.52% |
| 2004 | +6.63% | +10.83% | -4.20% |
| 2005 | +57.33% | +40.59% | +16.75% |
| 2006 | +30.64% | +48.48% | -17.84% |
| 2007 | +73.58% | +46.79% | +26.79% |
| 2008 | -62.24% | -51.34% | -10.90% |
| 2009 | +84.20% | +76.32% | +7.88% |
| 2010 | +27.54% | +17.10% | +10.45% |
| 2011 | -27.68% | -24.53% | -3.15% |
| 2012 | +62.01% | +27.04% | +34.97% |
| 2013 | +13.37% | +5.96% | +7.42% |
| 2014 | +75.46% | +33.51% | +41.95% |
| 2015 | +26.55% | -8.12% | +34.67% |
| 2016 | +5.21% | +3.79% | +1.42% |
| 2017 | +75.79% | +27.14% | +48.66% |
| 2018 | -21.19% | +6.15% | -27.34% |
| 2019 | -0.76% | +15.98% | -16.74% |
| 2020 | +46.44% | +15.74% | +30.71% |
| 2021 | +88.83% | +22.85% | +65.98% |
| 2022 | +5.07% | +3.35% | +1.71% |
| 2023 | +62.61% | +17.53% | +45.08% |
| 2024 | +16.14% | +11.20% | +4.95% |
| 2025 | -8.47% | +7.28% | -15.75% |
The strategy beat the Sensex in 18 of 26 calendar years.
Run It Yourself
This query ranks India's sectors by 12-month equal-weighted trailing return on the NSE. The top 2 are where the signal points today.
WITH prices AS (
    SELECT e.symbol, e.adjClose, CAST(e.date AS DATE) AS trade_date
    FROM stock_eod e
    JOIN profile p ON e.symbol = p.symbol
    WHERE p.sector IS NOT NULL AND p.sector != ''
      AND p.marketCap > 20000000000
      AND p.exchange = 'NSE'
      AND CAST(e.date AS DATE) >= CURRENT_DATE - INTERVAL '400' DAY
      AND e.adjClose IS NOT NULL AND e.adjClose > 0
),
recent AS (
    SELECT symbol, adjClose AS recent_price
    FROM prices
    QUALIFY ROW_NUMBER() OVER (PARTITION BY symbol ORDER BY trade_date DESC) = 1
),
year_ago AS (
    SELECT symbol, adjClose AS old_price
    FROM prices
    WHERE trade_date <= CURRENT_DATE - INTERVAL '365' DAY
    QUALIFY ROW_NUMBER() OVER (PARTITION BY symbol ORDER BY trade_date DESC) = 1
),
stock_returns AS (
    SELECT r.symbol, pr.sector,
           (r.recent_price / ya.old_price - 1) * 100 AS return_12m
    FROM recent r
    JOIN year_ago ya ON r.symbol = ya.symbol
    JOIN profile pr ON r.symbol = pr.symbol
    WHERE ya.old_price > 0 AND r.recent_price > 0
      AND (r.recent_price / ya.old_price - 1) BETWEEN -0.99 AND 5.0
)
SELECT
    sector,
    ROUND(AVG(return_12m), 2) AS avg_return_12m_pct,
    COUNT(DISTINCT symbol) AS n_stocks,
    ROW_NUMBER() OVER (ORDER BY AVG(return_12m) DESC) AS rank
FROM stock_returns
GROUP BY sector
HAVING COUNT(DISTINCT symbol) >= 5
ORDER BY avg_return_12m_pct DESC
Run this query on Ceta Research: cetaresearch.com/data-explorer?q=9yZaKsi8mb
The market cap floor is in INR, matching how FMP reports marketCap for NSE listings. ₹20bn is roughly the local-currency equivalent of the threshold used for smaller markets in this study.
Limitations
Currency risk for foreign investors. Returns are in INR. USD-based investors face additional USD/INR exchange rate risk. Rupee depreciation periods reduce the USD-equivalent return, and the rupee has depreciated substantially against the dollar across this period.
The max drawdown. -66.28% is not a comfortable strategy to hold. 2008 alone produced a -62.24% calendar year loss. Any investor running this strategy through 2008 needed extreme conviction to stay in through the recovery.
Worse than no downside protection. The 120.56% down capture vs Sensex means the strategy amplifies Indian market drawdowns rather than cushioning them. The alpha comes from up markets only, and the bear-market cost is real.
Excess overstates the edge. At a beta of 1.28, part of the +10.21% excess is compensation for carrying more market risk than the index. Jensen alpha of +8.88% is the risk-adjusted figure, and it's the one to compare against other markets in this study.
Sector concentration. When Technology or Healthcare dominate the top-two positions for 6-8 consecutive quarters, the portfolio is heavily concentrated in one sector type. That works when momentum is sustained. When a sector reverses sharply, the next rebalance captures the losses before rotating out.
Data coverage. FMP's NSE coverage from 2000 is not complete for early years. The avg stock count of 95.6 reflects current coverage, but early periods may have thinner representation. Results before 2005 should be read with some caution.
Not replicable as stated. The strategy selects from all qualifying stocks in the top-two sectors. With 96 average holdings, transaction costs, slippage, and liquidity constraints on smaller Indian names would reduce actual returns meaningfully. Treat these as theoretical backtest results, not live portfolio projections.
Data: Ceta Research (FMP financial data warehouse). Universe: NSE (India). Period: 2000-2025 (26 years), quarterly rebalance, next-day-close execution, returns in INR. Benchmark: Sensex (INR). Past performance does not guarantee future results. This is educational content, not investment advice.
Part of the Sector Momentum Rotation series. US flagship blog

