
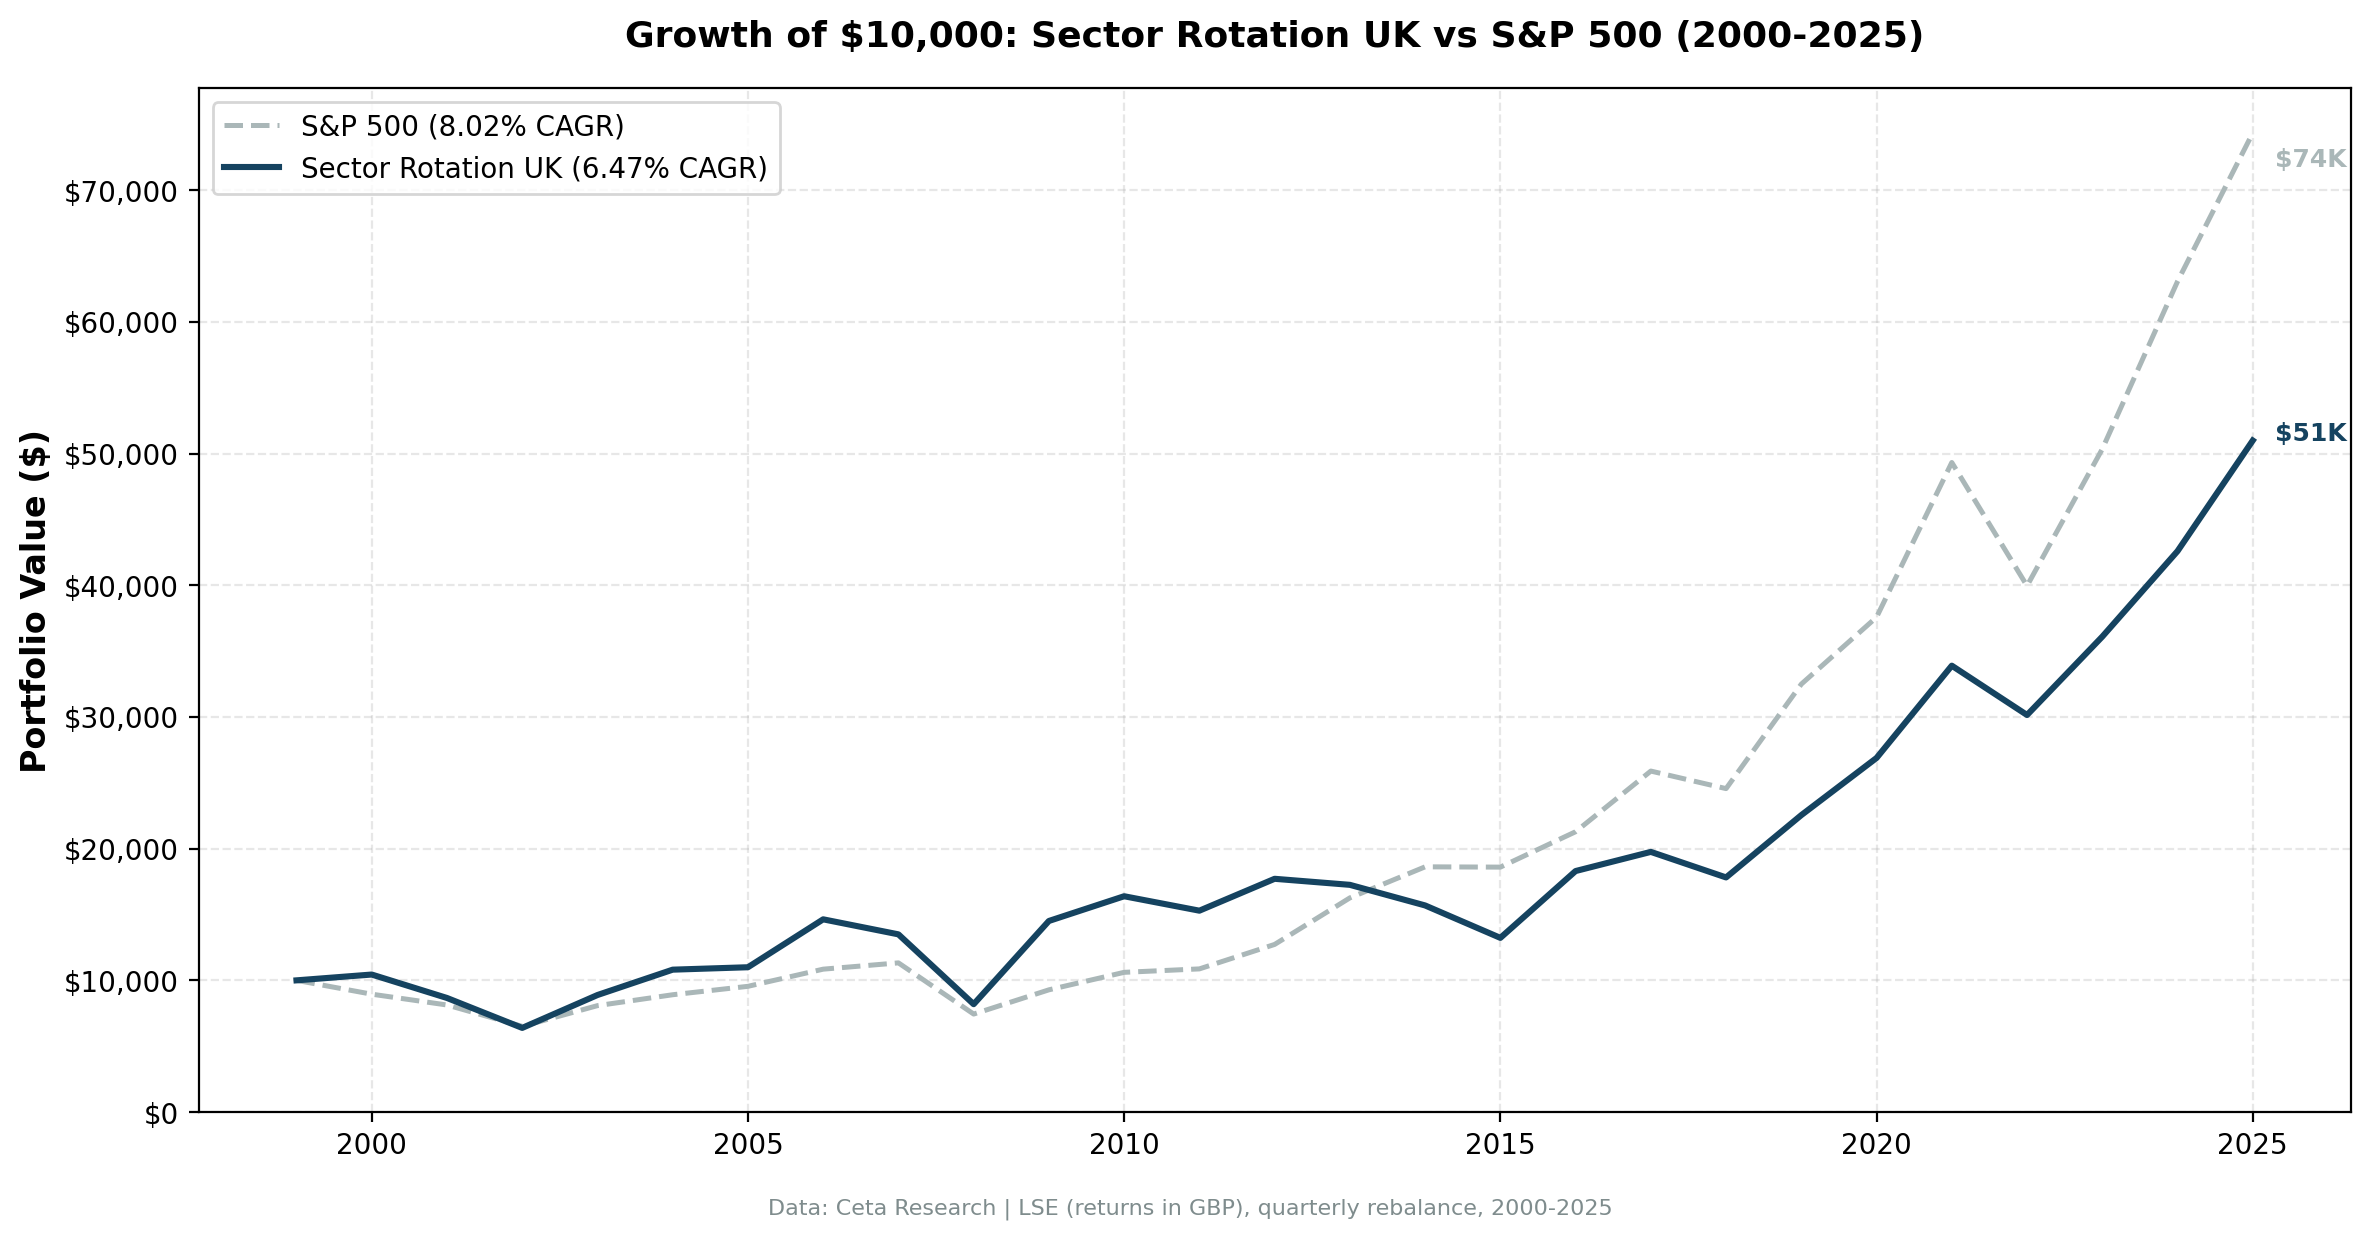
Sector Mean Reversion on UK (LSE): 6.47% CAGR, -1.56% vs S&P 500


We ran a sector mean reversion strategy on London Stock Exchange large-cap stocks from 2000 to 2025. The result was 6.47% annualized in GBP terms, a -1.56% shortfall against the S&P 500, and a portfolio that was invested in 101 of 104 quarters. The strategy fires consistently. It just doesn't outperform.
Contents
- Method
- What is Sector Mean Reversion?
- The Screen
- What We Found
- 26 years. -1.56% annual shortfall vs the S&P 500.
- Year-by-year returns
- 2009: The best year
- 2000 and 2003-2004: Early strong years
- 2013-2015: The worst three years
- 2016: Post-Brexit recovery
- 2022: One of the few recent wins
- Backtest Methodology
- Limitations
- Takeaway
- Part of a Series
- References
- Run This Screen Yourself
That headline deserves unpacking. The LSE run shows a strategy that works mechanically, it rotates into beaten-down sectors, captures recoveries, and stays nearly fully invested, but operates in a market where sector dislocations don't snap back as cleanly as they do in the US. The structure of the UK market, with its heavy concentration in Energy, Financials, and commodities-adjacent industries, means the strategy often buys the same trade repeatedly. When it works (2009, 2016), it works well. When it doesn't (2013-2015), the losses compound across multiple quarters.
Method
| Parameter | Value |
|---|---|
| Data source | Ceta Research (FMP financial data warehouse) |
| Universe | LSE, market cap > £500M |
| Period | 2000-2025 (26 years, 104 quarterly periods) |
| Rebalancing | Quarterly (January, April, July, October), equal weight all qualifying stocks in selected sectors |
| Benchmark | S&P 500 Total Return (SPY) |
| Cash rule | Hold cash if fewer than 5 stocks qualify across the bottom 2 sectors |
What is Sector Mean Reversion?
At each quarterly rebalance, we rank all sectors by their equal-weighted 12-month trailing return. We buy every large-cap stock in the bottom 2 sectors. Next quarter, we re-rank and rotate. No discretion, no filters on fundamentals.
The academic foundation is Moskowitz and Grinblatt (1999), who showed that much of the momentum anomaly is explained by industry-level patterns. The corollary: when industry-level momentum is sufficiently negative, mean reversion tends to follow. Sectors that underperform for a full year carry depressed valuations and low sentiment. Both tend to normalize.
On US stocks, that normalization happens at a rate that beats the index. On LSE, the normalization happens, but the broader UK index itself is slow enough that 6.47% in GBP doesn't clear the 8.02% SPY hurdle.
The sectors that show up most often in the UK bottom 2 are:
| Sector | Quarters Selected (of 104) |
|---|---|
| Energy | 34 (34%) |
| Utilities | 24 (24%) |
| Real Estate | 24 (24%) |
| Communication Services | 22 (22%) |
| Consumer Cyclical | 21 (21%) |
| Consumer Defensive | 19 (19%) |
This is a broader spread than the US, where Utilities and Energy account for the top two slots by a large margin. On LSE, six sectors each clock between 19 and 34 quarters of selection. That spread reflects a market where no single sector dominates sentiment cycles the way US tech or utilities do.
Energy leads at 34 quarters. The LSE has a high concentration of FTSE-listed oil majors and commodity producers. When oil falls, Energy drags. The strategy buys in. Sometimes oil recovers quickly (2009, 2016). Sometimes it doesn't (2015).
The Screen
The screen below ranks LSE large-cap sectors by their current 12-month equal-weighted return. The bottom rows are what the strategy would buy today.
WITH prices AS (
    SELECT e.symbol, e.adjClose, CAST(e.date AS DATE) AS trade_date
    FROM stock_eod e
    JOIN profile p ON e.symbol = p.symbol
    WHERE p.sector IS NOT NULL AND p.sector != ''
      AND p.marketCap > 500000000
      AND p.exchange IN ('LSE')
      AND CAST(e.date AS DATE) >= CURRENT_DATE - INTERVAL '400' DAY
      AND e.adjClose IS NOT NULL AND e.adjClose > 0
),
recent AS (
    SELECT symbol, adjClose AS recent_price
    FROM prices
    QUALIFY ROW_NUMBER() OVER (PARTITION BY symbol ORDER BY trade_date DESC) = 1
),
year_ago AS (
    SELECT symbol, adjClose AS old_price
    FROM prices
    WHERE trade_date <= CURRENT_DATE - INTERVAL '252' DAY
    QUALIFY ROW_NUMBER() OVER (PARTITION BY symbol ORDER BY trade_date DESC) = 1
),
stock_returns AS (
    SELECT r.symbol, pr.sector, (r.recent_price / ya.old_price - 1) * 100 AS return_12m
    FROM recent r
    JOIN year_ago ya ON r.symbol = ya.symbol
    JOIN profile pr ON r.symbol = pr.symbol
    WHERE ya.old_price > 0 AND r.recent_price > 0
      AND (r.recent_price / ya.old_price - 1) BETWEEN -0.99 AND 5.0
)
SELECT pr.sector,
    ROUND(AVG(sr.return_12m), 2) AS avg_return_12m_pct,
    COUNT(DISTINCT sr.symbol) AS n_stocks,
    ROW_NUMBER() OVER (ORDER BY AVG(sr.return_12m) ASC) AS rank_worst
FROM stock_returns sr
JOIN profile pr ON sr.symbol = pr.symbol
GROUP BY pr.sector
HAVING COUNT(DISTINCT sr.symbol) >= 5
ORDER BY avg_return_12m_pct ASC
What We Found
The strategy stayed invested through almost all 26 years, with just 3 cash periods out of 104 quarters. But staying invested and generating alpha are different things on the LSE.
26 years. -1.56% annual shortfall vs the S&P 500.
| Metric | Strategy | S&P 500 |
|---|---|---|
| CAGR | 6.47% | 8.02% |
| Total Return | ~397% | — |
| Volatility | 23.97% | 16.9% |
| Max Drawdown | -50.24% | -45.53% |
| Sharpe Ratio | 0.124 | 0.357 |
| Sortino Ratio | 0.185 | — |
| Calmar Ratio | 0.129 | — |
| Win Rate vs SPY | 47.12% | — |
| Up Capture | 97.96% | — |
| Down Capture | 96.47% | — |
| Avg Stocks per Period | 148.0 | — |
| Cash Periods | 3 of 104 | — |
The Sharpe ratio of 0.124 is the number that captures the full picture. This strategy carries 23.97% annualized volatility, well above the 16.9% of SPY, and delivers 6.47% return. That's a poor risk-adjusted outcome compared to simply holding the index.
Up capture is 97.96%, down capture is 96.47%. Almost symmetric. The strategy tracks the broader market closely, adding a thin layer of rotation without a decisive tilt in either direction. In the US, up capture of 131.6% with down capture of 113.7% means you earn the volatility premium in good years. On LSE, the captures are nearly 1:1, you're taking on more volatility than SPY for returns that don't justify it.
The win rate of 47.12% means the strategy trailed SPY in more than half of all quarters over 26 years.
Year-by-year returns
| Year | Strategy | S&P 500 | Excess |
|---|---|---|---|
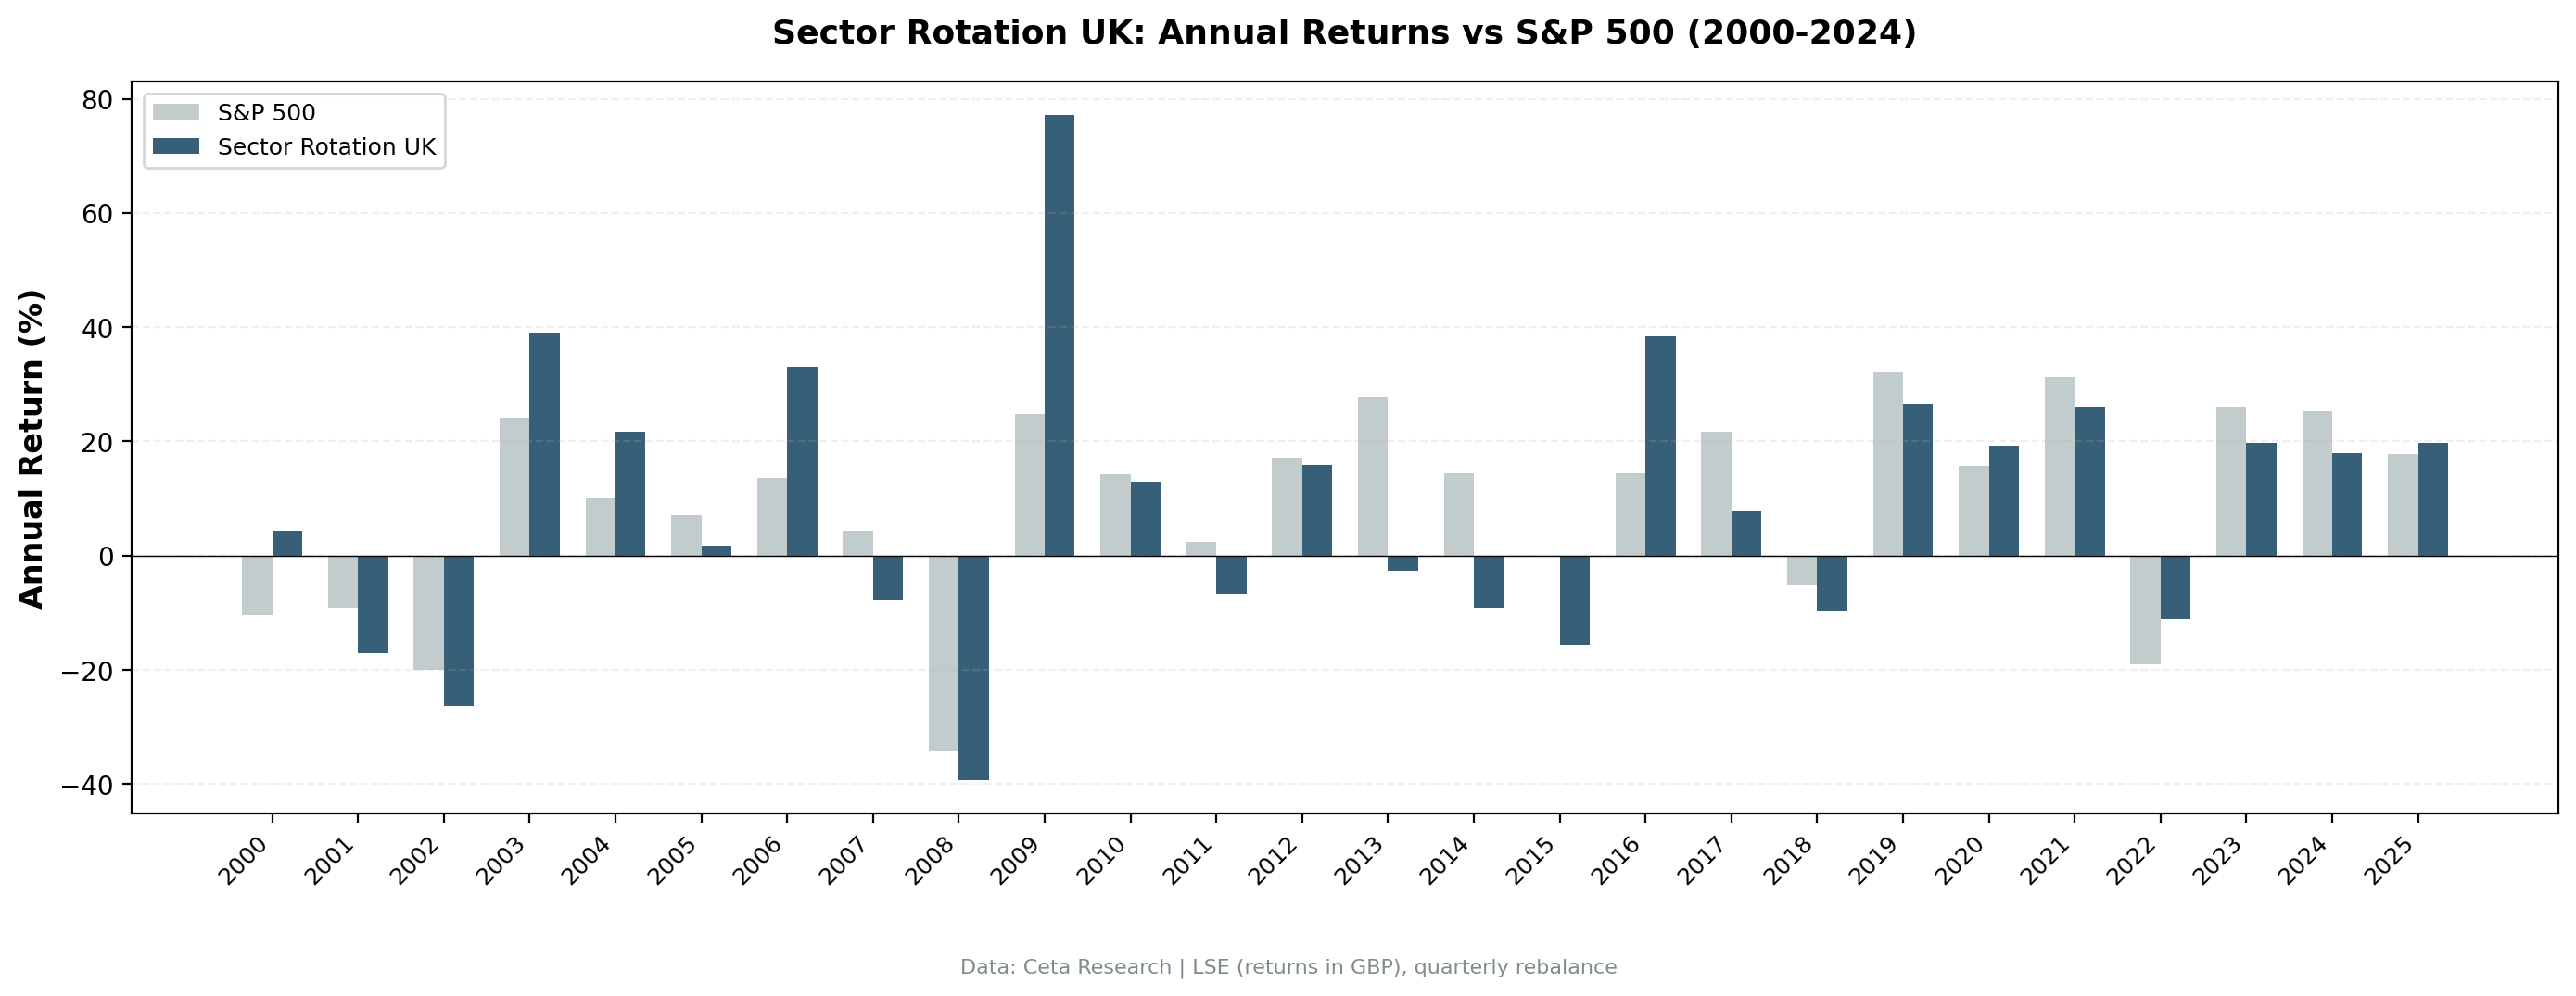
| 2000 | +4.41% | -10.50% | +14.91% |
| 2001 | -17.04% | -9.17% | -7.87% |
| 2002 | -26.24% | -19.92% | -6.32% |
| 2003 | +39.08% | +24.12% | +14.96% |
| 2004 | +21.67% | +10.24% | +11.43% |
| 2005 | +1.70% | +7.17% | -5.47% |
| 2006 | +33.09% | +13.65% | +19.44% |
| 2007 | -7.80% | +4.40% | -12.20% |
| 2008 | -39.30% | -34.31% | -4.99% |
| 2009 | +77.16% | +24.73% | +52.43% |
| 2010 | +12.94% | +14.31% | -1.37% |
| 2011 | -6.69% | +2.46% | -9.15% |
| 2012 | +15.83% | +17.09% | -1.26% |
| 2013 | -2.59% | +27.77% | -30.36% |
| 2014 | -9.07% | +14.50% | -23.57% |
| 2015 | -15.69% | -0.12% | -15.57% |
| 2016 | +38.36% | +14.45% | +23.91% |
| 2017 | +7.95% | +21.64% | -13.69% |
| 2018 | -9.82% | -5.15% | -4.67% |
| 2019 | +26.56% | +32.31% | -5.75% |
| 2020 | +19.25% | +15.64% | +3.61% |
| 2021 | +26.06% | +31.26% | -5.20% |
| 2022 | -11.05% | -18.99% | +7.94% |
| 2023 | +19.73% | +26.00% | -6.27% |
| 2024 | +17.99% | +25.28% | -7.29% |
| 2025 | +19.72% | +17.88% | +1.84% |
2009: The best year
2009 produced +77.16% vs SPY +24.73%. That's a 52-point gap. After the financial crisis, Financial Services and Real Estate were two of the most battered sectors on the LSE. The UK had deep exposure to global banking through Barclays, HSBC, and Lloyds. When those sectors recovered in 2009, they recovered hard.
The pattern mirrors the US: the strategy had rotated into the most destroyed sectors in 2008, and 2009 was the rebound. The UK version was even more violent because UK Financials had fallen further than US Financials relative to the overall market.
2000 and 2003-2004: Early strong years
2000 shows +4.41% vs a -10.50% SPY. The dot-com bust hit US tech stocks hardest. The LSE had lower tech exposure than US exchanges, which helped the overall UK market, but the sector reversion approach picked up gains from beaten-down UK defensives and commodity sectors.
2003-2004 shows the post-crash recovery: +39.08% in 2003, +21.67% in 2004. Both years beat SPY by double digits. Energy and Basic Materials were left for dead in 2001-2002. The strategy was fully loaded in both.
2006 extended the strong run: +33.09% vs SPY +13.65%, a 19-point gap. That year, UK Energy stocks benefited from the ongoing oil price rise, and Financial Services were near peak. The strategy had rotated into both.
2013-2015: The worst three years
The 2013-2015 period is the most damaging stretch in the full 26-year record. Three consecutive years of severe underperformance:
- 2013: -2.59% portfolio vs +27.77% SPY, -30.36% excess
- 2014: -9.07% portfolio vs +14.50% SPY, -23.57% excess
- 2015: -15.69% portfolio vs -0.12% SPY, -15.57% excess
Cumulative excess over three years: roughly -70 percentage points.
What happened. The US market in 2013 was driven by tech and growth stocks posting their best year in over a decade. UK large caps, which are structurally heavier in Energy, Mining, and Financials, couldn't match that. The strategy on LSE was rotating into the worst-performing UK sectors, which in 2013 were names like Rio Tinto, Anglo American, and struggling UK banks, while the market's gains were coming from sectors the LSE barely has.
2014-2015 added commodity price collapse to the problem. Oil fell roughly 60% from mid-2014 to early 2016. Iron ore and copper fell sharply too. The strategy kept reloading into Energy and Basic Materials, exactly what the signal required, and both kept declining. This is the same dynamic as US Energy in 2015, but on LSE it ran longer and across more sectors simultaneously.
2016: Post-Brexit recovery
2016 returned +38.36% vs SPY +14.45%. The Brexit vote in June 2016 hammered sterling and initially hurt UK equities in GBP terms. But the devaluation of sterling was a tailwind for FTSE-listed multinationals that earn in USD and other currencies. Energy majors like BP and Shell, which report and pay dividends in USD, saw GBP-translated earnings jump. The strategy was well-positioned in Energy going into the year.
The 2016 result also reflects the recovery in commodity prices that bottomed in early 2016. The same sectors that had dragged the strategy down in 2014-2015 recovered sharply. That's the mean reversion pattern working: buy what's beaten down, wait for the recovery. It just took two-plus years longer than the historical average.
2022: One of the few recent wins
2022 was -11.05% for the strategy vs -18.99% for SPY, a +7.94% excess. UK Energy stocks were among the global leaders in 2022 as oil and gas prices surged following Russia's invasion of Ukraine. BP and Shell reported record profits. The strategy had been rotating into Energy intermittently since the COVID selloff, and 2022 delivered the payoff.
Backtest Methodology
| Parameter | Choice |
|---|---|
| Universe | LSE, Market Cap > £500M |
| Signal | Bottom 2 sectors by equal-weighted 12-month trailing return |
| Portfolio | All qualifying stocks in selected sectors, equal weight |
| Rebalancing | Quarterly (January, April, July, October) |
| Cash rule | Hold cash if < 5 stocks qualify |
| Benchmark | S&P 500 Total Return (SPY) |
| Period | 2000-2025 (26 years, 104 quarters) |
| Data | Ceta Research (FMP financial data warehouse) |
Limitations
Currency mismatch. Returns are in GBP, the benchmark is in USD. When sterling weakens against the dollar (as it did sharply after Brexit), a GBP-denominated 6.47% CAGR looks even weaker to a USD-based investor. A UK investor benchmarking against FTSE 100 Total Return would see different relative numbers. The -1.56% shortfall vs SPY is partly a currency story.
Energy concentration. Energy was selected in 34 of 104 quarters, one in three periods. This makes the strategy's performance heavily dependent on oil and commodity cycles. A strategy with 34% Energy exposure over 26 years isn't sector-diversified in any meaningful sense. When Energy recovers (2009, 2016, 2022), the portfolio wins. When it doesn't (2013-2015), losses compound.
LSE sector structure. The London Stock Exchange is disproportionately weighted toward Financials, Energy, Mining, and Pharmaceuticals compared to US exchanges. Tech is underrepresented. A sector rotation approach built on 12-month trailing returns on LSE is effectively rotating between commodity, financial, and real estate cycles. The growth-driven recoveries that generate alpha in the US simply aren't available here.
Brexit as a structural break. The 2016 Brexit vote changed UK market dynamics. Sterling devaluation helped multinationals in 2016 but created prolonged uncertainty that depressed domestic-oriented UK stocks for years. A 26-year backtest spans two regulatory and currency regimes. What worked before Brexit and after Brexit may differ.
High volatility, low Sharpe. The strategy carries 23.97% annualized volatility for a 6.47% CAGR. The Sharpe of 0.124 is well below the S&P 500's 0.357. From a risk-adjusted standpoint, the strategy doesn't justify its volatility on the LSE.
Survivorship bias. Exchange membership uses current profiles, not historical. Delisted companies, including failures, aren't tracked over time. Strategies with high exposure to distressed sectors will face this bias most acutely.
No transaction costs. The backtest doesn't include transaction costs or market impact. With 148 stocks and quarterly rebalancing, turnover is meaningful on a per-trade basis even if the per-stock size is smaller than the US version.
Takeaway
Sector mean reversion on LSE large caps delivers 6.47% CAGR over 26 years and stays invested nearly all the time. That's a real return stream. But it trails the S&P 500 by 1.56% annually, carries higher volatility, and produces a Sharpe ratio of 0.124 against the market's 0.357.
The core problem isn't the strategy. It's the market. The LSE's structural tilt toward commodity cycles and Financials means the strategy rotates through the same Energy and Materials trades repeatedly. When those sectors recover (2009, 2016, 2022), the returns are large. When they don't (2013-2015), the losses are equally large. The win rate of 47.12% means you're trailing the index in more quarters than you're beating it.
For a UK investor benchmarking against UK equities rather than the S&P 500, the strategy's sector rotation may still provide diversification value within a GBP portfolio. But compared to a global benchmark, the headwinds are structural. The UK market simply doesn't have the growth-driven sectors that power mean reversion alpha on US and Asian exchanges.
Part of a Series
This analysis is part of our Sector Mean Reversion global exchange comparison. We tested the same strategy across multiple exchanges: - Sector Mean Reversion on US Stocks (NYSE + NASDAQ + AMEX) - Sector Mean Reversion on Indian Stocks (BSE + NSE) - Sector Mean Reversion on Korean Stocks (KSC) - Sector Mean Reversion on Taiwanese Stocks (TAI + TWO) - Sector Mean Reversion on Swedish Stocks (STO) - Sector Mean Reversion: Global Exchange Comparison
References
- Moskowitz, T. & Grinblatt, M. (1999). "Do Industries Explain Momentum?" Journal of Finance, 54(4), 1249-1290.
Run This Screen Yourself
Via Python:
import requests, time

API_KEY = "your_api_key"  # get one at cetaresearch.com
BASE = "https://tradingstudio.finance/api/v1"

query = """
WITH prices AS (
    SELECT e.symbol, e.adjClose, CAST(e.date AS DATE) AS trade_date
    FROM stock_eod e
    JOIN profile p ON e.symbol = p.symbol
    WHERE p.sector IS NOT NULL AND p.sector != ''
      AND p.marketCap > 500000000
      AND p.exchange IN ('LSE')
      AND CAST(e.date AS DATE) >= CURRENT_DATE - INTERVAL '400' DAY
      AND e.adjClose IS NOT NULL AND e.adjClose > 0
),
recent AS (
    SELECT symbol, adjClose AS recent_price
    FROM prices
    QUALIFY ROW_NUMBER() OVER (PARTITION BY symbol ORDER BY trade_date DESC) = 1
),
year_ago AS (
    SELECT symbol, adjClose AS old_price
    FROM prices
    WHERE trade_date <= CURRENT_DATE - INTERVAL '252' DAY
    QUALIFY ROW_NUMBER() OVER (PARTITION BY symbol ORDER BY trade_date DESC) = 1
),
stock_returns AS (
    SELECT r.symbol, pr.sector,
        (r.recent_price / ya.old_price - 1) * 100 AS return_12m
    FROM recent r
    JOIN year_ago ya ON r.symbol = ya.symbol
    JOIN profile pr ON r.symbol = pr.symbol
    WHERE ya.old_price > 0 AND r.recent_price > 0
      AND (r.recent_price / ya.old_price - 1) BETWEEN -0.99 AND 5.0
)
SELECT pr.sector,
    ROUND(AVG(sr.return_12m), 2) AS avg_return_12m_pct,
    COUNT(DISTINCT sr.symbol) AS n_stocks,
    ROW_NUMBER() OVER (ORDER BY AVG(sr.return_12m) ASC) AS rank_worst
FROM stock_returns sr
JOIN profile pr ON sr.symbol = pr.symbol
GROUP BY pr.sector
HAVING COUNT(DISTINCT sr.symbol) >= 5
ORDER BY avg_return_12m_pct ASC
"""

resp = requests.post(f"{BASE}/data-explorer/execute", headers={
    "X-API-Key": API_KEY, "Content-Type": "application/json"
}, json={
    "query": query,
    "options": {"format": "json", "limit": 100},
    "resources": {"memoryMb": 16384, "threads": 6}
})
task_id = resp.json()["taskId"]

while True:
    result = requests.get(f"{BASE}/tasks/data-query/{task_id}",
                          headers={"X-API-Key": API_KEY}).json()
    if result["status"] in ("completed", "failed"):
        break
    time.sleep(2)

print("LSE sector rankings (worst to best, 12-month return):")
for r in result["result"]["rows"]:
    flag = " <-- BUY" if r["rank_worst"] <= 2 else ""
    print(f"#{r['rank_worst']} {r['sector']:30s} {r['avg_return_12m_pct']:+.1f}%  ({r['n_stocks']} stocks){flag}")
Get your API key at cetaresearch.com. The full backtest code (Python + DuckDB) is on GitHub.
Part of a Series: US | Global | Global | US | Thailand | Taiwan | Taiwan | Switzerland
Data: Ceta Research, FMP financial data warehouse. Universe: LSE, market cap > £500M. Quarterly rebalance, equal weight, 2000-2025. Returns in GBP.


