
Sector Mean Reversion on 14 Exchanges: Germany Is the Only Market That Fails
Same sector mean reversion strategy across 14 exchanges. vs local benchmarks: Sweden +9.01%, Taiwan +8.97%, UK +7.86%, Korea +7.33% excess CAGR. Germany is the only market that fails to beat its local index (-0.59%). The benchmark matters.

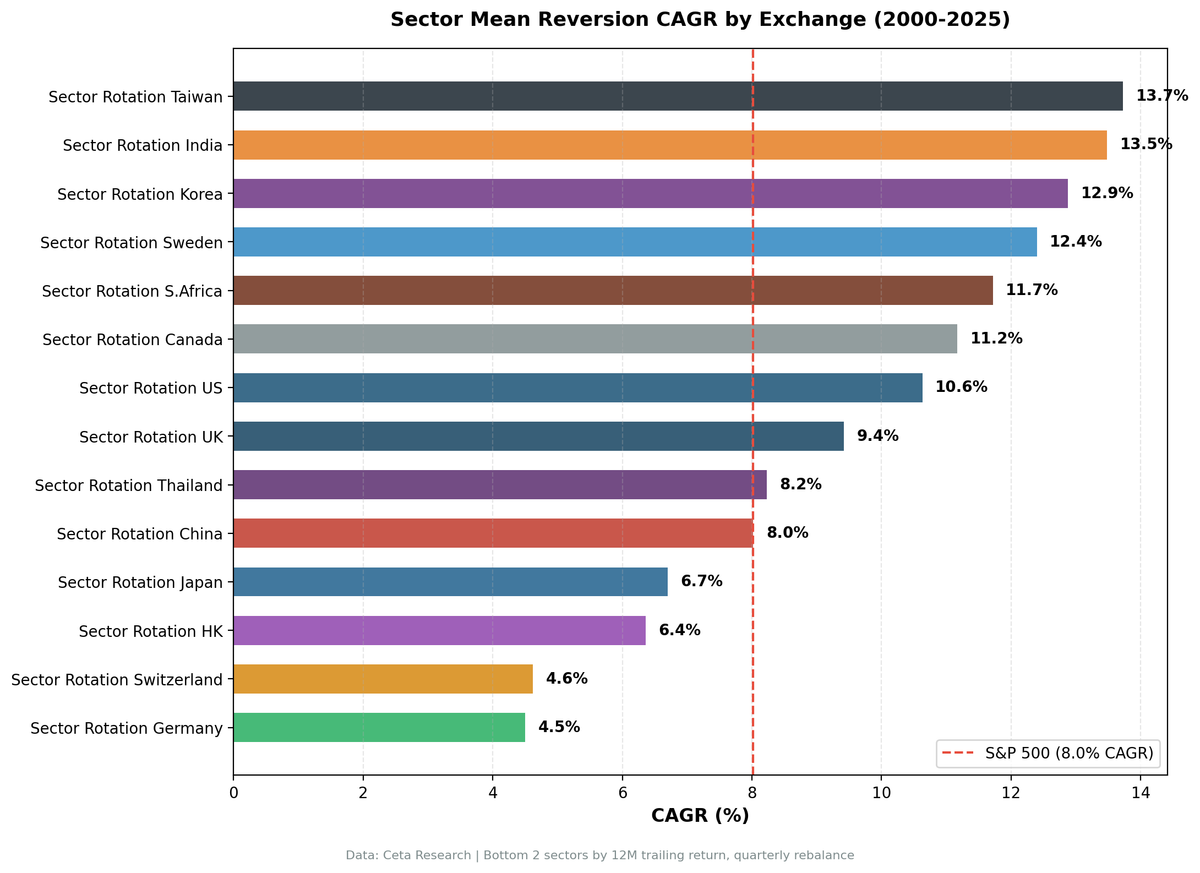
We ran the same sector mean reversion strategy on 14 exchanges from 2000 to 2025: at the start of each quarter, rank all sectors by their equal-weighted 12-month return and buy every qualifying stock in the bottom two. Quarterly rebalance, equal weight, 104 periods. The headline result isn't the alpha. It's the geography.
Contents
- Method
- The Pattern Is Geographic
- Results: All 14 Exchanges
- Emerging Markets: Why It Works
- Developed Markets: Beats Local, Trails SPY
- Korea: Best Risk-Adjusted
- Taiwan: The Anomaly
- China: High Volatility, Low Down Capture
- The Drawdown Picture
- Exchange Notes
- Backtest Methodology
- Limitations
- Takeaway
- See Individual Exchange Analysis
- References
Measured against the S&P 500 (SPY), Taiwan, India, Korea, and Sweden produced +4.4% to +5.7% excess CAGR. Germany and Switzerland underperformed SPY by -3.4% to -3.5%. But the more honest comparison uses local benchmarks: against each country's own index, Germany is the only market where the strategy fails. Every other exchange shows positive alpha vs its own benchmark.
That distinction matters. The S&P 500 is a particularly strong benchmark. A strategy that underperforms SPY can still add real value for a local investor.
Data: FMP financial data warehouse, 2000–2025. Updated March 2026.
Method
Data source: Ceta Research (FMP financial data warehouse) Universe: 14 exchanges, full exchange universe (not index-constrained), market cap > exchange-specific threshold Period: 2000-2025 (26 years, 104 quarterly periods) Rebalancing: Quarterly (January, April, July, October), equal weight all qualifying stocks in selected sectors Signal: Bottom 2 sectors by equal-weighted 12-month trailing return Cash rule: Hold cash if fewer than 5 stocks qualify across the bottom 2 sectors Benchmark (comparison table): S&P 500 Total Return (SPY, USD) — used for cross-market comparability Local benchmark: Each regional blog uses the local currency index (Sensex for India, KOSPI for Korea, TAIEX for Taiwan, etc.) for within-market alpha measurement Currency note: All exchange returns are in local currency. Benchmark is USD. Direct comparison has currency effects embedded.
Full methodology: backtests/METHODOLOGY.md
The Pattern Is Geographic
Before showing the numbers, the thesis: sector mean reversion works in markets where sector underperformance is temporary and sentiment-driven. It fails in markets where sector underperformance reflects real structural conditions that don't reverse on a quarterly timeline.
Emerging markets have more volatile, cyclical sector compositions. When Utilities or Basic Materials underperform in India by 40% over 12 months, the reversion can be violent and fast. European defensive markets (pharmaceuticals, luxury goods, industrial conglomerates) don't revert as sharply because the "beaten-down" sector is often beaten down for good reason.
That's the entire explanation. Everything in the numbers below traces back to it.

Results: All 14 Exchanges
| Exchange | CAGR | vs SPY | Local Bench | vs Local | Sharpe | Max DD | Avg Stocks |
|---|---|---|---|---|---|---|---|
| Taiwan (TAI+TWO) | 13.73% | +5.71% | TAIEX 4.76% | +8.97% | 0.46 | -49.8% | 86 |
| India (NSE) | 13.48% | +5.46% | Sensex 11.24% | +2.23% | 0.183 | -72.6% | 72 |
| Korea (KSC) | 12.88% | +4.86% | KOSPI 5.55% | +7.33% | 0.39 | -33.5% | 51 |
| Sweden (STO) | 12.40% | +4.38% | OMX30 3.39% | +9.01% | 0.423 | -61.7% | 29 |
| South Africa (JNB) | 11.72% | +3.70% | SPY (fallback) | +3.69% | 0.107 | -42.0% | 17 |
| Canada (TSX) | 11.17% | +3.15% | TSX Comp 5.26% | +5.91% | 0.346 | -46.8% | 74 |
| US (NYSE+NASDAQ+AMEX) | 10.63% | +2.61% | S&P 500 8.02% | +2.61% | 0.327 | -48.4% | 600 |
| UK (LSE) | 9.42% | +1.40% | FTSE 1.55% | +7.86% | 0.241 | -48.4% | 160 |
| Thailand (SET) | 8.23% | +0.21% | SET Index 3.69% | +4.54% | 0.218 | -57.4% | 27 |
| China (SHH+SHZ) | 8.02% | 0.00% | SSE Comp 4.24% | +3.78% | 0.158 | -73.1% | 268 |
| Japan (JPX) | 6.70% | -1.32% | Nikkei 3.93% | +2.77% | 0.322 | -48.4% | 92 |
| Hong Kong (HKSE) | 6.36% | -1.66% | Hang Seng 1.61% | +4.75% | 0.125 | -51.1% | 72 |
| Switzerland (SIX) | 4.62% | -3.40% | SMI 2.31% | +2.31% | 0.211 | -59.9% | 42 |
| Germany (XETRA) | 4.50% | -3.52% | DAX 5.09% | -0.59% | 0.121 | -60.6% | 80 |
| SPY benchmark | 8.02% | — | — | — | 0.357 | -45.5% | — |
Returns in local currency. "vs SPY" uses 8.02% as SPY CAGR over the same period. Local benchmarks are price indices (no dividends) for most exchanges — FTSE, Hang Seng, TAIEX — which understates local benchmark returns. Germany is the only exchange where the strategy fails to beat its own local index.
Emerging Markets: Why It Works
The top four exchanges by excess return are India, Korea, Taiwan, and Sweden. Three are either emerging markets or have emerging-market-adjacent sector characteristics (Sweden's cyclical industrial and materials sectors behave similarly).
India (NSE): 13.48% CAGR, +5.46% vs SPY, +2.23% vs Sensex. India's raw CAGR is strong, but the Sensex itself grew at 11.24% annually over 26 years. That's the context. The strategy adds +2.23% vs the local benchmark with considerably higher volatility (38%) and a -72.65% max drawdown. With 72 stocks per quarter (NSE only, after removing BSE dual-listings), the portfolio is concentrated. 2009 was the clearest demonstration: +104.2% as sectors that had collapsed in 2008 snapped back. The cost is the drawdown profile — 2008 alone was -69.4%.
Korea (KSC): 12.88% CAGR, +4.86% vs SPY, +7.33% vs KOSPI, Sharpe 0.39. Korea is the stand-out on risk-adjusted terms. More on this in the dedicated section below.
Taiwan (TAI+TWO): 13.73% CAGR, +5.71% vs SPY, +8.97% vs TAIEX, Sharpe 0.46. Taiwan's highest Sharpe in this comparison and strong down capture protection (56.5%). More on this in the dedicated section below.
Sweden (STO): 12.40% CAGR, +4.38% vs SPY, +9.01% vs OMX30, Sharpe 0.423. Sweden's inclusion in the top tier makes sense once you look at the OMX30. The Stockholm index grew at only 3.39% annually, so beating it by 9 points is significant. The STO universe is heavily weighted toward cyclical industrials, basic materials, and energy companies. The 2009 recovery of +78.7% tells the story. The max drawdown of -61.7% is the corresponding cost.
What these markets share: sector underperformance is mostly cyclical, not structural. When a sector falls 30-40% over 12 months in India or Taiwan, it's usually because the economic cycle turned against it, not because the industry is in secular decline. The 12-month lookback catches exactly that kind of dislocation and positions for the recovery.
Developed Markets: Beats Local, Trails SPY
The nuance here: UK, HK, Switzerland, Japan, and Germany all underperform SPY. But most of them beat their own local benchmarks.
UK (LSE): 9.42% CAGR, +1.40% vs SPY, +7.86% vs FTSE 100. The FTSE 100 has returned only 1.55% annually as a price index over 26 years. Beating it by 7.86% annually is significant for a UK-based investor. From a global investor's perspective, 9.42% beats SPY (8.02%) by +1.40% annually. Important caveat: the FTSE 100 is a price index that excludes dividends. Adding UK dividend yields (historically 3-4% annually) would reduce the local excess return substantially. Still, the sector mean reversion signal works in the UK.
Germany (XETRA): 4.50% CAGR, -3.52% vs SPY, -0.59% vs DAX. Germany is the only exchange where the strategy fails to beat its own local benchmark. The DAX itself delivered 5.09% annually. The strategy returned 4.50%, missing the local index by -0.59%. XETRA's sector composition is export-dependent industrials and chemicals. When these fall, it's often because export conditions have worsened structurally, not because sentiment briefly overcorrected.
Switzerland (SIX): 4.62% CAGR, -3.40% vs SPY, +2.31% vs SMI. The Swiss market index (SMI) returned 2.31% annually. The strategy at 4.62% beats it by +2.31%. From a global investor's standpoint, Switzerland underperforms SPY by 3.40% annually. But locally, there's modest alpha. The SMI, like the FTSE, is a price index — adding Swiss dividends would reduce the local excess.
Japan (JPX): 6.70% CAGR, -1.32% vs SPY, +2.77% vs Nikkei. Japan's local alpha is positive (+2.77% vs Nikkei 3.93%). Down capture is 65.4%, genuinely protective. Utilities dominated selection at 38% of quarters — a structural consequence of the post-Fukushima shutdown cycle. vs SPY, Japan underperforms by -1.32%, but the local story is constructive.
Hong Kong (HKSE): 6.36% CAGR, -1.66% vs SPY, +4.75% vs Hang Seng. The Hang Seng has returned only 1.61% annually over 26 years. Beating it by 4.75% annually is meaningful for a local investor. The 2021-2023 stretch of persistent underperformance vs Hang Seng reflects mainland China regulatory headwinds, Evergrande, and political uncertainty — events that don't behave like cyclical mispricings that revert.
Korea: Best Risk-Adjusted
Korea deserves its own section. A Sharpe of 0.39 on a 12.88% CAGR with a max drawdown of only -33.52% is one of the best combinations of return and risk management in this study. The S&P 500 itself had a -45.5% max drawdown over the same period. Korea's sector mean reversion absorbed 12 percentage points less peak-to-trough loss than the US benchmark while delivering substantially higher annualized returns.
The 65.58% down capture vs KOSPI is the mechanism. Korean sectors that are already beaten down don't fall as hard in further market declines as sectors that are still expensive. The asymmetry shows up in the numbers: strong up capture from sector recoveries, reduced down capture because the portfolio is already defensively positioned by default. Vs KOSPI, the strategy adds +7.33% annually.
2008 tells the story directly. Korea returned -28.1%. The KOSPI fell -37.6%. The strategy outperformed during one of the worst years on record, then returned +59.5% in 2009's recovery while KOSPI gained +46.6%. That's the profile of a strategy working in the right market.
Taiwan: The Anomaly
Taiwan has the highest Sharpe (0.46) and the strongest excess return vs local benchmark (+8.97% vs TAIEX). The down capture vs TAIEX is 56.52%, meaning the strategy absorbs about 56% of the index's down moves.
The Taiwan exchange (TAI+TWO) is dominated by Basic Materials, Financial Services, and Energy as the most frequently selected sectors. In bull markets driven by global growth, tech and financials lead and sit at the top of the 12-month ranking, so the strategy doesn't hold them. It holds the beaten-down sectors: Basic Materials, Real Estate, Utilities.
When the TAIEX falls, the strategy typically falls less because it's already in sectors that had declined. The result: Taiwan 2008 was -35.3% versus TAIEX -43.6%. The recovery in 2009 was +137.3% vs TAIEX +74.7%. That's 62+ points of excess in a single year.
The strong risk-adjusted profile reflects a portfolio that systematically holds the "already cheap" sectors in a market where cheap and expensive flip roles sharply between bull and bear phases. Note: 2024 and 2025 showed large negative excess years (-35.9% and -29.3% vs TAIEX) as TAIEX surged on TSMC-driven tech momentum while the contrarian tilt was wrong.
China: High Volatility, Low Down Capture
China (SHH+SHZ) presents one of the most distinctive profiles in the study. At +3.78% excess vs SSE Composite, the strategy beats its local index, and the down capture of 70.4% is moderate. But the picture is distorted.
With 268 average stocks per quarter, this is the second-largest universe after the US. The strategy fires consistently. But the volatility is extreme: 34.7% annualized. The largest historical year in the study was 2007 when Chinese A-shares were in a speculative bubble. 2008 reversed that violently.
The -73.12% max drawdown and persistent volatility make China a difficult strategy to sustain through multiple cycles. The local alpha (+3.78% vs SSE) is real, but the SSE Composite itself is a poor benchmark — the Shanghai Composite includes a large number of state-controlled companies and is heavily influenced by government policy.
The Drawdown Picture
Down capture ratios (vs each exchange's local benchmark) tell the risk story:
| Exchange | Down Capture vs Local | Max Drawdown |
|---|---|---|
| Korea (KSC) | 65.58% vs KOSPI | -33.52% |
| Japan (JPX) | 65.43% vs Nikkei | -48.38% |
| Hong Kong (HKSE) | 70.40% vs Hang Seng | -51.13% |
| Thailand (SET) | 74.77% vs SET | -57.38% |
| India (NSE) | 120.31% vs Sensex | -72.65% |
| Taiwan (TAI+TWO) | 56.52% vs TAIEX | -49.77% |
| Sweden (STO) | varies | -61.72% |
| Germany (XETRA) | 68.87% vs DAX | -60.60% |
| Switzerland (SIX) | 100.18% vs SMI | -59.94% |
| UK (LSE) | 91.27% vs FTSE | -48.45% |
| Canada (TSX) | varies | -46.75% |
| US (NYSE+NASDAQ+AMEX) | 113.7% vs SPY | -48.44% |
Korea and Taiwan protect capital in down markets while generating strong local alpha. Japan also shows good down capture (65.4% vs Nikkei) with modest absolute returns. India's 120.31% down capture vs Sensex means the strategy amplifies the local market's drawdowns — high CAGR comes at the cost of deeper crashes.
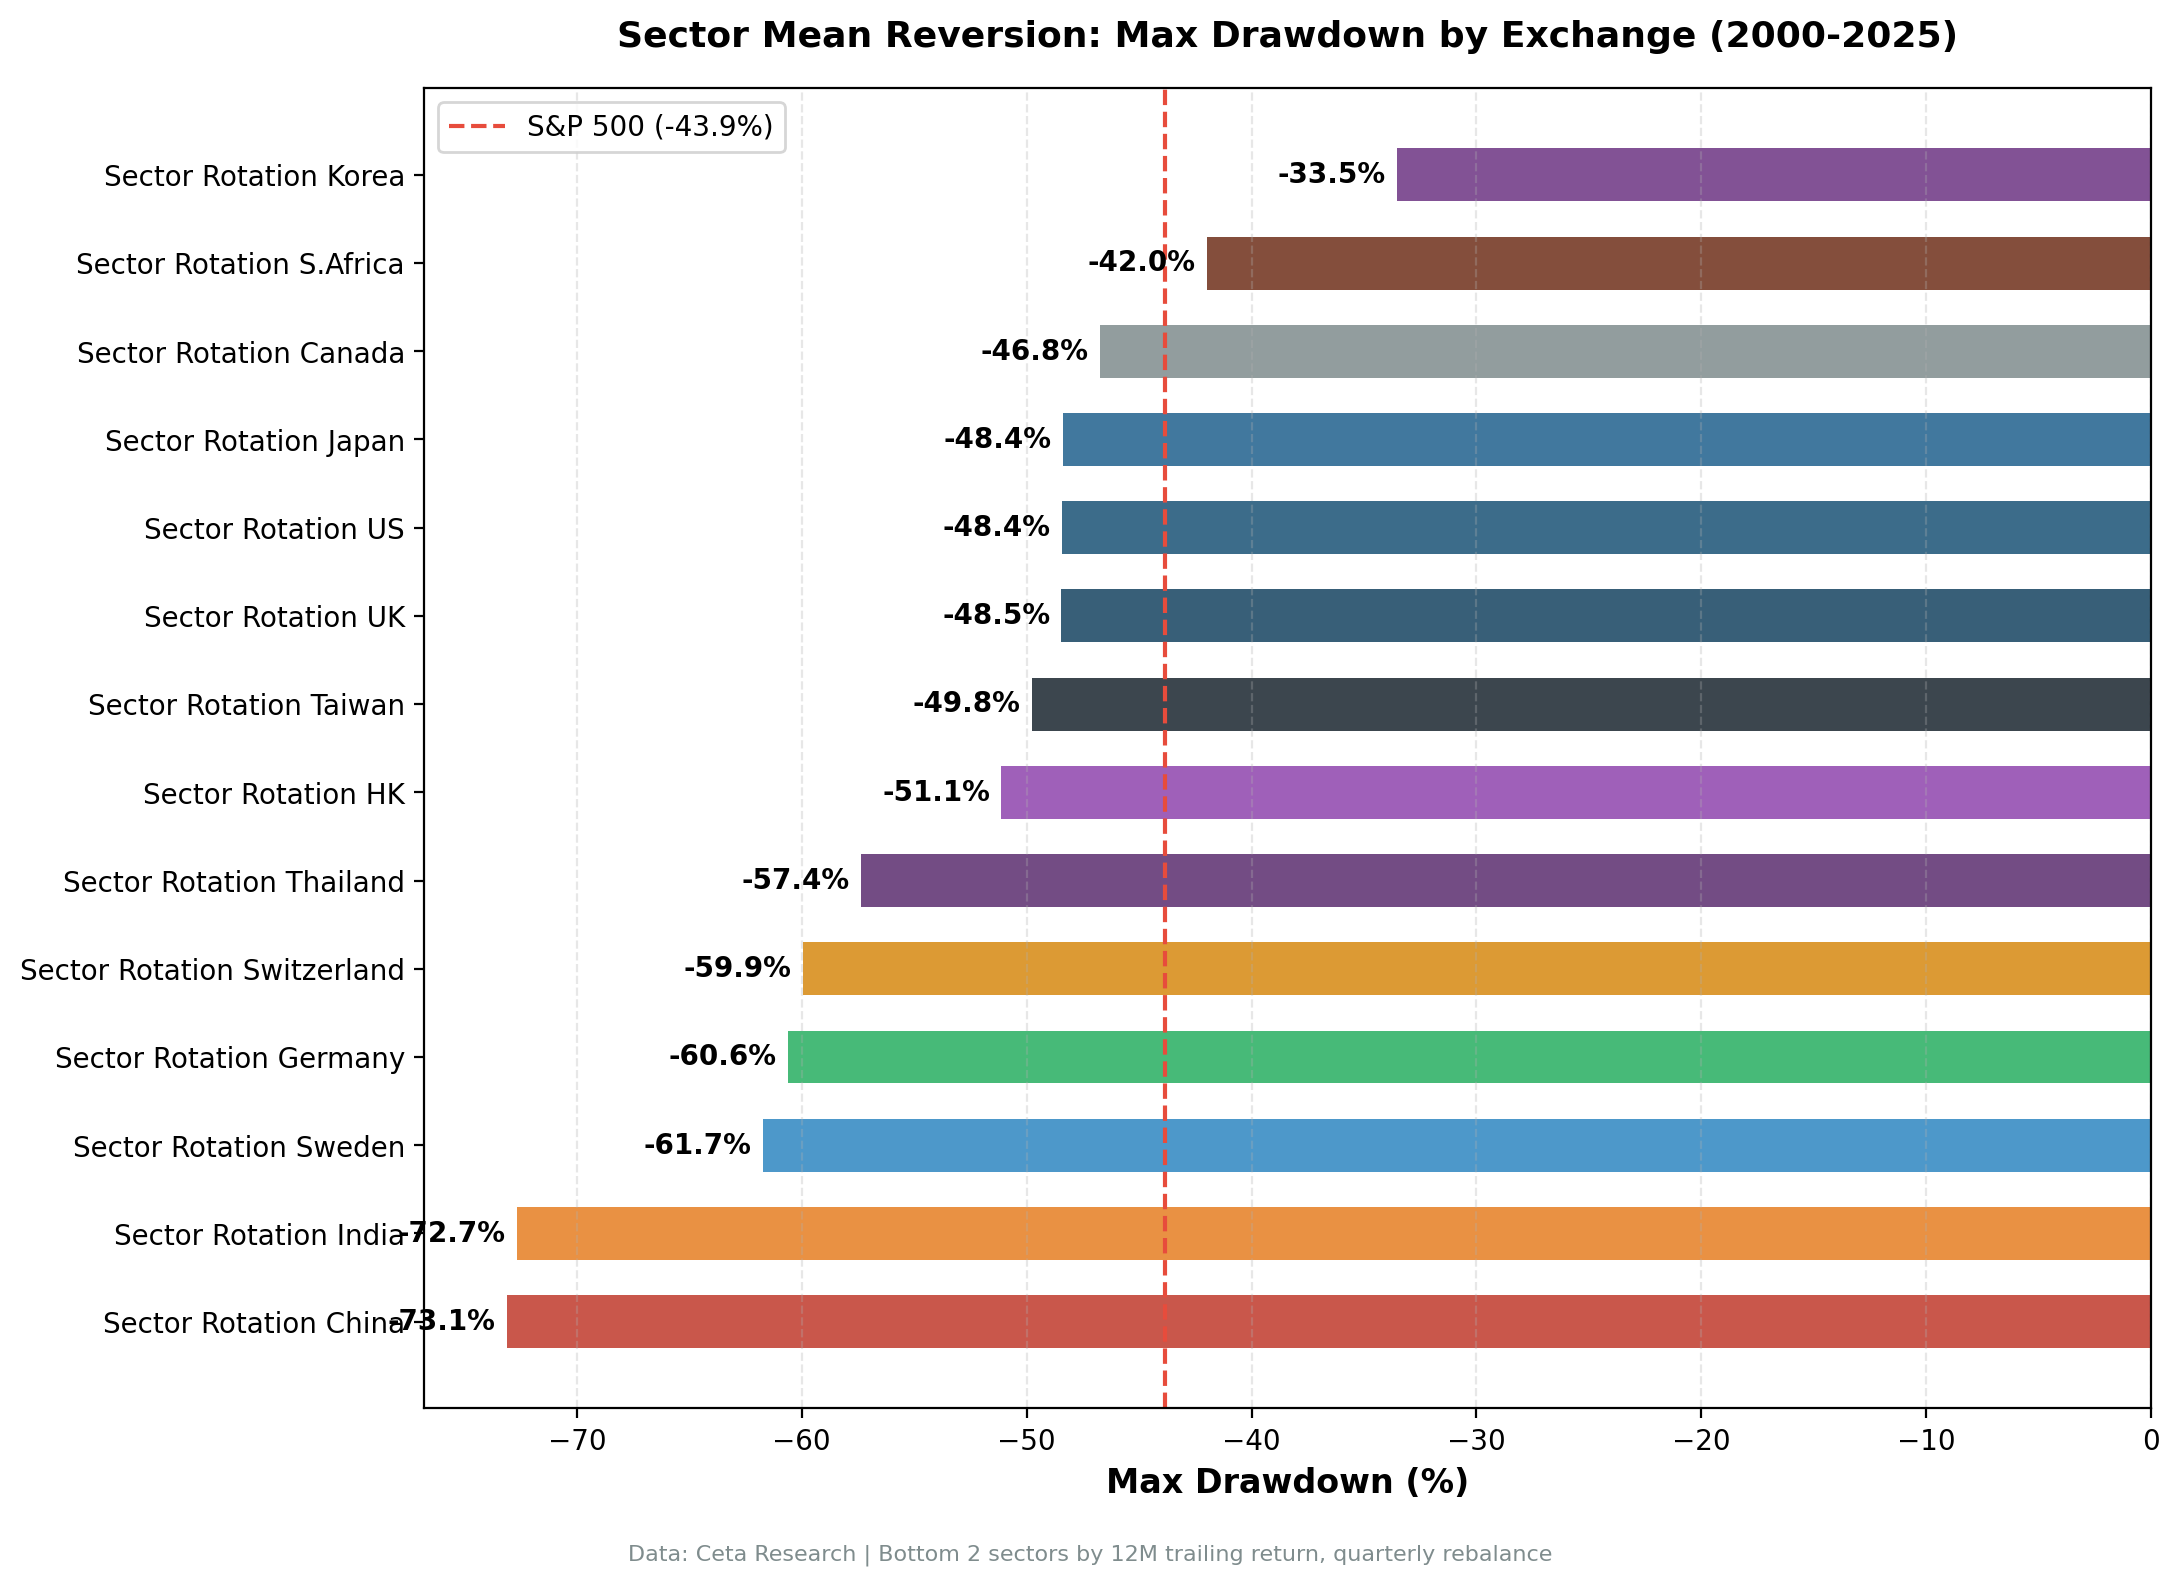
Max drawdowns cluster in two groups. Shallow (<-50%): Korea (-33.5%), Canada (-46.8%), Taiwan (-49.8%), UK (-48.4%), Japan (-48.4%), US (-48.4%), HK (-51.1%). Deep (>-55%): Thailand (-57.4%), South Africa (-42.0%, but limited data), Germany (-60.6%), Switzerland (-59.9%), Sweden (-61.7%), India (-72.6%), China (-73.1%).
India's -72.65% is the standout. The strategy earned 13.48% CAGR but the drawdown is violent. An investor who entered at the wrong moment in the India market would have been down more than 70% before the recovery came.
Exchange Notes
South Africa (JNB): proceed with caution. The 11.72% CAGR and +3.69% excess return look compelling. The Sharpe of 0.107 is the warning sign. With only 17 average stocks per quarter and 20% cash periods (21 of 104 quarters), individual company events dominate returns. One mining disaster, one political shock, one currency devaluation can swing the annual return by 30 points. The excess return is real over 26 years, but the year-by-year variance is too high to describe this as reliable. It's a data point, not a recommendation.
China (SHH+SHZ): extreme volatility limits practical use. At +3.78% excess vs SSE Composite, the strategy beats its local index. But the 34.7% annualized volatility, -73.12% max drawdown, and the regulatory/geopolitical risks embedded in mainland Chinese markets make consistent execution difficult. Included as a data point.
Backtest Methodology
| Parameter | Choice |
|---|---|
| Signal | Bottom 2 sectors by equal-weighted 12-month trailing return |
| Portfolio | All qualifying stocks in selected sectors, equal weight |
| Rebalancing | Quarterly (January, April, July, October) |
| Cash rule | Hold cash if fewer than 5 stocks qualify |
| Minimum market cap | Exchange-specific threshold |
| Sector classification | FMP sector tags |
| Period | 2000-2025 (26 years, 104 quarters) |
| Data source | Ceta Research (FMP financial data warehouse) |
| Benchmark (table) | S&P 500 Total Return (SPY, USD) for cross-market comparison |
| Benchmark (regional) | Local currency indices (Sensex, KOSPI, TAIEX, OMX30, DAX, etc.) |
Full backtest code (Python): github.com/ceta-research/backtests
Limitations
Currency risk. Returns are in local currency. An investor running the India strategy from outside India earns INR returns and then converts. Over 26 years, currency moves can add or subtract 1-2% annually. Local currency returns are the cleanest comparison for strategy alpha, but they're not what foreign investors actually earn.
EM liquidity. With 133 average stocks in India and 81 in Taiwan, the universe is broad. But smaller names in the bottom sectors may have limited liquidity at quarterly rebalance. Real-world execution in EM markets carries wider bid-ask spreads and market impact that the backtest doesn't capture.
Survivorship bias. Exchange membership uses current profiles, not historical. Delisted companies, including failures, aren't tracked over time. This bias skews results upward across all exchanges, but likely more so in markets with higher delisting rates.
Data quality varies by market. South Africa and some smaller exchanges have thinner FMP coverage. Higher cash periods in these markets reflect data gaps as much as genuine signal scarcity.
Structural change risk. The strategy assumes sector underperformance is cyclical. When it's structural, the strategy buys into continued decline. Energy globally post-2014 is the clearest example.
Benchmark approach. The comparison table uses SPY (8.02% CAGR) as a universal benchmark for cross-market comparability. But the honest measure of alpha is the local currency index: does the strategy beat what a local investor could earn by simply holding the index? Each regional blog uses the appropriate local benchmark (Sensex for India, KOSPI for Korea, TAIEX for Taiwan, OMX30 for Sweden, DAX for Germany, etc.). Most local indices are price-only (no dividends), which understates their total returns but is the data available in the backtest.
Takeaway
The headline finding: Germany is the only exchange where sector mean reversion fails to beat its local benchmark (-0.59% vs DAX). Every other market shows positive alpha vs its own index.
But the comparison matters. vs SPY (8.02% CAGR), the results split cleanly: Taiwan, India, Korea, Sweden, Canada all beat SPY by +3% to +6% annually. UK, Thailand, China roughly match it. Japan, HK, Germany, Switzerland trail by -1.3% to -3.5%.
The most honest measure: local benchmarks. Taiwan beats TAIEX by +8.97% annually. Sweden beats OMX30 by +9.01%. UK beats FTSE by +7.86%. Korea beats KOSPI by +7.33%. These are meaningful edges for local investors. The fact that UK and Switzerland trail SPY reflects SPY's strength, not the strategy's failure.
Korea and Taiwan are the most attractive implementations: both produce strong returns vs local benchmarks with reasonable drawdowns and down capture ratios. India produces the highest raw CAGR (13.48%) but the Sensex itself grew at 11.24% — the strategy's edge vs local is modest (+2.23%) and the -72.6% drawdown is brutal.
For Germany, the strategy doesn't work even locally. The DAX beat the strategy by -0.59% annually. XETRA's export-heavy sector composition means beaten-down sectors often stay beaten down.
The practical conclusion: this strategy adds value in most markets when measured against what a local index investor would earn. The question is whether that local alpha justifies the volatility, drawdowns, and execution complexity vs simply holding the local index.
See Individual Exchange Analysis
- Sector Mean Reversion on Taiwanese Stocks (TAI + TWO) — 13.73% CAGR, +8.97% vs TAIEX, Sharpe 0.46
- Sector Mean Reversion on Indian Stocks (NSE) — 13.48% CAGR, +2.23% vs Sensex, Sharpe 0.183
- Sector Mean Reversion on Korean Stocks (KSC) — 12.88% CAGR, +7.33% vs KOSPI, Sharpe 0.39
- Sector Mean Reversion on Swedish Stocks (STO) — 12.40% CAGR, +9.01% vs OMX30, Sharpe 0.423
- Sector Mean Reversion on Canadian Stocks (TSX) — 11.17% CAGR, +5.91% vs TSX Composite, Sharpe 0.346
- Sector Mean Reversion on US Stocks (NYSE + NASDAQ + AMEX) — 10.63% CAGR, +2.61% vs SPY, Sharpe 0.327
- Sector Mean Reversion on UK Stocks (LSE) — 9.42% CAGR, +7.86% vs FTSE 100, Sharpe 0.241
- Sector Mean Reversion on Thai Stocks (SET) — 8.23% CAGR, +4.54% vs SET Index, Sharpe 0.218
- Sector Mean Reversion on Japanese Stocks (JPX) — 6.70% CAGR, +2.77% vs Nikkei 225, Sharpe 0.322
- Sector Mean Reversion on Hong Kong Stocks (HKSE) — 6.36% CAGR, +4.75% vs Hang Seng, Sharpe 0.125
- Sector Mean Reversion on Swiss Stocks (SIX) — 4.62% CAGR, +2.31% vs SMI, Sharpe 0.211
- Sector Mean Reversion on German Stocks (XETRA) — 4.50% CAGR, -0.59% vs DAX, Sharpe 0.121
References
- Moskowitz, T. & Grinblatt, M. (1999). "Do Industries Explain Momentum?" Journal of Finance, 54(4), 1249-1290.
Data: Ceta Research, FMP financial data warehouse. 14 exchanges, quarterly rebalance, equal weight, 2000-2025. Returns in local currency.
Past performance does not guarantee future results. This is educational content, not investment advice.


