
Sector Mean Reversion on Thai Stocks (SET): 8.85% CAGR, +5.15% vs SET Index
Sector mean reversion on SET large caps from 2000 to 2025: 8.85% CAGR against the SET Index's 3.69%, a +5.15% annual excess with 70.85% down capture. It also beats the index on drawdown, -42.36% against -48.10%. Small universe at 26 average stocks, 6 cash periods of 104.

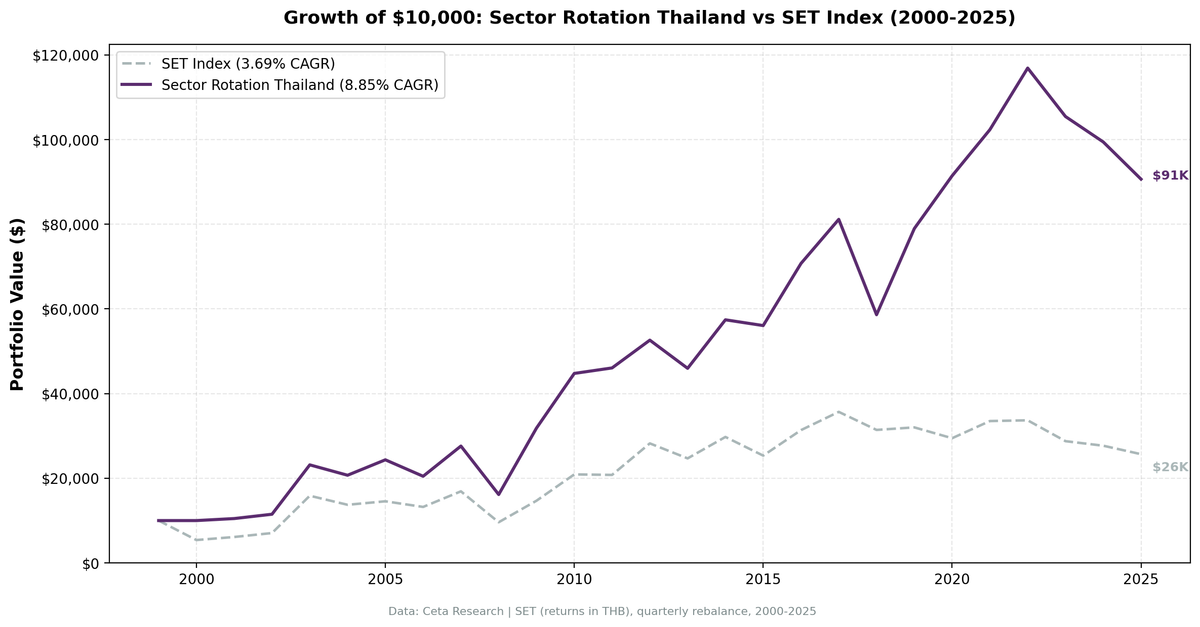
Thailand's sector rotation strategy returned 8.85% annually from 2000 to 2025, in THB, against the SET Index's 3.69%. The +5.15% annual excess over the local benchmark is meaningful, and the risk numbers back it up: a 70.85% down capture and a max drawdown of -42.36% against the index's own -48.10%. The strategy beat the SET on return, on Sharpe (0.252 vs 0.051) and on worst loss. The trade-off is a small universe of 26 stocks on average, 6 cash quarters out of 104, and three consecutive losing years from 2023 to 2025.
Contents
- Method
- What Is Sector Mean Reversion?
- Run This Screen Yourself
- What We Found
- Most Selected Sectors (of 104 quarters)
- Notable Years
- Full Annual Returns
- Backtest Methodology
- Limitations
- Takeaway
- Part of a Series
- References
Data: FMP financial data warehouse, 2000-2025. Updated August 2026.
Method
Data source: Ceta Research (FMP financial data warehouse) Universe: SET (Stock Exchange of Thailand), market cap > THB 5B (~USD $140M) Period: 2000-2025 (26 years, 104 quarterly periods) Rebalancing: Quarterly (January, April, July, October) Signal: Buy all stocks in the bottom 2 sectors by 12-month trailing equal-weighted return Portfolio construction: Equal weight all qualifying stocks in selected sectors Benchmark: SET Index (^SET.BK) Cash rule: Hold cash if fewer than 5 sectors qualify, or fewer than 10 stocks pass the filters Currency note: Returns are in THB (local currency). Benchmark is SET Index (^SET.BK) in THB.
This is a pure price signal. No fundamental data is used, so there's no reporting lag to model. Entry is at the next available close after the signal date, not the signal-day close. Full methodology: backtests/METHODOLOGY.md
What Is Sector Mean Reversion?
The strategy buys the two most out-of-favor sectors by trailing 12-month return at the start of each quarter. The thesis is that sector underperformance is partly cyclical: sectors that have fallen hardest often recover as sentiment normalizes, credit conditions ease, or earnings troughs pass.
Thailand adds a specific context to this. SET is an export-driven, commodity-influenced market. Energy, Materials and Industrials cycle through extended droughts tied to global commodity prices, regional trade flows and domestic political cycles. When those sectors fall out of favor, the oversell can be deep, and the recovery, when it comes, can be fast. The 2009 rebound and the 2019-2020 stretch in this data are the clearest examples.
Run This Screen Yourself
The current sector rankings and stock screen are live on Ceta Research Data Explorer. Run the two queries below in sequence.
Step 1: Rank sectors by 12-month trailing return (SET universe)
WITH prices AS (
    SELECT
        e.symbol,
        e.adjClose,
        CAST(e.date AS DATE) AS trade_date
    FROM stock_eod e
    JOIN profile p ON e.symbol = p.symbol
    WHERE p.sector IS NOT NULL
      AND p.sector != ''
      AND p.marketCap > 5000000000
      AND p.exchange IN ('SET')
      AND CAST(e.date AS DATE) >= CURRENT_DATE - INTERVAL '400' DAY
      AND e.adjClose IS NOT NULL
      AND e.adjClose > 0
),
recent AS (
    SELECT symbol, adjClose AS recent_price, trade_date AS recent_date
    FROM prices
    QUALIFY ROW_NUMBER() OVER (PARTITION BY symbol ORDER BY trade_date DESC) = 1
),
year_ago AS (
    SELECT symbol, adjClose AS old_price, trade_date AS old_date
    FROM prices
    WHERE trade_date <= CURRENT_DATE - INTERVAL '252' DAY
    QUALIFY ROW_NUMBER() OVER (PARTITION BY symbol ORDER BY trade_date DESC) = 1
),
stock_returns AS (
    SELECT r.symbol, pr.sector,
           (r.recent_price / ya.old_price - 1) * 100 AS return_12m
    FROM recent r
    JOIN year_ago ya ON r.symbol = ya.symbol
    JOIN profile pr ON r.symbol = pr.symbol
    WHERE ya.old_price > 0
      AND r.recent_price > 0
      AND (r.recent_price / ya.old_price - 1) BETWEEN -0.99 AND 5.0
      AND r.recent_price >= 0.50
)
SELECT
    sector,
    ROUND(AVG(return_12m), 2) AS avg_return_12m_pct,
    COUNT(DISTINCT symbol)    AS n_stocks,
    ROW_NUMBER() OVER (ORDER BY AVG(return_12m) ASC) AS rank_worst_to_best
FROM stock_returns
GROUP BY sector
HAVING COUNT(DISTINCT symbol) >= 3
ORDER BY avg_return_12m_pct ASC;
Note the two sectors with the lowest avg_return_12m_pct. Use those names in Step 2.
Step 2: Stocks to buy (replace sector names with Step 1 output)
-- Replace 'Energy' and 'Basic Materials' with your Step 1 results
WITH prices AS (
    SELECT e.symbol, e.adjClose, CAST(e.date AS DATE) AS trade_date
    FROM stock_eod e
    JOIN profile p ON e.symbol = p.symbol
    WHERE p.sector IS NOT NULL
      AND p.sector != ''
      AND p.marketCap > 5000000000
      AND p.exchange IN ('SET')
      AND CAST(e.date AS DATE) >= CURRENT_DATE - INTERVAL '400' DAY
      AND e.adjClose IS NOT NULL
      AND e.adjClose > 0
),
recent AS (
    SELECT symbol, adjClose AS recent_price, trade_date AS recent_date
    FROM prices
    QUALIFY ROW_NUMBER() OVER (PARTITION BY symbol ORDER BY trade_date DESC) = 1
),
year_ago AS (
    SELECT symbol, adjClose AS old_price, trade_date AS old_date
    FROM prices
    WHERE trade_date <= CURRENT_DATE - INTERVAL '252' DAY
    QUALIFY ROW_NUMBER() OVER (PARTITION BY symbol ORDER BY trade_date DESC) = 1
),
stock_returns AS (
    SELECT r.symbol, pr.sector, pr.companyName, pr.exchange, pr.marketCap,
           r.recent_price,
           (r.recent_price / ya.old_price - 1) * 100 AS return_12m
    FROM recent r
    JOIN year_ago ya ON r.symbol = ya.symbol
    JOIN profile pr ON r.symbol = pr.symbol
    WHERE ya.old_price > 0
      AND r.recent_price > 0
      AND (r.recent_price / ya.old_price - 1) BETWEEN -0.99 AND 5.0
      AND r.recent_price >= 0.50
)
SELECT
    symbol, companyName, sector,
    ROUND(return_12m, 2) AS return_12m_pct,
    ROUND(recent_price, 2) AS current_price,
    ROUND(marketCap / 1e9, 2) AS market_cap_billions_thb
FROM stock_returns
WHERE sector IN ('Energy', 'Basic Materials')
ORDER BY sector ASC, return_12m_pct ASC;
What We Found
Thailand produces a meaningful excess return over the local benchmark across 26 years, and unusually for this study, it does so while taking less risk than the index. The down capture is 70.85% and the max drawdown is -42.36% against the SET's own -48.10%.
| Metric | Portfolio | SET Index |
|---|---|---|
| CAGR | 8.85% | 3.69% |
| Excess CAGR | +5.15% | |
| Total Return | 806.59% | 156.80% |
| Volatility | 25.23% | 23.28% |
| Max Drawdown | -42.36% | -48.10% |
| Sharpe Ratio | 0.252 | 0.051 |
| Sortino Ratio | 0.440 | 0.082 |
| Calmar Ratio | 0.209 | 0.077 |
| Up Capture | 105.81% | |
| Down Capture | 70.85% | |
| Beta | 0.921 | |
| Jensen Alpha | +5.25% | |
| Win Rate (of 104 quarters) | 59.62% | |
| Avg Stocks per Period | 26.0 | |
| Cash Periods | 6 of 104 |
THB 10,000 compounded to THB 90,659 in the strategy against THB 25,680 in the SET.
The 70.85% down capture means the strategy fell about 70% as much as the SET when the index fell, while the 105.81% up capture means it kept slightly more than all of the upside. That's the asymmetry doing the work. The beta of 0.921 confirms it: this is a lower-risk portfolio than the index, not a leveraged bet on it, and the +5.25% Jensen alpha says the excess survives the beta adjustment.
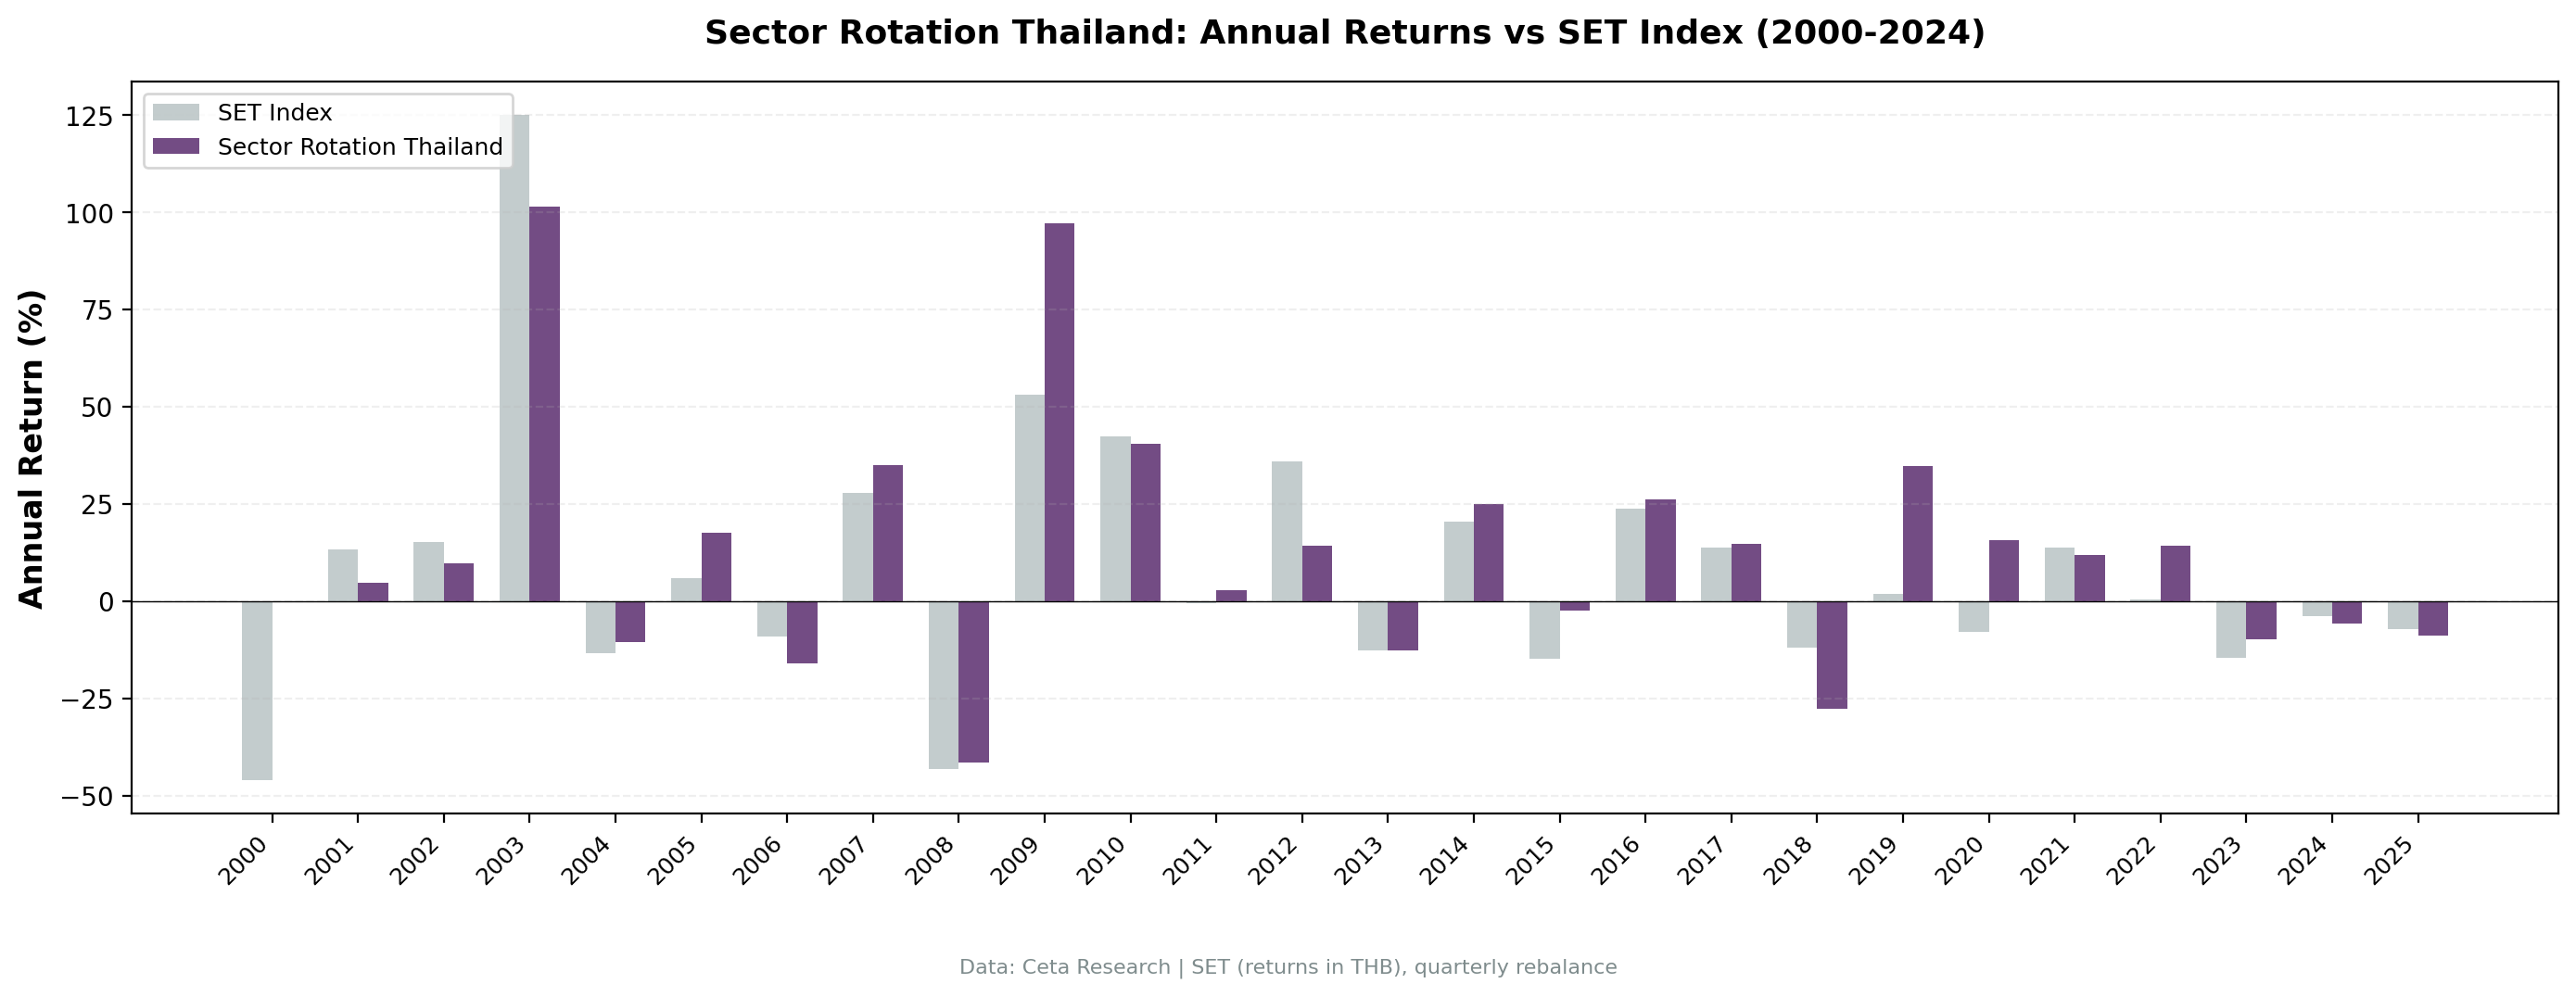
The Sharpe of 0.252 is modest in absolute terms, though the SET's own 0.051 is close to nothing. The strategy beat the SET in 59.62% of the 104 quarters and in 15 of 26 calendar years. The excess comes partly from the magnitude of wins in a handful of years (2009, 2019, 2020, 2022), not from frequency alone.
Most Selected Sectors (of 104 quarters)
| Sector | Quarters Selected |
|---|---|
| Communication Services | 30 (28%) |
| Energy | 25 (24%) |
| Basic Materials | 22 (21%) |
| Consumer Defensive | 20 (19%) |
| Utilities | 20 (19%) |
| Technology | 18 (17%) |
| Real Estate | 14 (13%) |
| Industrials | 13 (12%) |
| Financial Services | 12 (11%) |
| Consumer Cyclical | 12 (11%) |
| Healthcare | 10 (9%) |
Communication Services leads at 30 of 104 quarters, reflecting Thailand's telecom oligopoly (ADVANC, TRUE) and its long grind through data-price competition and consolidation. Energy is close behind at 25. Thailand's oil and gas complex, PTT and its affiliates, cycles through extended periods of underperformance tied to global crude prices, refinery margins and government pricing policy. Basic Materials at 22 picks up the petrochemical names that swing with export demand. Together those three filled 77 of the 196 sector slots the strategy took across the period.
Notable Years
2000: the widest relative win came from cash. The SET fell -46.00% and the strategy held cash for all four quarters, so the +46.00pp excess involved no stock selection whatsoever. It's the widest margin in the record, narrowly ahead of 2009's +44.19pp, and it's the one year where the margin came entirely from not being invested. Worth keeping in mind when reading the headline excess figure.
2003: the biggest absolute year and the worst relative one. The strategy returned +101.48%, more than doubling capital, and still lost to the SET by -23.52pp because the index gained +125.00%. Thailand was working off the 1997 Asian financial crisis hangover, commodity prices were recovering and regional trade flows were normalizing. Everything went up. A portfolio built from the two worst sectors of 2002 went up a lot, and the broad market went up more. This is the single widest underperformance in the Thai backtest, and it came in the year the strategy made the most money.
2008-2009: a crash absorbed, then a rebound captured. 2008 cost -41.48% against the SET's -43.21%, so the strategy came through the crisis marginally ahead. 2009 then returned +97.17% against +52.98%, a +44.19pp excess and the widest relative gain of any invested year. The sectors most destroyed in 2008 recovered hardest, which is the mechanism working as designed. The pair also shows the compounding problem: losing 41% then gaining 97% leaves you 15% ahead of the 2007 close, not 56%.
2012: -21.58pp. The second-worst relative year, and a repeat of the 2003 shape. The SET gained +35.83% in a broad rally while the strategy managed +14.25%. Melt-ups are structurally hostile to a strategy that buys last year's losers.
2013: political unrest hit everything equally. The country went through prolonged unrest through 2013, protests, government dissolution and ultimately the 2014 coup. Foreign investors pulled capital broadly, dragging down sectors regardless of their fundamental cycle. The strategy returned -12.65% and the SET returned -12.55%, an excess of -0.09pp. Both fell together. A domestic political crisis is a market-wide event, not a sector rotation, so there was nothing for the signal to exploit and nothing much for it to lose either.
2018: -15.81pp. The third-worst relative year. The strategy lost -27.76% against the SET's -11.95%, more than twice the index's decline. Unlike 2003 and 2012, this one was a genuine selection failure rather than a melt-up miss.
2019-2020: the best two-year relative stretch. The SET managed +1.91% in 2019 and fell -7.99% in 2020. The strategy returned +34.71% and +15.78%, for +32.80pp and +23.77pp of excess. Two consecutive years of wide margins against a flat and then falling index, which is the down-capture profile paying out.
2022: +14.21% against a flat SET. When global markets sold off in 2022, Thailand's Energy and Materials sectors held up and gained. Commodity prices were elevated, Thai exports were recovering and the sectors the strategy owned were domestic and commodity-driven rather than rate-sensitive. The SET returned +0.52%, so the +13.69pp excess came from the strategy moving while the index stood still.
2023-2025: -9.79%, -5.70%, -8.84%. Three consecutive losing years, and the honest framing is that they were market years, not strategy years. The SET returned -14.63%, -3.73% and -7.23% over the same stretch, so the excess was +4.84pp, -1.97pp and -1.61pp. The strategy beat the index in 2023 and tracked it closely in 2024 and 2025. Thailand's economy has faced real structural headwinds: weak post-COVID tourism recovery, sluggish manufacturing, political instability and currency pressure. Those headwinds hit the whole market. Anyone holding Thai equities lost money over these three years, and this strategy lost slightly less than the index did.
Full Annual Returns
| Year | Portfolio | SET Index | Excess |
|---|---|---|---|
| 2000 | 0.00% (cash) | -46.00% | +46.00% |
| 2001 | +4.77% | +13.37% | -8.60% |
| 2002 | +9.73% | +15.18% | -5.45% |
| 2003 | +101.48% | +125.00% | -23.52% |
| 2004 | -10.59% | -13.46% | +2.87% |
| 2005 | +17.60% | +6.01% | +11.59% |
| 2006 | -15.96% | -9.15% | -6.81% |
| 2007 | +34.87% | +27.87% | +7.00% |
| 2008 | -41.48% | -43.21% | +1.74% |
| 2009 | +97.17% | +52.98% | +44.19% |
| 2010 | +40.54% | +42.35% | -1.81% |
| 2011 | +2.90% | -0.59% | +3.49% |
| 2012 | +14.25% | +35.83% | -21.58% |
| 2013 | -12.65% | -12.55% | -0.09% |
| 2014 | +24.94% | +20.51% | +4.42% |
| 2015 | -2.37% | -14.82% | +12.45% |
| 2016 | +26.16% | +23.76% | +2.40% |
| 2017 | +14.74% | +13.75% | +1.00% |
| 2018 | -27.76% | -11.95% | -15.81% |
| 2019 | +34.71% | +1.91% | +32.80% |
| 2020 | +15.78% | -7.99% | +23.77% |
| 2021 | +11.93% | +13.76% | -1.83% |
| 2022 | +14.21% | +0.52% | +13.69% |
| 2023 | -9.79% | -14.63% | +4.84% |
| 2024 | -5.70% | -3.73% | -1.97% |
| 2025 | -8.84% | -7.23% | -1.61% |
The strategy beat the SET in 15 of 26 calendar years and in 59.62% of the 104 quarters. Most of those wins are small. The excess return is carried by a handful of years, 2000, 2009, 2019 and 2020, and offset by two wide losses in 2003 and 2012, both of which came in the index's strongest years. The math holds over 26 years, but it requires tolerance for stretches where the strategy is right and the market pays something else.
Backtest Methodology
| Parameter | Value |
|---|---|
| Signal | 12-month trailing equal-weighted sector return |
| Selection | Bottom 2 sectors each quarter |
| Universe | SET (Stock Exchange of Thailand), market cap > THB 5B |
| Portfolio | Equal weight all qualifying stocks in selected sectors |
| Rebalancing | Quarterly (Jan, Apr, Jul, Oct) |
| Execution | Entry at the next available close after the signal date |
| Cash rule | Hold cash if fewer than 5 sectors qualify, or fewer than 10 stocks pass the filters |
| Transaction costs | Size-tiered model. Bid-ask spread and market impact are not modelled |
| Fundamental data | None. Pure price signal, so no reporting lag applies |
| Period | 2000-2025 (104 quarterly periods) |
| Benchmark | SET Index (^SET.BK) |
Limitations
Currency note. All returns are in THB. The SET Index benchmark is also in THB, so the excess return comparison is clean on a local basis. For a USD-based investor, currency conversion would alter realized returns meaningfully in any given year.
Small universe. With 26 stocks per period on average and 6 cash quarters out of 104, this strategy is more concentrated than most exchanges in the study. Individual company outcomes matter more at that size. The 6 cash quarters, against zero for the US, are times when the qualifying universe didn't reach the minimum sector count or the minimum stock count, concentrated in the early years.
Sector concentration. Communication Services and Energy together took 55 of the 196 sector slots. This leans heavily on Thai telecoms and the PTT group, with petrochemical names close behind. That's a narrow structural bet, not broad sector diversification.
Recent deterioration. The 2023-2025 run is three straight years of losses, the worst absolute stretch in the backtest. Thailand's post-COVID economic recovery has been slower than expected, and the sectors the strategy rotated into didn't revert. Note that the SET fell in all three years too, so the strategy roughly matched a falling market rather than diverging from a rising one. Losing less than the index is still losing.
The cash rule carries part of the excess. The +46.00pp margin in 2000 came from holding cash through a -46.00% SET, with no stock selection involved. Excluding 2000, the remaining 25 years produce 14 wins and 11 losses and a much narrower average margin.
Liquidity. SET large caps (above THB 5B) are reasonably liquid for institutional-scale positions, but bid-ask spreads and market depth are thinner than developed markets. Transaction costs in practice will be higher than the model's size-tiered estimates, especially at rebalance dates.
Takeaway
Thailand's sector mean reversion produced +5.15% annual excess over 26 years against the SET Index, with a total return of 806.59%. It absorbed about 70% of the SET's downside and finished with a shallower worst drawdown than the index, -42.36% against -48.10%. Six of the 13 markets we tested beat their index on both return and drawdown, and Thailand is one of them. Korea and Taiwan have the widest drawdown gaps of the six.
The negatives are real too. The Sharpe of 0.252 is modest in absolute terms. The universe averages 26 stocks, which is concentration risk. And the 2023-2025 run of losses shows the recent Thai market hasn't rewarded any equity playbook, this one included.
The relative record is lopsided by period rather than by decade. The four widest wins came in 2000, 2009, 2019 and 2020. Three of those came against a falling or flat SET, and 2009 was the post-crisis rebound. The two widest losses came in the SET's two strongest years, 2003 at +125.00% and 2012 at +35.83%. Whether the pattern holds depends on Thailand's economic trajectory: tourism recovery, manufacturing competitiveness and regional trade dynamics, not on the signal's mechanics.
USD-based investors should discount both the returns and the comparison for currency.
Part of a Series
We tested this strategy across 13 exchanges. Other analyses in the series:
- Korea (KSC): highest CAGR of the 13 at 14.28%, +8.74% vs KOSPI, Sharpe 0.434
- Taiwan (TAI + TWO): best Sharpe of the 13 at 0.485, +9.35% vs TAIEX
- Sweden (STO): highest win rate, 19 of 26 calendar years, +7.40% vs OMX30
- India (NSE): 12.68% CAGR but only +1.44% vs Sensex, and negative after adjusting for beta
- US (NYSE + NASDAQ + AMEX): 10.60% CAGR, +2.58% vs S&P 500
- Global comparison: all 13 exchanges ranked by excess and by risk-adjusted alpha
References
Moskowitz, T. J., & Grinblatt, M. (1999). Do industries explain momentum? Journal of Finance, 54(4), 1249-1290.
Data: Ceta Research, FMP financial data warehouse. Universe: SET (Stock Exchange of Thailand). Market cap > THB 5B (~USD $140M). Quarterly rebalance, equal weight, 2000-2025. Returns in THB. Benchmark: SET Index (^SET.BK). Full methodology: METHODOLOGY.md. Past performance does not guarantee future results.
Past performance does not guarantee future results. This is educational content, not investment advice.

