
Volume-Confirmed Momentum on UK Stocks: 9.05% CAGR vs 1.44% for the FTSE 100
Volume-confirmed momentum on UK stocks returned 9.05% annually from 2001 to 2025 against 1.44% for the FTSE 100, the largest local-benchmark edge of 17 markets. The FTSE 100 is a price index though, and once dividends are added back the honest edge is about +4%.

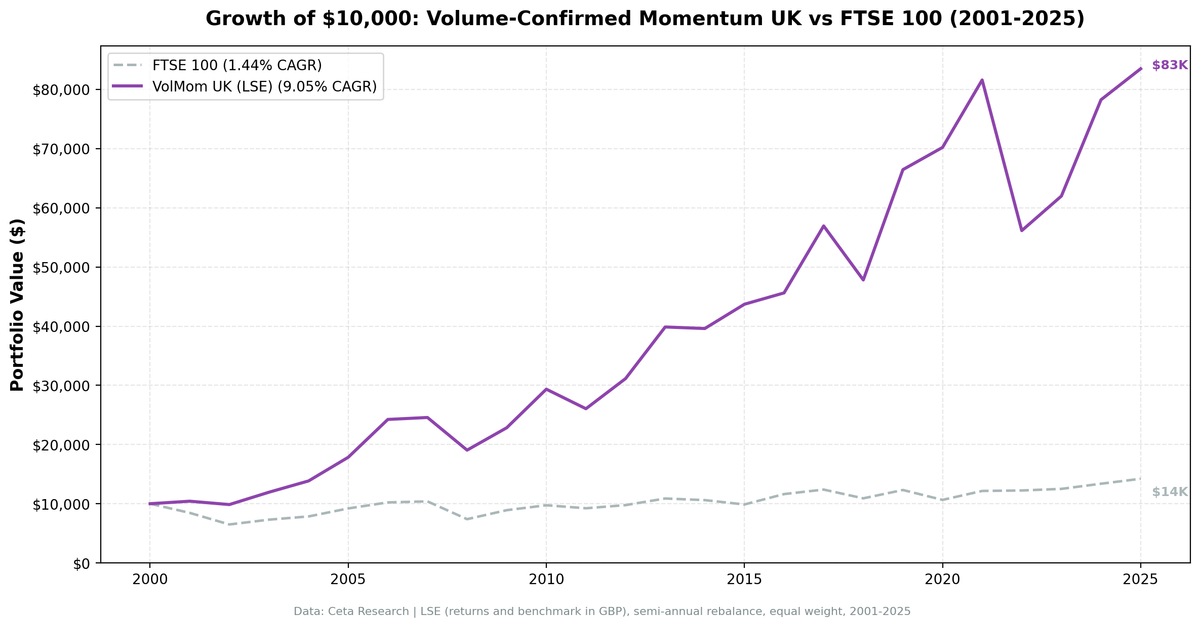
The UK produces the largest edge over a local benchmark of any market in this 17-exchange study. From 2001 to 2025, volume-confirmed momentum on the London Stock Exchange returned 9.05% annually against 1.44% for the FTSE 100, a +7.60% annual excess. The strategy was invested in 47 of 49 semi-annual periods and beat the index in 19 of 25 calendar years.
Contents
- Method
- What We Found
- The Benchmark Problem, Stated Plainly
- Does the Edge Belong to UK Companies?
- Backtest Methodology
- Limitations
- Takeaway
- Part of a Series
- References
That headline needs one immediate qualifier, and we'd rather give it here than bury it: the FTSE 100 is a price index, so it leaves dividends out. Against a dividend-reinvested FTSE 100 tracker the edge is closer to +4%. The detail is in the benchmark section below.
Data: FMP financial data warehouse, 2000–2025. Rerun September 2026.
Method
| Parameter | Value |
|---|---|
| Universe | LSE (London Stock Exchange) |
| Rebalancing | Semi-annual (January, July) |
| Signal | 12-month return, skip last month (T-1M to T-12M) |
| Volume filter | 3-month avg daily volume > 12-month avg (vol_ratio > 1.0) |
| Quality filter | netIncome > 0 AND operatingCashFlow > 0 (FY, 45-day lag) |
| Selection | Top 30 by momentum, equal weight |
| Min threshold | 10 buyable stocks to deploy capital |
| Data source | FMP via Ceta Research warehouse |
| Benchmark | FTSE 100 (^FTSE) |
| Period | 2001–2025 |
| Academic reference | Lee & Swaminathan (2000), Journal of Finance 55(5) |
A note on that reference, because it is usually cited in the wrong direction. Lee & Swaminathan found that "high (low) volume winners (losers) experience faster reversals" and that "among winners, low volume stocks show greater persistence in price momentum." Their momentum life cycle treats a high-volume winner as late-stage momentum, closer to turning than a winner nobody is watching. A long-only portfolio of high-volume winners is not the trade that paper supports, and the UK result below is not evidence for it either: their study ranked NYSE and AMEX stocks on turnover, not LSE listings on a raw volume ratio.
What We Found
£10,000 invested in the strategy at the start of 2001 finished at about £83,000. The same £10,000 tracking the FTSE 100 price index finished at about £14,200. Both figures are in sterling: the portfolio, the benchmark and the charts on this page are all GBP-denominated, even where a chart axis is labelled with a dollar sign.
24.5-year summary (2001–2025):
| Metric | Volume-Confirmed Momentum | FTSE 100 |
|---|---|---|
| CAGR | 9.05% | 1.44% |
| Total Return | 735.0% | 42.1% |
| Sharpe Ratio | 0.303 | n/a |
| Max Drawdown | -39.32% | -35.75% |
| Down Capture | 54.4% | 100% |
| Up Capture | 165.9% | 100% |
| Win Rate (periods) | 75.5% | n/a |
| Cash Periods | 2 of 49 (4%) | n/a |
| Avg Stocks Held (when invested) | 26.7 | n/a |
The shape here is unusual. Most markets in this study buy their downside protection with lost upside. The UK does the opposite: it captures 165.9% of the FTSE's up moves while taking only 54.4% of its down moves. That asymmetry, not stock-picking brilliance, is what produces the 7.6 point gap.
It's also a symptom of how weak the benchmark is. A 165.9% up capture against an index that compounded at 1.44% is easier to achieve than the number makes it sound.
Year-by-year:
| Year | Portfolio | FTSE 100 | Excess |
|---|---|---|---|
| 2001 | +4.2% | -15.5% | +19.7pp |
| 2002 | -5.5% | -23.2% | +17.7pp |
| 2003 | +21.2% | +12.5% | +8.7pp |
| 2004 | +16.0% | +7.5% | +8.5pp |
| 2005 | +28.8% | +17.2% | +11.6pp |
| 2006 | +35.8% | +11.1% | +24.8pp |
| 2007 | +1.4% | +1.7% | -0.3pp |
| 2008 | -22.5% | -28.9% | +6.5pp |
| 2009 | +19.8% | +20.6% | -0.7pp |
| 2010 | +28.5% | +9.3% | +19.2pp |
| 2011 | -11.2% | -5.2% | -6.0pp |
| 2012 | +19.6% | +5.8% | +13.8pp |
| 2013 | +28.0% | +11.5% | +16.5pp |
| 2014 | -0.7% | -2.5% | +1.9pp |
| 2015 | +10.4% | -6.9% | +17.3pp |
| 2016 | +4.4% | +17.8% | -13.4pp |
| 2017 | +24.8% | +6.6% | +18.3pp |
| 2018 | -16.0% | -12.0% | -4.1pp |
| 2019 | +39.0% | +12.9% | +26.1pp |
| 2020 | +5.7% | -13.6% | +19.2pp |
| 2021 | +16.2% | +14.2% | +2.0pp |
| 2022 | -31.2% | +0.7% | -31.8pp |
| 2023 | +10.4% | +2.2% | +8.2pp |
| 2024 | +26.3% | +7.0% | +19.3pp |
| 2025 | +6.7% | +6.2% | +0.5pp |
2008 is the most interesting year. The portfolio fell 22.5% while the FTSE 100 fell 28.9%. A momentum strategy outperforming in a crash is not what the literature predicts. The quality gate is doing the work: requiring positive net income and positive operating cash flow removed the leveraged financials that drove the index down.
2022 is the counter-example and the single worst year in the record. The portfolio lost 31.2% while the FTSE 100 gained 0.7%, a 31.8 point miss. This is the momentum crash Daniel & Moskowitz (2016) describe. When the rate cycle turned, the stocks with the best trailing 12-month returns were the long-duration growth names, and they were repriced hardest. The FTSE 100's heavy weighting in energy and miners meant the index went the other way. One year erased roughly four years of accumulated edge.
2016 was the other bad miss. The portfolio returned 4.4% against the index's 17.8%. Sterling collapsed after the Brexit referendum, and the FTSE 100's overseas earners were repriced upward on the currency move alone. A screen selecting on trailing price momentum had no way to anticipate that.
2006 and 2019 were the best years, at +24.8pp and +26.1pp over the index. Both were periods of sustained sector trends, UK mid-cap industrials in 2006 and a broad post-Brexit-resolution rally in 2019. A trending market suits a concentrated momentum book; we have no holdings-level evidence about who was doing the buying.
Live screen. The current UK volume-confirmed momentum screen is live on Ceta Research: cetaresearch.com/data-explorer?q=Kb4lwhmWAl
The screen ranks LSE listings, and London lists companies from many countries. Its currency column shows what each line is quoted in, which on any given day spans GBp, USD, EUR, CHF, SEK and CAD, so read the market cap column against that column rather than assuming sterling. This is the same listing-versus-domicile point the section below measures.
The Benchmark Problem, Stated Plainly
The +7.60% number compares a dividend-adjusted portfolio against a benchmark that pays no dividends. The FTSE 100 is a price index. The UK has one of the highest dividend yields in the developed world. That gap is not a rounding error.
We measured it rather than estimated it. Over 2002-01 to 2025-07, the FTSE 100 price index compounded at 2.24% a year. The iShares FTSE 100 tracker over the identical window, with dividends reinvested, compounded at 5.79%. The difference is 3.55 percentage points a year, all of it dividends.
Apply that to the headline and the edge falls from roughly +7.6% to roughly +4%. Still a real edge, still the kind of gap worth investigating, but not the number the index comparison alone suggests. Treat the +7.60% as a comparison against the FTSE 100 as it is normally quoted, not as a comparison against what a UK index investor would actually have earned.
Does the Edge Belong to UK Companies?
Screening on exchange listing is not the same as screening on where a company is based. Only about 30% of LSE-listed symbols are UK-domiciled. Ireland, the US, Luxembourg and Switzerland account for most of the rest, largely through secondary London lines and cross-listings. An apparent UK result can turn out to belong to foreign companies that merely trade in London.
So we ran the backtest again with the universe restricted to GB-domiciled companies:
| Listed on the LSE | Domiciled in the UK | |
|---|---|---|
| CAGR | 9.05% | 8.93% |
| Excess vs FTSE 100 | +7.60% | +7.49% |
| Sharpe Ratio | 0.303 | 0.360 |
| Max Drawdown | -39.32% | -23.65% |
| Invested periods | 47 of 49 | 44 of 49 |
The edge survives. Restricting to UK-domiciled companies costs 0.11 percentage points of excess return and three invested periods, which means the screen was already filling from domestic names. The risk profile actually improves: the maximum drawdown shrinks from -39.3% to -23.7% and the Sharpe ratio rises to 0.360.
The difference concentrates in two years. In 2022 the listed universe lost 31.2% while the UK-domiciled version lost 12.2%, so most of the momentum crash sat in the foreign London lines. In 2020 the pattern reverses: listed +5.7%, UK-only -12.8%.
All headline figures on this page use the listed universe, for consistency with the other 16 markets in this study.
Backtest Methodology
- Data: FMP financial data via Ceta Research warehouse. Price data from
stock_eod(adjusted closes). - Point-in-time: Quality filters use annual FY filings with 45-day reporting lag. No look-ahead bias.
- Signal: Price at T-12M to T-1M. Skip last month avoids short-term reversal contamination per Jegadeesh & Titman (1993).
- Volume ratio: 63-day avg daily volume divided by 252-day avg daily volume, computed at each rebalance date.
- Data quality: Stocks with an entry price under £1 are excluded, and any single-period return above 200% is dropped as a price artifact. Phantom holiday rows and broken split adjustments are removed from the price series before any lookup.
- Equal weight: 30 positions, 3.33% each. No intraperiod rebalancing.
- Transaction costs: Modeled as size-tiered commissions. See methodology.
- Benchmark: FTSE 100 (^FTSE), GBP-denominated. Strategy returns are also GBP-denominated.
- Execution: Next-day close (market-on-close model). Entry prices use the trading day after the rebalance signal date.
Limitations
The benchmark excludes dividends. Covered in full above. The honest edge against a dividend-reinvested FTSE 100 is roughly +4%, not +7.6%.
One year carries a lot of the risk. 2022 cost 31.8 percentage points against the index. Momentum crashes are a documented feature of the factor, not a data problem, and they arrive without warning when a rate cycle turns. An investor who started this strategy in January 2022 would have spent the first year deeply underwater.
Currency risk. Returns are in GBP. A dollar-based investor adds sterling exposure on top of equity exposure, and sterling fell materially against the dollar across this period.
The up capture is flattered by a weak index. 165.9% up capture sounds like aggressive participation. Part of it is simply that the FTSE 100 barely moved over 25 years, so beating its up periods is a low bar.
Survivorship bias, partially controlled. The FMP dataset includes delisted companies, but coverage of UK companies that failed and disappeared is not guaranteed to be complete. Any residual gap biases the result upward.
Semi-annual rebalancing. Momentum decays faster than six months. The portfolio carries stale signals through much of each holding period, and 2022 is what that looks like when the regime changes mid-period.
Takeaway
The UK is the strongest local-benchmark result in this 17-market study, and it holds up to the two checks that usually break a result like this. Restricting the universe to UK-domiciled companies barely moves the excess return and improves the risk profile. The strategy was invested 96% of the time, so the edge isn't an artifact of sitting in cash through bad years.
What it doesn't survive is the dividend adjustment. A large part of the apparent +7.60% is the FTSE 100 not paying its dividends into the comparison. The defensible claim is roughly +4% a year against a dividend-reinvested FTSE 100 tracker, with a -39% maximum drawdown and one year that lost 31 points to the index.
That's a real result, and it's a considerably more modest one than the headline figure implies.
Part of a Series
This is part of a multi-exchange volume-confirmed momentum study:
- Volume-Confirmed Momentum: US Stocks
- Volume-Confirmed Momentum: UK Stocks
- Volume-Confirmed Momentum: India
- Volume-Confirmed Momentum: Canada
- Volume-Confirmed Momentum: Sweden
- Volume-Confirmed Momentum: 17-Exchange Comparison
References
- Lee, C. & Swaminathan, B. (2000). Price Momentum and Trading Volume. Journal of Finance, 55(5), 2017-2069.
- Jegadeesh, N. & Titman, S. (1993). Returns to Buying Winners and Selling Losers. Journal of Finance, 48(1), 65-91.
- Daniel, K. & Moskowitz, T. (2016). Momentum Crashes. Journal of Financial Economics.
Past performance does not guarantee future results. This is educational content, not investment advice.
