
Earnings Surprise Drift in Taiwan: The Widest Spread We Found, on Both Sides
Taiwan has the widest earnings-surprise spread in our study: +4.52% at T+63 vs the TAIEX, now the largest after the correction. Both sides survive. Worst misses -3.08% (-2.69% net), biggest beats +1.45%.

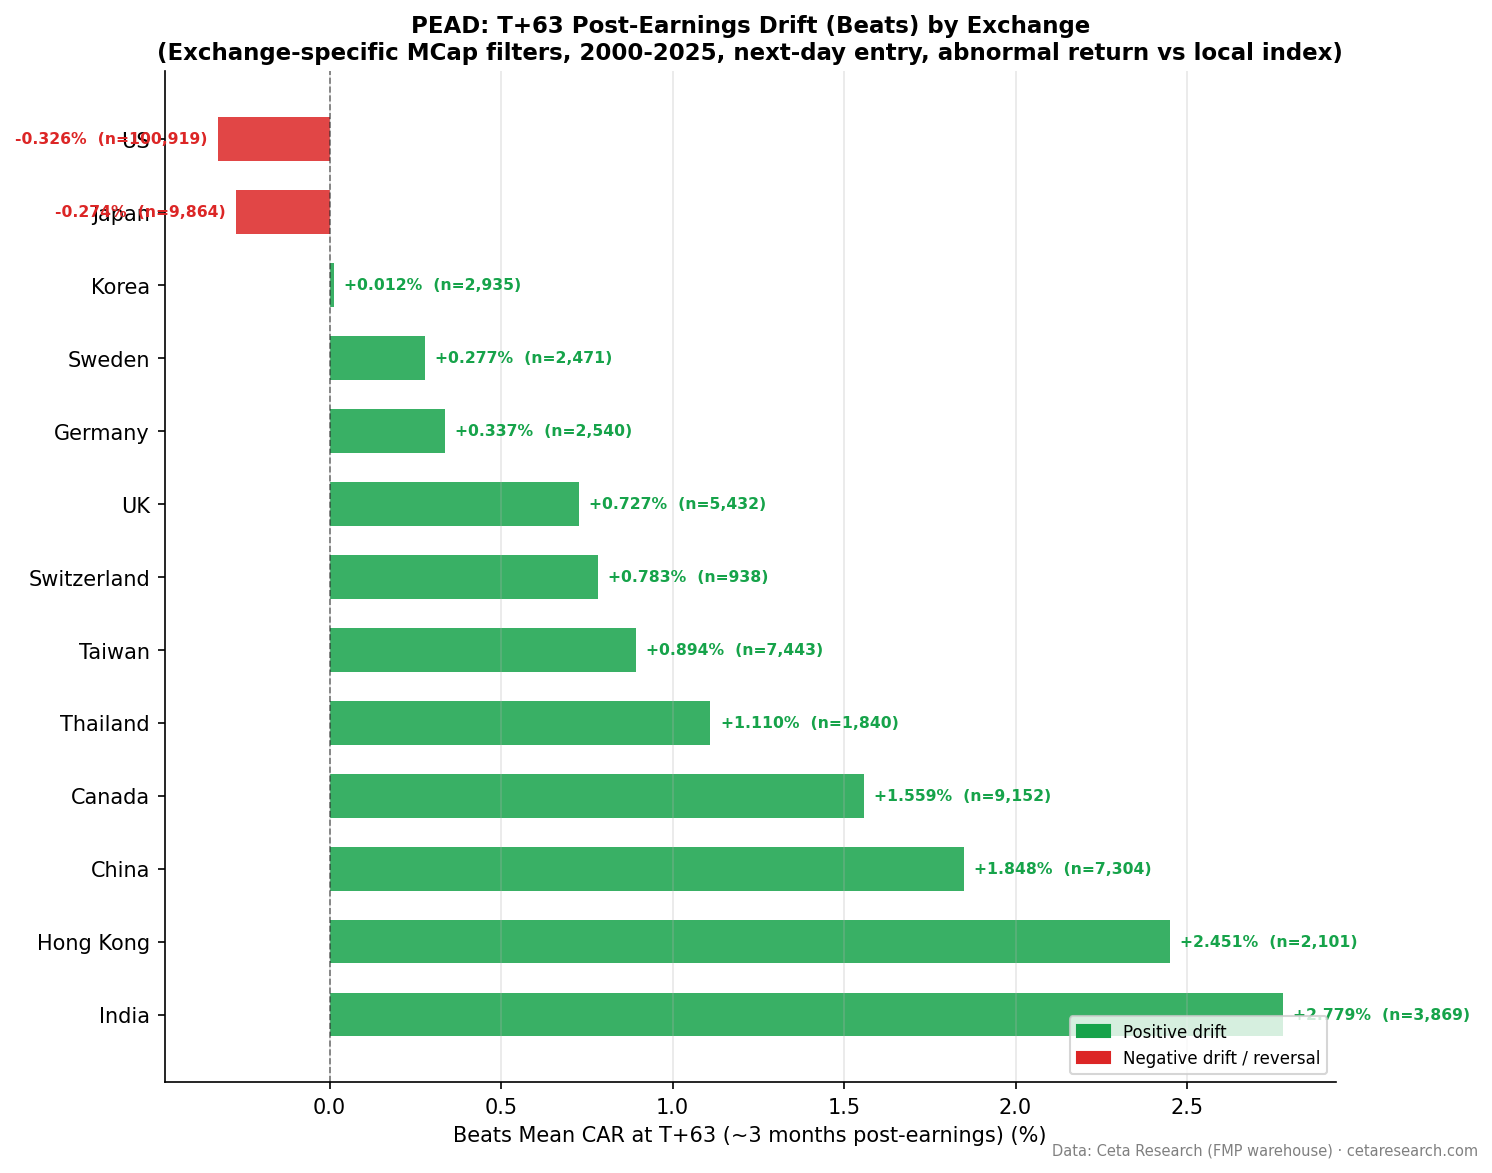
Taiwan has the widest earnings-surprise spread of any market in our study, and it's the rare market where both sides survive a realistic next-day entry. The Q5-Q1 spread is +4.52% at T+63 against the TAIEX, now the largest globally after the methodology correction. The miss side leads: worst-miss stocks fall -3.08%, and against the near-consensus baseline that's -2.69% of genuine miss-side drift, the strongest of any market. The beat side is solid too: biggest beats produce +1.45%, or +1.84% net of baseline. Taiwan is genuinely two-sided PEAD.
Contents
- Method
- The Strategy
- What We Found
- Positive vs Negative Surprise Drift
- Quintile Analysis at T+63
- The Two-Sided Structure
- When It Works and When It Struggles
- Run It Yourself
- Limitations
- Part of a Series
- References
Data: FMP financial data warehouse, 2000–2025. Updated July 2026.
Method
| Parameter | Details |
|---|---|
| Data source | FMP earnings_surprises + stock_eod (Ceta Research warehouse) |
| Universe | TAI + TWO (Taiwan exchanges), market cap threshold applied per exchange |
| Period | 2000–2025 (26 years) |
| Events | 16,958 total (deduplicated per symbol/date) |
| Benchmark | TAIEX (^TWII, local currency) |
| Execution | Enter at the next day's close (T+1), skipping the announcement day |
| Data quality | Oscillation rows removed, entry price > $1, single-window return capped at 200% |
| Surprise metric | (epsActual − epsEstimated) / ABS(epsEstimated) |
| Windows | T+1, T+5, T+21, T+63 trading days, measured from entry |
The Strategy
Post-Earnings Announcement Drift (PEAD) documents that stocks continue drifting in the direction of their earnings surprise for weeks after the announcement. Ball and Brown (1968) established it, Bernard and Thomas (1989) confirmed it persists up to 60 trading days.
Taiwan's market has a heavy technology concentration, dominated by semiconductor and electronics manufacturers, meaningful domestic analyst coverage, and high retail participation. We ran the event study with a next-day entry and the local TAIEX benchmark.
What We Found
Positive vs Negative Surprise Drift
| Direction | Events | T+1 | T+5 | T+21 | T+63 |
|---|---|---|---|---|---|
| Positive surprises | 7,443 | +0.16% | +0.43% | +1.14% | +0.89% |
| Negative surprises | 9,515 | -0.19% | -0.41% | -0.13% | -1.67% |
Taiwan's beat rate is 43.9%, so more companies miss than beat. The miss side is the larger signal: negative surprises fall -1.67% at T+63 with a t-statistic of -9.7. Positive surprises drift up to +0.89%. Both sides are active and both are statistically real, which is unusual after the next-day correction.
Quintile Analysis at T+63
| Quintile | Description | Events | CAR at T+63 | t-stat |
|---|---|---|---|---|
| Q5 | Biggest beats | 3,388 | +1.45% | +4.4 |
| Q4 | Moderate beats | 3,411 | +0.59% | +2.0 |
| Q3 | Near-consensus | 3,422 | -0.39% | -1.4 |
| Q2 | Moderate misses | 3,396 | -1.31% | -4.8 |
| Q1 | Worst misses | 3,341 | -3.08% | -10.0 |
The Q5-Q1 spread is +4.52% at T+63, the widest in our global study. The near-consensus baseline (Q3) is close to zero at -0.39%, so both tails carry genuine signal. The beat side (Q5 minus Q3) is +1.84%. The miss side (Q1 minus Q3) is -2.69%, the strongest negative drift of any market we tested. Q1's t-statistic of -10.0 across more than 3,300 events is among the most robust findings in the study.
The pattern is close to monotonic: Q1 -3.08%, Q2 -1.31%, Q3 -0.39%, Q4 +0.59%, Q5 +1.45%. Magnitude predicts drift on both sides.
The Two-Sided Structure
Taiwan is one of only two markets (with China) where both sides clearly survive the correction, and it's the only one where the miss side is this strong. The technology concentration is a likely reason. A semiconductor company missing estimates isn't just company-specific news, it can signal industry-wide demand weakness that propagates through analyst forecasts over weeks. That's consistent with the late-accelerating miss drift: the worst misses are -0.68% at T+21 but -3.08% by T+63.
When It Works and When It Struggles
Taiwan supports both sides of a PEAD strategy. The miss side is the cleaner trade: Q1 at -3.08% (or -2.69% net of baseline) with a very high t-statistic, and the drift keeps building through the full 63 days, so a short or underweight has time to work. The beat side (Q5 at +1.45%, +1.84% net) is a viable long on the biggest beats.
The miss drift's late acceleration means the holding period matters. Most of the Q1 move comes in the back half of the window, so a short closed at T+21 captures little. Semiconductor sector concentration also means results partly reflect industry cycles, so a sector-aware implementation will see different magnitudes than the aggregate.
Run It Yourself
-- Recent earnings surprises on Taiwan exchanges
WITH deduped AS (
  SELECT
    es.symbol,
    es.date,
    es.epsActual,
    es.epsEstimated,
    (es.epsActual - es.epsEstimated) / NULLIF(ABS(es.epsEstimated), 0) AS std_surprise,
    ROW_NUMBER() OVER (PARTITION BY es.symbol, es.date ORDER BY es.lastUpdated DESC) AS rn
  FROM earnings_surprises es
  JOIN profile p ON es.symbol = p.symbol
  WHERE p.exchange IN ('TAI', 'TWO')
    AND p.isActivelyTrading = true
    AND CAST(es.date AS DATE) >= CURRENT_DATE - INTERVAL '90 days'
    AND ABS(es.epsEstimated) > 0.01
)
SELECT
  symbol,
  date,
  epsActual,
  epsEstimated,
  ROUND(std_surprise * 100, 1) AS surprise_pct
FROM deduped
WHERE rn = 1
  AND ABS(std_surprise) > 0.10
ORDER BY date DESC, std_surprise ASC
LIMIT 50
Run this query on Ceta Research →
Limitations
16,958 events provides solid statistical power, though the miss-heavy distribution (9,515 negative versus 7,443 positive) reflects the 43.9% beat rate. Both quintiles at the extremes hold more than 3,300 events.
Taiwan's heavy technology weighting means the results partly capture sector dynamics rather than pure earnings-surprise drift. A sector-controlled version might show different quintile patterns, especially on the miss side where semiconductor cycles dominate.
The near-zero baseline (Q3 at -0.39%) means Taiwan's raw levels are relatively clean, but we still report the Q5 minus Q3 and Q1 minus Q3 decomposition for consistency with the rest of the series.
Part of a Series
- PEAD Across 13 Global Exchanges: The Drift Shrinks Everywhere
- Earnings Surprise Drift on US Stocks: Most of It Vanishes If You Wait One Day
References
- Ball, R. & Brown, P. (1968). An empirical evaluation of accounting income numbers. Journal of Accounting Research.
- Bernard, V. & Thomas, J. (1989). Post-earnings-announcement drift: Delayed price response or risk premium? Journal of Accounting Research.
- Foster, G., Olsen, C. & Shevlin, T. (1984). Earnings releases, anomalies, and the behavior of security returns. The Accounting Review.
Data: Ceta Research, FMP financial data warehouse. Not investment advice.

