
Earnings Surprise Drift in Japan: Mostly the Announcement Day
Japan PEAD looks strong until you enter a day late. The Q5-Q1 spread drops to +0.82%, the weakest major market. Biggest beats show no significant drift, and misses hold up vs near-consensus. It was mostly the announcement day.

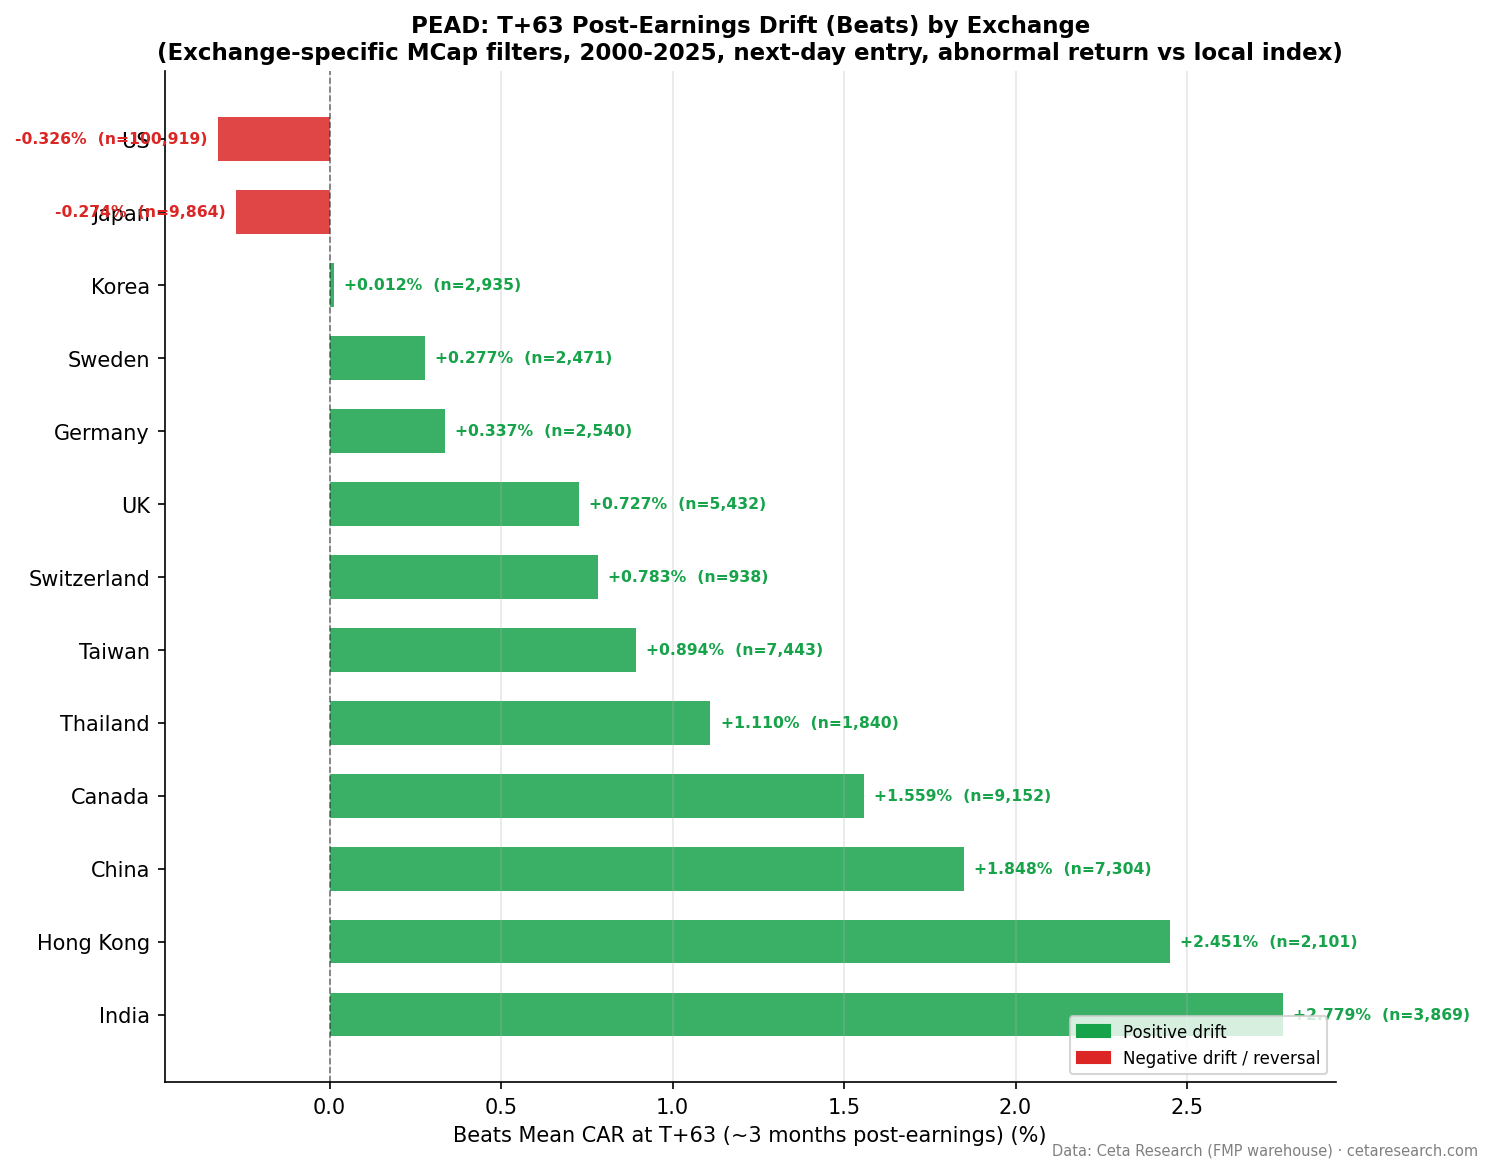
Japan is where post-earnings drift looks strong until you enter at a realistic price. Same-day event studies show a large miss-side drift on the Nikkei, with the worst misses falling nearly 3% over three months. Enter one day later, skipping the untradeable announcement move, and it mostly disappears. The Q5-Q1 spread drops to +0.82%, the smallest of any major market we tested. The biggest beats show no significant drift, and the worst misses actually hold up slightly better than near-consensus stocks. Japan's PEAD was largely the announcement-day reaction, not tradeable drift.
Contents
- Method
- The Strategy
- What We Found
- Positive vs Negative Surprise Drift
- Quintile Analysis at T+63
- Japan's Beat Rate
- When It Works and When It Struggles
- Run It Yourself
- Limitations
- Part of a Series
- References
Data: FMP financial data warehouse, 2000–2025. Updated July 2026.
Method
| Parameter | Details |
|---|---|
| Data source | FMP earnings_surprises + stock_eod (Ceta Research warehouse) |
| Universe | JPX, market cap threshold applied per exchange |
| Period | 2000–2025 (26 years) |
| Events | 17,219 total (deduplicated per symbol/date) |
| Benchmark | Nikkei 225 (^N225, local currency) |
| Execution | Enter at the next day's close (T+1), skipping the announcement day |
| Data quality | Oscillation rows removed, entry price > $1, single-window return capped at 200% |
| Surprise metric | (epsActual − epsEstimated) / ABS(epsEstimated) |
| Windows | T+1, T+5, T+21, T+63 trading days, measured from entry |
The Strategy
Post-Earnings Announcement Drift (PEAD) is one of the most replicated anomalies in finance. Ball and Brown (1968) documented it, and Bernard and Thomas (1989) showed it persists for up to 60 trading days. We tested it on Japanese equities over 26 years, entering at the next day's close so the announcement-day jump is excluded.
Japan is the clearest example in our study of how much that one rule matters. A same-day version of this study shows a miss-heavy PEAD with the worst-miss quintile near -2.8% at T+63. The next-day version tells a different story.
What We Found
Positive vs Negative Surprise Drift
| Direction | Events | T+1 | T+5 | T+21 | T+63 |
|---|---|---|---|---|---|
| Positive surprises | 9,864 | -0.04% | -0.17% | +0.04% | -0.27% |
| Negative surprises | 7,355 | -0.14% | -0.29% | -0.41% | -0.83% |
Both sides drift slightly negative at T+63. The miss side is larger (-0.83%) than the beat side (-0.27%), which looks like a modest miss-heavy PEAD. But the quintile table shows that most of this is a baseline effect, not an earnings signal.
Quintile Analysis at T+63
| Quintile | Description | Events | CAR at T+63 | t-stat |
|---|---|---|---|---|
| Q5 | Biggest beats | 3,466 | +0.14% | +0.6 |
| Q4 | Moderate beats | 3,449 | -0.22% | -0.9 |
| Q3 | Near-consensus | 3,446 | -1.01% | -4.8 |
| Q2 | Moderate misses | 3,440 | -0.84% | -3.8 |
| Q1 | Worst misses | 3,418 | -0.68% | -2.9 |
Here's the surprise: the near-consensus quintile Q3 is the most negative of all at -1.01%. The Japanese event universe drifts down against the Nikkei regardless of the surprise, so every quintile inherits a negative baseline. Measured against Q3, the worst misses (Q1 at -0.68%) actually did +0.33% better than near-consensus. There is no miss-side drift once you correct for the baseline. The old miss-heavy story was the announcement-day drop, which you can't trade, sitting on top of a falling universe.
The beat side has the right sign but not the significance. Q5 minus Q3 is +1.16%, but Q5's own t-statistic is +0.6, well short of significance. The Q5-Q1 spread of +0.82% is positive and technically the anomaly survives, but it's the weakest of any major market and neither tail gives a clean, tradeable signal.
Japan's Beat Rate
Japan's beat rate is 57.3%, the second-highest after the US. Japanese analyst estimates are moderately conservative, so beats are common and carry less information, similar to the US. Combined with the negative universe baseline, that leaves little for PEAD to work with after realistic execution.
When It Works and When It Struggles
This is a market where the honest answer is that the anomaly mostly doesn't survive the correction. The beat side isn't statistically significant, and the miss side vanishes against the baseline. A trader who ran the same-day version would have expected a strong short-the-miss edge that isn't actually there at a next-day entry.
If there's anything to it, it's a weak long tilt toward the biggest beats, and even that needs a larger or cleaner sample to trust. The practical takeaway is a caution: Japanese PEAD published on announcement-day closes overstates what you can capture.
Japanese reporting seasonality (many companies report annual results in May) and the high share of large-cap institutional ownership both work against a persistent drift here.
Run It Yourself
-- Recent large earnings surprises on JPX
WITH deduped AS (
  SELECT
    es.symbol,
    es.date,
    es.epsActual,
    es.epsEstimated,
    (es.epsActual - es.epsEstimated) / NULLIF(ABS(es.epsEstimated), 0) AS std_surprise,
    ROW_NUMBER() OVER (PARTITION BY es.symbol, es.date ORDER BY es.lastUpdated DESC) AS rn
  FROM earnings_surprises es
  JOIN profile p ON es.symbol = p.symbol
  WHERE p.exchange = 'JPX'
    AND p.isActivelyTrading = true
    AND CAST(es.date AS DATE) >= CURRENT_DATE - INTERVAL '90 days'
    AND ABS(es.epsEstimated) > 0.01
)
SELECT
  symbol,
  date,
  epsActual,
  epsEstimated,
  ROUND(std_surprise * 100, 1) AS surprise_pct
FROM deduped
WHERE rn = 1
  AND ABS(std_surprise) > 0.10
ORDER BY date DESC, std_surprise DESC
LIMIT 50
Run this query on Ceta Research →
Limitations
17,219 events over 26 years is a solid sample, so the weak result here isn't a sample-size artifact. It's a genuine finding: Japanese PEAD is small once the announcement day is excluded and the baseline is stripped out.
The negative universe baseline (Q3 at -1.01%) is large in Japan, which is exactly why the raw pos/neg levels mislead. We report the Q5 minus Q3 and Q1 minus Q3 decomposition so the announcement-day artifact and the universe drift don't get mistaken for drift.
Japanese reporting calendars differ from Western norms, with heavy May seasonality and less standardized quarterly reporting, so some T+63 windows overlap subsequent announcements.
Part of a Series
- PEAD Across 13 Global Exchanges: The Drift Shrinks Everywhere
- Earnings Surprise Drift on US Stocks: Most of It Vanishes If You Wait One Day
References
- Ball, R. & Brown, P. (1968). An empirical evaluation of accounting income numbers. Journal of Accounting Research.
- Bernard, V. & Thomas, J. (1989). Post-earnings-announcement drift: Delayed price response or risk premium? Journal of Accounting Research.
- Foster, G., Olsen, C. & Shevlin, T. (1984). Earnings releases, anomalies, and the behavior of security returns. The Accounting Review.
Data: Ceta Research, FMP financial data warehouse. Not investment advice.

