
Earnings Surprise Drift in Canada: The Signal Is in the Misses, Not the Beats
Canada looks like a beat market until you strip the baseline. Near-consensus TSX stocks drift +1.51% vs the index, so beats add almost nothing and the real signal is the miss side (Q1 -1.79% net). Q5-Q1 spread: +1.89%.

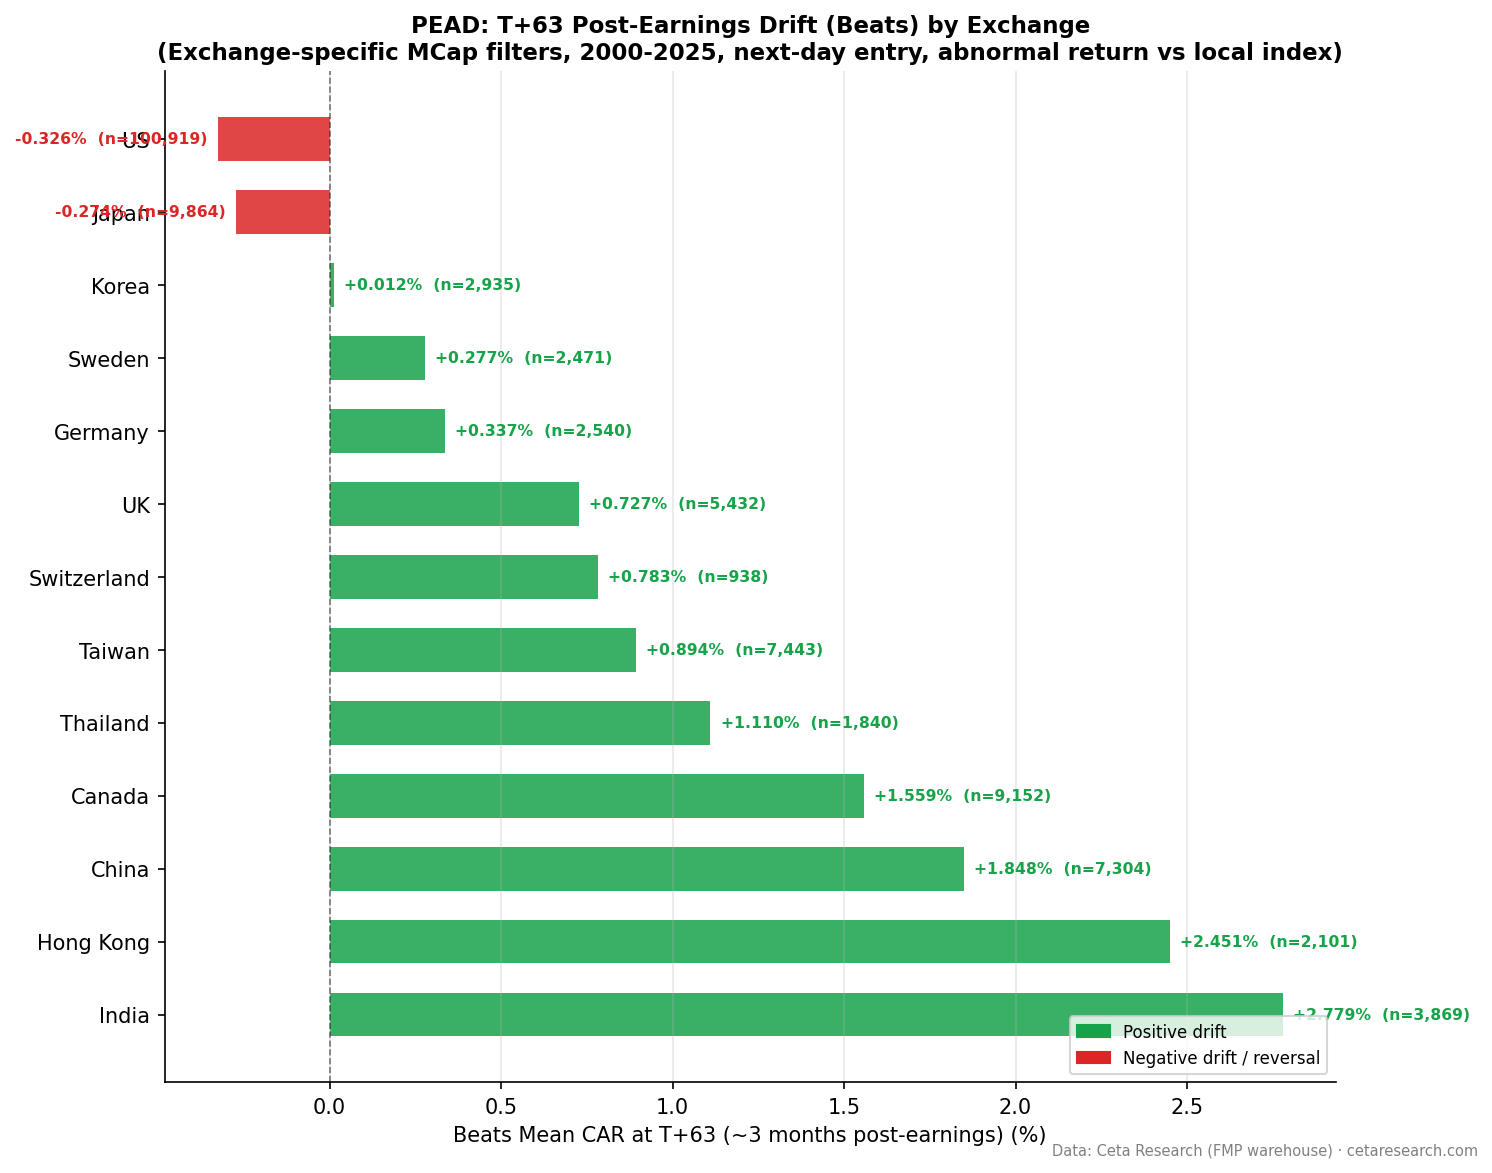
Canada's earnings drift looks like a beat-side story until you strip out the baseline. On the TSX, biggest beats produce +1.61% cumulative abnormal return at T+63 and worst misses only -0.28%, which reads as "beats work, misses don't." But near-consensus Canadian stocks already drift +1.51% against the TSX Composite over the same window. Against that baseline, the beats add almost nothing (+0.10%) and the misses give up -1.79%. Canada's real earnings signal is the miss side. The whole event universe drifts up relative to the index, which flatters beats and hides the underperformance of the misses.
Contents
- Method
- The Strategy
- What We Found
- Positive vs Negative Surprise Drift
- Quintile Analysis at T+63
- Canada's Beat Rate
- When It Works and When It Struggles
- Run It Yourself
- Limitations
- Part of a Series
- References
Data: FMP financial data warehouse, 2000–2025. Updated July 2026.
Method
| Parameter | Details |
|---|---|
| Data source | FMP earnings_surprises + stock_eod (Ceta Research warehouse) |
| Universe | TSX, market cap threshold applied per exchange |
| Period | 2000–2025 (26 years) |
| Events | 18,076 total (deduplicated per symbol/date) |
| Benchmark | TSX Composite (^GSPTSE, local currency) |
| Execution | Enter at the next day's close (T+1), skipping the announcement day |
| Data quality | Oscillation rows removed, entry price > $1, single-window return capped at 200% |
| Surprise metric | (epsActual − epsEstimated) / ABS(epsEstimated) |
| Windows | T+1, T+5, T+21, T+63 trading days, measured from entry |
The Strategy
Post-Earnings Announcement Drift (PEAD) says stocks keep moving in the direction of their earnings surprise for weeks after the announcement. Ball and Brown (1968) documented it, Bernard and Thomas (1989) showed it persists for up to 60 trading days.
We ran the event study on the TSX with a next-day entry, so the untradeable announcement-day jump is excluded, and against the local TSX Composite. Canada turns out to be a useful case study in why the benchmark baseline matters.
What We Found
Positive vs Negative Surprise Drift
| Direction | Events | T+1 | T+5 | T+21 | T+63 |
|---|---|---|---|---|---|
| Positive surprises | 9,152 | +0.19% | +0.28% | +0.66% | +1.56% |
| Negative surprises | 8,924 | -0.16% | -0.32% | -0.08% | +0.28% |
At first glance this looks bilateral tilting long: beats drift +1.56% and misses end roughly flat (+0.28%) at T+63. That reading is a trap, and the quintile table shows why.
Quintile Analysis at T+63
| Quintile | Description | Events | CAR at T+63 | t-stat |
|---|---|---|---|---|
| Q5 | Biggest beats | 3,545 | +1.61% | +5.5 |
| Q4 | Moderate beats | 3,644 | +1.57% | +6.9 |
| Q3 | Near-consensus | 3,646 | +1.51% | +7.4 |
| Q2 | Moderate misses | 3,654 | +0.28% | +1.3 |
| Q1 | Worst misses | 3,587 | -0.28% | -0.9 |
Look at Q3. Companies that merely met expectations drifted +1.51% against the TSX Composite. That's not an earnings signal, it's a universe effect: the market-cap-filtered event universe outperformed the cap-weighted index over the sample, so the average event drifts up regardless of the surprise. Q5 (+1.61%) barely clears that baseline. The beat-specific drift, Q5 minus Q3, is only +0.10%.
The miss side is where the information is. Q1 lands at -0.28%, which looks harmless until you measure it against the +1.51% baseline: the worst misses underperform comparable non-surprising stocks by -1.79%. The Q5-Q1 spread of +1.89% is almost entirely a miss-side effect. Read raw, Canada looks long-only. Read against the baseline, it's a miss-side market.
Canada's Beat Rate
Canada's beat rate is 50.6%, far below the US (62.6%). Canadian analyst estimates aren't systematically conservative, so the surprise signal is more balanced in event count. But balanced event counts don't mean balanced drift. After the baseline correction, the tradeable information is concentrated on the downside.
When It Works and When It Struggles
The actionable signal in Canada is avoiding or shorting the worst misses. Q1 stocks underperform their non-surprising peers by nearly 1.8% over 63 days. In absolute terms they only drift flat, so a naive long-short that shorts Q1 outright would have fought the rising baseline. The cleaner implementation is relative: underweight Q1 within a Canadian book.
The beat side is not a real edge here. Q5 tracks Q3 almost exactly, so buying Canadian beats is close to buying the event universe, which happened to beat the index for reasons unrelated to earnings.
Canada's commodity-heavy sectors (energy, mining) add event-specific volatility. A miss from an oil producer during a commodity slump carries different information than a tech miss, and the quintile aggregate averages across all of it.
Run It Yourself
-- Recent large earnings surprises on TSX
WITH deduped AS (
  SELECT
    es.symbol,
    es.date,
    es.epsActual,
    es.epsEstimated,
    (es.epsActual - es.epsEstimated) / NULLIF(ABS(es.epsEstimated), 0) AS std_surprise,
    ROW_NUMBER() OVER (PARTITION BY es.symbol, es.date ORDER BY es.lastUpdated DESC) AS rn
  FROM earnings_surprises es
  JOIN profile p ON es.symbol = p.symbol
  WHERE p.exchange = 'TSX'
    AND p.isActivelyTrading = true
    AND CAST(es.date AS DATE) >= CURRENT_DATE - INTERVAL '90 days'
    AND ABS(es.epsEstimated) > 0.01
)
SELECT
  symbol,
  date,
  epsActual,
  epsEstimated,
  ROUND(std_surprise * 100, 1) AS surprise_pct
FROM deduped
WHERE rn = 1
  AND ABS(std_surprise) > 0.10
ORDER BY date DESC, std_surprise DESC
LIMIT 50
Run this query on Ceta Research →
Limitations
The baseline effect here is a caution for the whole series. Raw CAR includes a universe-versus-index drift, and in Canada that drift (+1.51% at Q3) is large enough to flip the apparent story. We report the Q5 minus Q3 and Q1 minus Q3 decomposition so the earnings signal isn't confused with the universe tilt. The Q5-Q1 spread is the baseline-invariant number.
18,076 events provides solid statistical power, but the resource-sector weighting means results partly reflect commodity-cycle dynamics. The market cap threshold excludes TSX Venture microcaps, so this is the main-board universe, not the full Canadian market.
Short-side implementation faces borrow cost and availability on smaller names, and the -1.79% miss-side figure is gross of those costs.
Part of a Series
- PEAD Across 13 Global Exchanges: The Drift Shrinks Everywhere
- Earnings Surprise Drift on US Stocks: Most of It Vanishes If You Wait One Day
References
- Ball, R. & Brown, P. (1968). An empirical evaluation of accounting income numbers. Journal of Accounting Research.
- Bernard, V. & Thomas, J. (1989). Post-earnings-announcement drift: Delayed price response or risk premium? Journal of Accounting Research.
- Foster, G., Olsen, C. & Shevlin, T. (1984). Earnings releases, anomalies, and the behavior of security returns. The Accounting Review.
Data: Ceta Research, FMP financial data warehouse. Not investment advice.

