Dividend Growth Screen: 7.96% CAGR With Half the Drawdown (25-Year Backtest)
We backtested a dividend growth screen (5+ consecutive years of increases with quality filters) across 25 years of US stock data. 7.96% CAGR, matching the S&P 500 with 24% better Sharpe and 50% down capture.


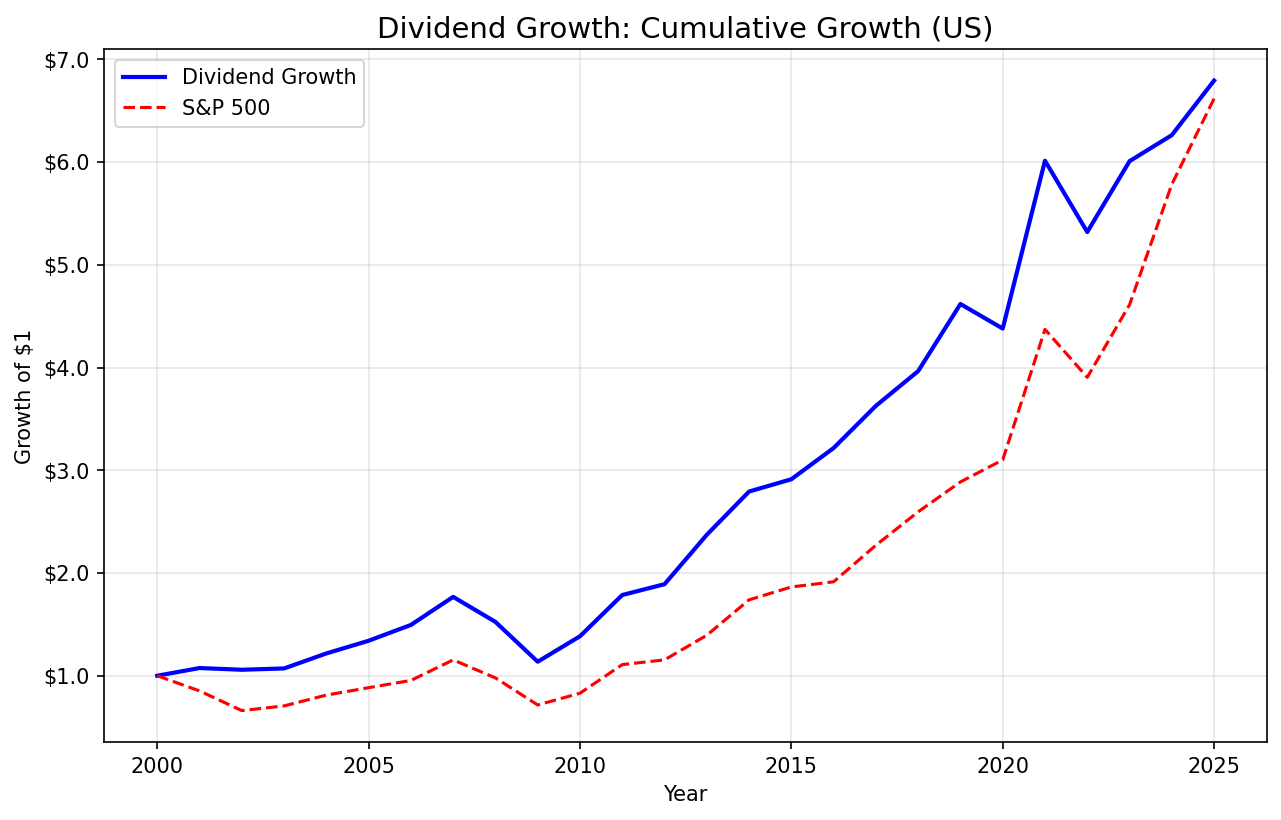
Dividend growth stocks don't beat the market by much. Over 25 years, our Aristocrats-style screen returned 7.96% CAGR vs 7.85% for the S&P 500. A 0.11% edge. But the risk-adjusted story is completely different. The strategy's Sharpe ratio is 24% higher than SPY, and it captured less than half of market declines. Same destination, smoother ride.
Contents
- Method
- Signal
- Results
- Annual Returns
- When It Works
- When It Struggles
- The Simple Screen
- Limitations
- Takeaway
- Part of a Series
- Run This Screen Yourself
- References
Data: FMP financial data warehouse, 2000–2025. Updated March 2026.
Method
Data source: Ceta Research (FMP financial data, 70K+ stocks) Universe: All US stocks (NYSE + NASDAQ + AMEX) with market cap > $1B Period: 2000-2025 (25 years) Rebalancing: Annual (July) Transaction costs: Size-tiered (0.1% large cap, 0.3% mid cap, 0.5% small cap, one-way)
Signal
| Filter | Threshold | Why |
|---|---|---|
| Consecutive dividend increases | 5+ years | Streak signals management commitment to payout |
| Payout ratio | 0% to 80% | Sustainable dividends, room to reinvest |
| Free cash flow | > 0 | Cash backing the dividend |
| Market cap | > $1B | Liquid, reliable data |
Portfolio: Top 30 stocks by longest streak (market cap tiebreaker). Equal weight. Hold cash if fewer than 10 qualify.
Ranking: Longest consecutive streak first. A company with 25 years of increases ranks above one with 15, regardless of yield or sector.
Lintner (1956) studied how corporate managers set dividend policy. He found they smooth payouts, raising dividends only when they believe the higher level is sustainable. Cutting a dividend is seen as a signal of serious trouble, so managers are conservative about increases. A 5-year streak means five consecutive years where management was confident enough in future earnings to make that commitment. A 25-year streak means they did it through the dot-com bust, the financial crisis, and a pandemic.
Arnott and Asness (2003) found a counterintuitive result: companies with higher payout ratios experienced higher subsequent earnings growth. Managers who pay out more are disciplined about capital allocation. They don't waste retained earnings on empire-building acquisitions. The payout acts as a constraint that forces efficient reinvestment.
This is different from high-yield screening (dividend-01 in this series). High yield asks "which stocks pay the most right now?" Dividend growth asks "which stocks have reliably paid more every year?" The two lists rarely overlap.
Results
| Metric | Strategy | S&P 500 |
|---|---|---|
| CAGR | 7.96% | 7.85% |
| Total Return | 579% | 562% |
| Max Drawdown | -35.71% | -38.01% |
| Sharpe Ratio | 0.437 | 0.352 |
| Sortino Ratio | 0.844 | 0.628 |
| Calmar Ratio | 0.223 | 0.207 |
| Volatility | 13.65% | 16.63% |
| Win Rate (vs SPY) | 44% | -- |
| Up Capture | 83.25% | -- |
| Down Capture | 49.78% | -- |
| Beta | 0.689 | -- |
| Alpha (Jensen's) | 1.93% | -- |
| VaR 95% | -13.78% | -- |
| Cash Periods | 0/25 | -- |
| Avg Stocks | 30.0 | -- |
The headline CAGR barely beats SPY. But look at how it gets there. Volatility is 13.65% vs 16.63%. That's 18% less risk. Down capture is 49.78%, meaning the portfolio absorbed about half of SPY's losses during down periods. Up capture of 83.25% means it still participated in most of the upside. Jensen's alpha of 1.93% confirms the strategy adds value after adjusting for market risk.
Zero cash periods across 25 years. The US market always had at least 10 qualifying dividend growers. The signal is well-calibrated for this market.
Annual Returns
| Year | Strategy | S&P 500 | Excess |
|---|---|---|---|
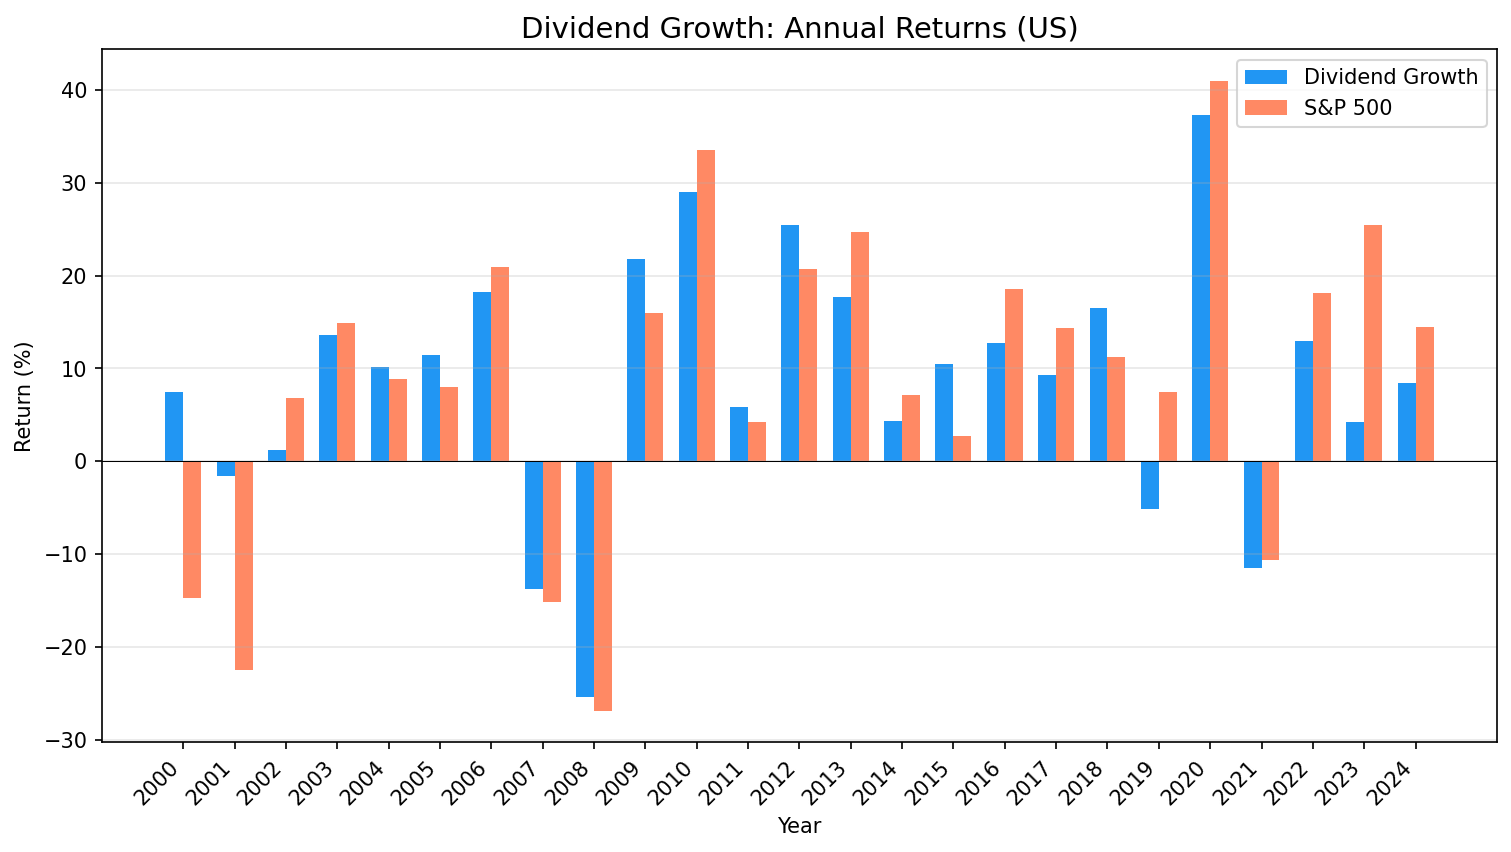
| 2000 | +7.5% | -14.8% | +22.3% |
| 2001 | -1.6% | -22.4% | +20.9% |
| 2002 | +1.2% | +6.9% | -5.7% |
| 2003 | +13.6% | +14.9% | -1.3% |
| 2004 | +10.1% | +8.9% | +1.3% |
| 2005 | +11.5% | +8.0% | +3.5% |
| 2006 | +18.3% | +20.9% | -2.7% |
| 2007 | -13.8% | -15.2% | +1.4% |
| 2008 | -25.4% | -26.9% | +1.5% |
| 2009 | +21.8% | +16.0% | +5.8% |
| 2010 | +29.0% | +33.5% | -4.5% |
| 2011 | +5.9% | +4.2% | +1.7% |
| 2012 | +25.4% | +20.7% | +4.7% |
| 2013 | +17.7% | +24.7% | -7.0% |
| 2014 | +4.3% | +7.2% | -2.9% |
| 2015 | +10.4% | +2.7% | +7.7% |
| 2016 | +12.8% | +18.6% | -5.8% |
| 2017 | +9.3% | +14.3% | -5.0% |
| 2018 | +16.5% | +11.2% | +5.3% |
| 2019 | -5.2% | +7.4% | -12.6% |
| 2020 | +37.3% | +41.0% | -3.7% |
| 2021 | -11.5% | -10.7% | -0.9% |
| 2022 | +13.0% | +18.1% | -5.1% |
| 2023 | +4.2% | +25.4% | -21.2% |
| 2024 | +8.5% | +14.4% | -5.9% |
When It Works
2000-2001 (dot-com bust): The strategy's best stretch. +22.3% and +20.9% excess returns in consecutive years. While SPY dropped -14.8% and -22.4%, the portfolio returned +7.5% and -1.6%. Dividend growers are the anti-speculative-growth play. Companies with 5+ year dividend streaks are profitable, cash-generative, and boring. Exactly what you want when the bubble pops.
2007-2009 (financial crisis): The portfolio fell -25.4% in 2008 vs SPY's -26.9%, then bounced +21.8% in 2009 vs SPY's +16.0%. The quality filters kept the worst financial stocks out. Through the full cycle, the strategy came out ahead.
2015 and 2018 (late-cycle): +7.5% and +5.1% excess returns. In choppy, uncertain markets, dividend growers hold up. Stable cash flows and consistent payout policies act as a floor.
Pattern: the strategy works best during stress and uncertainty. When investors flee speculative names, they rotate into exactly the kind of companies this screen selects.
When It Struggles
2023 (AI rally): The worst single year at -21.2% excess. SPY returned +25.4%, driven by a handful of mega-cap tech stocks riding the AI wave. The strategy returned +4.2%. Dividend growers are structurally underweight tech because most tech companies haven't been paying dividends long enough to build a streak.
2019 (growth dominance): -12.6% excess. The portfolio lost -5.2% while SPY gained +7.4%. Growth and momentum dominated, and the strategy's defensive tilt was a drag.
2013-2014 and 2016-2017 (momentum runs): Four years of steady underperformance, trailing SPY by 3-7% each year. The strategy still made money in all four years. But watching SPY pull ahead tests patience.
Pattern: the strategy lags during sustained growth rallies when the market rewards momentum over stability. The 44% win rate confirms this. You're right less than half the time on a yearly basis, but the wins during downturns are large enough to keep cumulative returns competitive.
The Simple Screen
Find stocks with 5+ consecutive years of dividend increases, passing quality filters.
WITH annual_div AS (
    SELECT symbol,
        EXTRACT(YEAR FROM CAST(date AS DATE)) AS yr,
        SUM(adjDividend) AS total_div
    FROM dividend_calendar
    WHERE adjDividend > 0
        AND EXTRACT(YEAR FROM CAST(date AS DATE)) < EXTRACT(YEAR FROM CURRENT_DATE)
        AND symbol IN (SELECT DISTINCT symbol FROM profile WHERE exchange IN ('NYSE', 'NASDAQ', 'AMEX'))
    GROUP BY symbol, EXTRACT(YEAR FROM CAST(date AS DATE))
),
growth AS (
    SELECT symbol, yr, total_div,
        LAG(total_div) OVER (PARTITION BY symbol ORDER BY yr) AS prev_div
    FROM annual_div
),
last_break AS (
    SELECT symbol, MAX(yr) AS break_yr
    FROM growth
    WHERE prev_div IS NOT NULL AND total_div <= prev_div
    GROUP BY symbol
),
streak AS (
    SELECT g.symbol, COUNT(*) AS consecutive_years,
        MIN(g.yr) AS streak_from,
        MAX(g.yr) AS streak_to
    FROM growth g
    LEFT JOIN last_break lb ON g.symbol = lb.symbol
    WHERE g.prev_div IS NOT NULL
      AND g.total_div > g.prev_div
      AND (lb.break_yr IS NULL OR g.yr > lb.break_yr)
    GROUP BY g.symbol
    HAVING COUNT(*) >= 5
),
latest_cf AS (
    SELECT symbol, freeCashFlow,
        ROW_NUMBER() OVER (PARTITION BY symbol ORDER BY date DESC) AS rn
    FROM cash_flow_statement
    WHERE period = 'FY'
)
SELECT s.symbol,
    s.consecutive_years,
    s.streak_from,
    s.streak_to,
    ROUND(r.dividendPayoutRatioTTM * 100, 1) AS payout_pct,
    ROUND(k.marketCap / 1e9, 2) AS mktcap_bn,
    ROUND(cf.freeCashFlow / 1e6, 0) AS fcf_mm
FROM streak s
JOIN financial_ratios_ttm r ON s.symbol = r.symbol
JOIN key_metrics_ttm k ON s.symbol = k.symbol
JOIN latest_cf cf ON s.symbol = cf.symbol AND cf.rn = 1
WHERE r.dividendPayoutRatioTTM BETWEEN 0 AND 0.80
  AND cf.freeCashFlow > 0
  AND k.marketCap > 1000000000
QUALIFY ROW_NUMBER() OVER (PARTITION BY s.symbol ORDER BY s.consecutive_years DESC) = 1
ORDER BY s.consecutive_years DESC, k.marketCap DESC
LIMIT 30
What this does: - The annual_div CTE sums all adjusted dividends per stock per year. This handles quarterly, monthly, and irregular payment schedules. - The growth CTE uses LAG() to compare each year's total against the prior year. - The last_break CTE finds the most recent year where dividends didn't increase. Everything after that year counts toward the current streak. - consecutive_years >= 5 requires at least five straight years of increases. The backtest uses the same threshold. - dividendPayoutRatioTTM BETWEEN 0 AND 0.80 ensures the dividend is sustainable. A 95% payout ratio is a warning sign. - freeCashFlow > 0 confirms the dividend is backed by actual cash generation. - marketCap > 1B filters for liquid names with reliable data. - Results are ranked by longest streak first, with market cap as tiebreaker.
Limitations
Sector concentration. Dividend growers cluster in consumer staples, industrials, and utilities. These sectors have the earnings stability to sustain long streaks. Technology companies rarely qualify because the sector is too young and too volatile for multi-decade streaks. This creates a structural underweight to tech.
The streak is backward-looking. A 25-year streak tells you what happened, not what will happen. AT&T, GE, and dozens of former Aristocrats have cut their dividends after long runs. The streak is a strong signal, but it's not a guarantee.
Dividend cuts not modeled. The backtest rebalances annually. If a company cuts its dividend mid-year, we don't exit until the next rebalance. In practice, you might want to monitor for cuts and exit early.
Survivorship bias. FMP data includes many delisted companies, but coverage of delistings is less complete than active companies. Some failed dividend growers may be missing from the dataset.
Point-in-time data. We use a 45-day filing lag assumption for annual data. The July rebalance date aligns with most companies having filed their annual reports, but exact availability varies.
Takeaway
Dividend growth investing isn't about beating the market on raw returns. The 25-year record shows that clearly: 7.96% vs 7.85%. A coin flip.
The value is in how you get there. A 0.689 beta means the portfolio moves roughly 69% as much as the market. Down capture of 49.78% means it absorbs about half the pain during drawdowns. Volatility runs 18% lower. The Sharpe ratio is 24% higher. You're getting nearly identical returns with 18% lower volatility and half the drawdown exposure.
The tradeoff is prolonged stretches of underperformance during growth-driven markets. The 2023 AI rally cost -21.2% in a single year. The 2016-2017 momentum run lagged by 5-6% annually. The 44% win rate means you'll trail SPY more often than you'll lead. You need conviction to hold through those stretches.
If you can tolerate the tracking error, this is one of the most defensive equity strategies available. It won't make you rich. It will help you stay rich.
A note on data sources: The screen above uses TTM (trailing twelve months) tables, which reflect current snapshots. The backtest numbers use historical tables (dividend_calendar, financial_ratios, key_metrics, cash_flow_statement) with point-in-time methodology, only using data available at the time of each simulated trade. These are different data sources: TTM for live screening, historical for backtesting.
Data: Ceta Research (FMP financial data warehouse). Universe: NYSE + NASDAQ + AMEX, market cap > $1B. Backtest: 2000-2025, annual July rebalance, equal weight top 30 by streak length. Transaction costs: size-tiered (0.1-0.5% one-way). Quality filters: 5+ consecutive dividend increases, payout 0-80%, FCF > 0. Past performance does not guarantee future results. This is educational content, not investment advice.
Part of a Series
This is the US analysis. We also ran the same screen on global exchanges: - Dividend Growth on Indian Stocks (NSE) - Dividend Growth on Canadian Stocks (TSX) - Dividend Growth on UK Stocks (LSE) - Dividend Growth on German Stocks (XETRA) - Dividend Growth on Swiss Stocks (SIX) - Dividend Growth Across Global Exchanges - full comparison
Run This Screen Yourself
Via web UI: Run the Dividend Growth screen on Ceta Research. The query is pre-loaded. Click "Run" and see what passes today.
Via Python:
import requests, os

API_KEY = os.environ["CR_API_KEY"]
BASE = "https://api.cetaresearch.com/api/v1"

query = """
WITH annual_div AS (
    SELECT symbol,
        EXTRACT(YEAR FROM CAST(date AS DATE)) AS yr,
        SUM(adjDividend) AS total_div
    FROM dividend_calendar
    WHERE adjDividend > 0
        AND EXTRACT(YEAR FROM CAST(date AS DATE)) < EXTRACT(YEAR FROM CURRENT_DATE)
        AND symbol IN (SELECT DISTINCT symbol FROM profile WHERE exchange IN ('NYSE', 'NASDAQ', 'AMEX'))
    GROUP BY symbol, EXTRACT(YEAR FROM CAST(date AS DATE))
),
growth AS (
    SELECT symbol, yr, total_div,
        LAG(total_div) OVER (PARTITION BY symbol ORDER BY yr) AS prev_div
    FROM annual_div
),
last_break AS (
    SELECT symbol, MAX(yr) AS break_yr
    FROM growth
    WHERE prev_div IS NOT NULL AND total_div <= prev_div
    GROUP BY symbol
),
streak AS (
    SELECT g.symbol, COUNT(*) AS consecutive_years,
        MIN(g.yr) AS streak_from,
        MAX(g.yr) AS streak_to
    FROM growth g
    LEFT JOIN last_break lb ON g.symbol = lb.symbol
    WHERE g.prev_div IS NOT NULL
      AND g.total_div > g.prev_div
      AND (lb.break_yr IS NULL OR g.yr > lb.break_yr)
    GROUP BY g.symbol
    HAVING COUNT(*) >= 5
),
latest_cf AS (
    SELECT symbol, freeCashFlow,
        ROW_NUMBER() OVER (PARTITION BY symbol ORDER BY date DESC) AS rn
    FROM cash_flow_statement
    WHERE period = 'FY'
)
SELECT s.symbol,
    s.consecutive_years,
    s.streak_from,
    s.streak_to,
    ROUND(r.dividendPayoutRatioTTM * 100, 1) AS payout_pct,
    ROUND(k.marketCap / 1e9, 2) AS mktcap_bn,
    ROUND(cf.freeCashFlow / 1e6, 0) AS fcf_mm
FROM streak s
JOIN financial_ratios_ttm r ON s.symbol = r.symbol
JOIN key_metrics_ttm k ON s.symbol = k.symbol
JOIN latest_cf cf ON s.symbol = cf.symbol AND cf.rn = 1
WHERE r.dividendPayoutRatioTTM BETWEEN 0 AND 0.80
  AND cf.freeCashFlow > 0
  AND k.marketCap > 1000000000
QUALIFY ROW_NUMBER() OVER (PARTITION BY s.symbol ORDER BY s.consecutive_years DESC) = 1
ORDER BY s.consecutive_years DESC, k.marketCap DESC
LIMIT 30
"""

resp = requests.post(f"{BASE}/data-explorer/execute",
    headers={"X-API-Key": API_KEY, "Content-Type": "application/json"},
    json={"query": query, "options": {"format": "json", "timeout": 600}})
task_id = resp.json()["taskId"]

import time
while True:
    status = requests.get(f"{BASE}/tasks/data-query/{task_id}",
        headers={"X-API-Key": API_KEY}).json()
    if status["status"] in ("completed", "failed"):
        break
    time.sleep(2)

results = requests.get(f"{BASE}{status['resultUrl']}",
    headers={"X-API-Key": API_KEY}).json()
for r in results[:10]:
    print(f"{r['symbol']:8s} Streak={r['consecutive_years']}yr  Payout={r['payout_pct']:.1f}%  MktCap=${r['mktcap_bn']:.1f}B")
Get your API key at cetaresearch.com.
The full backtest code (Python + DuckDB) is available in our GitHub repository.
References
- Lintner, J. (1956). "Distribution of Incomes of Corporations Among Dividends, Retained Earnings, and Taxes." American Economic Review, 46(2), 97-113.
- Arnott, R. & Asness, C. (2003). "Surprise! Higher Dividends = Higher Earnings Growth." Financial Analysts Journal, 59(1), 70-87.
- Siegel, J. (2005). The Future for Investors: Why the Tried and the True Triumph Over the Bold and the New. Crown Business.
- Fama, E. & French, K. (1998). "Value versus Growth: The International Evidence." Journal of Finance, 53(6), 1975-1999.