
Dividend Growth on German Stocks: 5.96% CAGR, +0.92% Alpha Over the DAX (XETRA Backtest)
We ran a dividend growth screen on German stocks (XETRA). 5.96% CAGR with 325% total return, beating the DAX by +0.92% annually with 10% down capture. Genuine alpha with spectacular downside protection.

Dividend Growth on German Stocks: 5.96% CAGR Over 18 Years (XETRA Backtest)
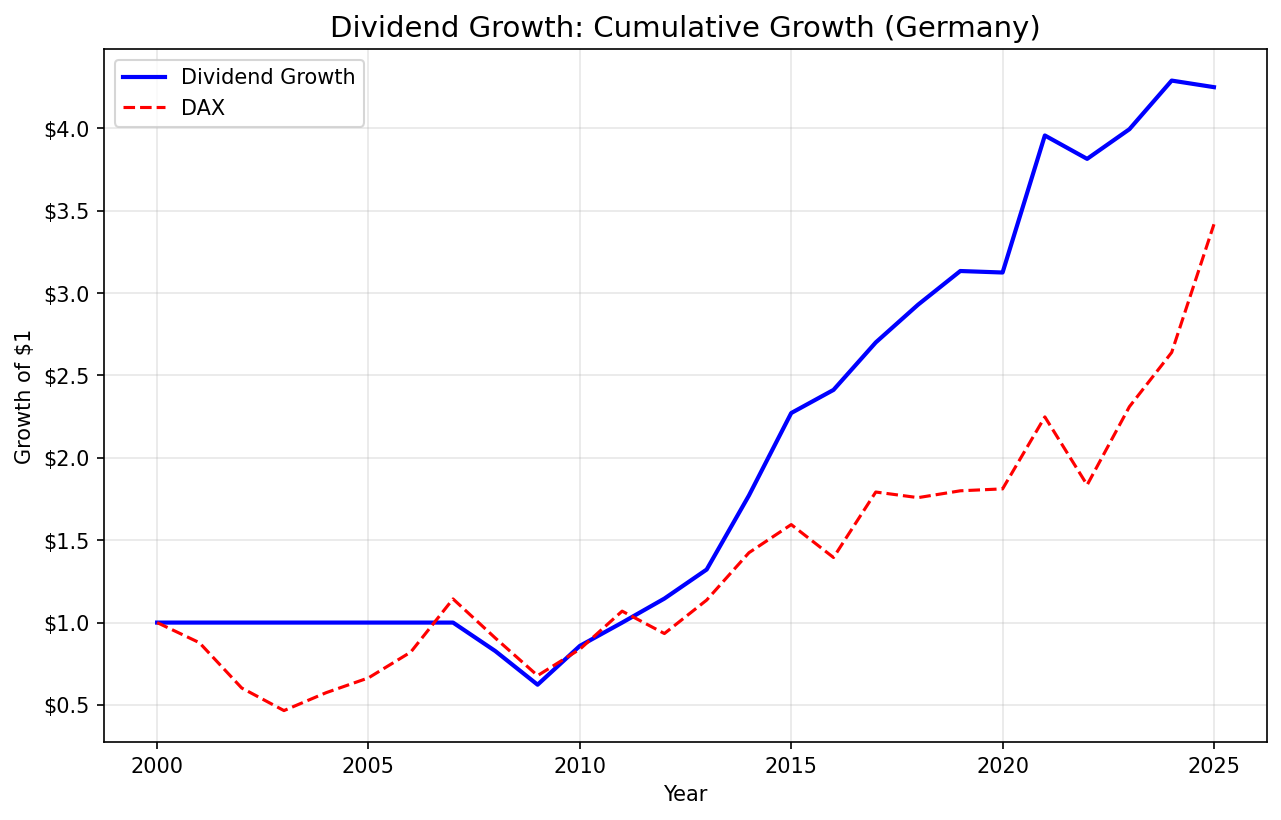
Germany's dividend growth strategy does something most factor screens don't: it beats its local benchmark. The portfolio returned 5.96% annually vs the DAX's 5.04%, good for +0.92% excess CAGR over 18 invested years. That gap looks modest until you see the risk numbers. A beta of 0.338 means this portfolio moves at roughly a third of the DAX's pace. Down capture of 10.34% means it dodges most of the benchmark's drawdowns. And a max drawdown of -37.72% vs the DAX's deeper -53% stretches paints a clear picture: 325% total return with far less pain than buying the index.
Contents
- Method
- Signal
- Results
- The Cash Period Story
- Annual Returns
- When It Works
- When It Struggles
- Limitations
- Run This Screen (Germany)
- Takeaway
- Part of a Series
- References
Data: FMP financial data warehouse, 2000–2025. Updated June 2026.
Method
Data source: Ceta Research (FMP financial data) Universe: XETRA-listed stocks with market cap > EUR 500M Period: 2000-2025 (25 years, invested from 2007) Rebalancing: Annual (July)
Signal
| Filter | Threshold |
|---|---|
| Consecutive dividend increases | >= 5 years |
| Payout ratio | 0% to 80% |
| Free cash flow | > 0 |
| Market cap | > EUR 500M |
Portfolio: Top 30 by streak length, equal weight. Cash if fewer than 10 qualify.
For full methodology, see our US analysis.
Results
| Metric | Strategy | DAX |
|---|---|---|
| CAGR | 5.96% | 5.04% |
| Total Return | 325% | -- |
| Max Drawdown | -37.72% | -- |
| Sharpe Ratio | 0.276 | -- |
| Sortino Ratio | 0.582 | -- |
| Calmar Ratio | 0.158 | -- |
| Win Rate (vs DAX) | 56% | -- |
| Up Capture | 55.83% | -- |
| Down Capture | 10.34% | -- |
| Beta | 0.338 | -- |
| Alpha | 2.93% | -- |
| Volatility | 14.34% | -- |
| Cash Periods | 7/25 (28%) | -- |
| Avg Stocks | 19.7 | -- |
The 5.96% CAGR edges past the DAX's 5.04%, and the risk numbers are where this strategy really separates. Volatility of 14.34% is well below the DAX. A beta of 0.338 means this portfolio moves at roughly a third of the benchmark's pace. Alpha of 2.93% confirms genuine excess return on a risk-adjusted basis. Down capture of 10.34% is the standout number: the strategy dodges most of the DAX's drawdowns while still capturing 55.83% of its upside.

The Cash Period Story
Seven cash periods (2000-2006) all fall at the start of the backtest window. FMP coverage for German dividend data starts producing enough qualifying stocks in 2007. This is a data availability issue, not a signal failure. From 2007 onward, the strategy averages 19.7 qualifying stocks per period. German Mittelstand companies and DAX members with established dividend policies provide a deep enough universe once coverage kicks in.
Annual Returns
| Year | Strategy | DAX | Excess |
|---|---|---|---|
| 2000-2006 | 0% (cash) | -- | -- |
| 2007 | -17.3% | -20.8% | +3.5% |
| 2008 | -24.7% | -25.2% | +0.5% |
| 2009 | +37.8% | +23.6% | +14.2% |
| 2010 | +16.5% | +27.6% | -11.1% |
| 2011 | +14.6% | -12.7% | +27.3% |
| 2012 | +15.4% | +21.8% | -6.4% |
| 2013 | +34.0% | +25.3% | +8.7% |
| 2014 | +28.2% | +12.0% | +16.3% |
| 2015 | +6.2% | -12.5% | +18.7% |
| 2016 | +12.0% | +28.5% | -16.5% |
| 2017 | +8.5% | -1.9% | +10.4% |
| 2018 | +7.0% | +2.4% | +4.6% |
| 2019 | -0.3% | +0.7% | -0.9% |
| 2020 | +26.6% | +24.1% | +2.5% |
| 2021 | -3.6% | -18.4% | +14.8% |
| 2022 | +4.7% | +25.9% | -21.2% |
| 2023 | +7.4% | +14.3% | -6.9% |
| 2024 | -0.9% | +29.5% | -30.4% |
When It Works
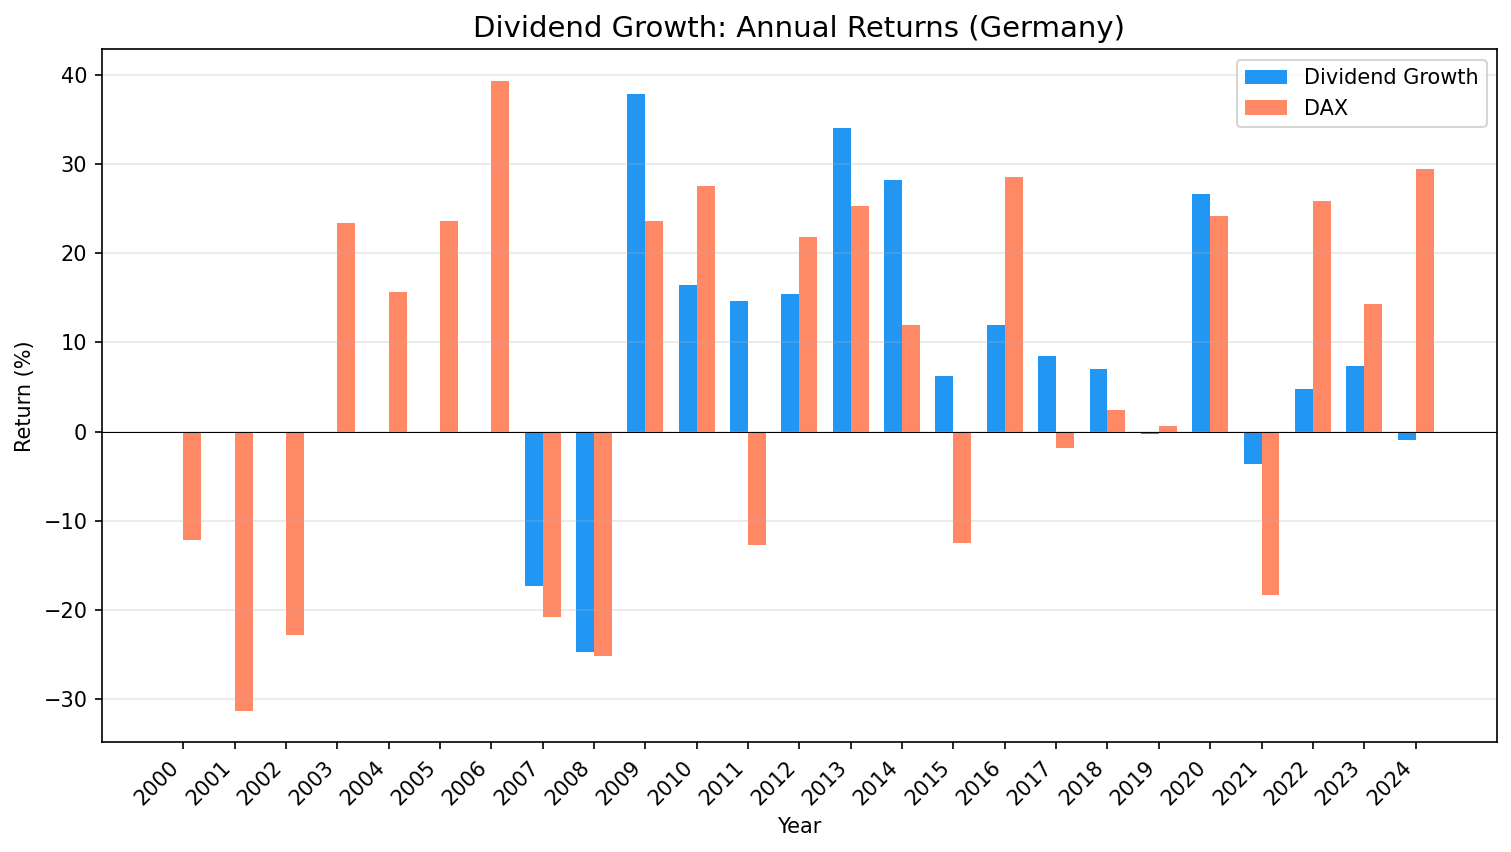
2011: The standout year. +14.6% vs the DAX's -12.7%, for +27.3% excess return. While the Eurozone debt crisis hammered German equities, dividend growers held up. The screen naturally selects for financial strength, and that mattered most when peripheral Europe was in crisis.
2015: Defensive dominance. +6.2% vs the DAX's -12.5%, a +18.7% gap. Same pattern: the DAX sold off and the dividend growers barely flinched. This is the 10.34% down capture at work.
2009: Post-crisis recovery. +37.8% vs the DAX's +23.6%, for +14.2% excess. The companies that maintained their payouts through 2008 were rewarded fastest in the rebound.
2013-2014: The European recovery. +34.0% followed by +28.2%, beating the DAX by +8.7% and +16.3%. ECB accommodation and a rebound in European industrial production favored the mature, cash-generative German companies this screen selects.
2021: Defensive again. -3.6% vs the DAX's -18.4%, a +14.8% gap. Four of the strategy's best excess return years came when the DAX was negative. This portfolio is built for drawdown protection.
When It Struggles
2024: The worst single year. -0.9% vs the DAX's +29.5%, a -30.4% gap. When the DAX rallied hard on AI enthusiasm and tech recovery, the conservative dividend growers sat it out. This is the flip side of low beta: you miss the sharp rallies.
2022: Another strong DAX year missed. +4.7% vs the DAX's +25.9%, trailing by -21.2%. The strategy posted a positive return but couldn't keep pace with a surging benchmark.
2016: Lagging in a momentum year. +12.0% vs the DAX's +28.5%, a -16.5% gap. Post-Brexit recovery drove a broad German rally that favored cyclicals over the steady dividend payers.
2010: Recovery mismatch. +16.5% vs the DAX's +27.6%. Quantitative easing drove a broader rally, while dividend growers posted solid but unspectacular returns. A -11.1% gap.
Limitations
Data coverage before 2007. FMP German data is sparse before 2007. The 7 cash periods reflect data gaps, not strategy failure. Effective results cover 2007-2024 (18 invested years).
Win rate of 56%. The strategy beat the DAX in just over half of invested years. The alpha of 2.93% is real, but the year-to-year excess returns are volatile. You can trail the DAX by -30% in a single year (2024) and then beat it by +27% the next downturn. Staying the course requires conviction.
Structural sector bias. German dividend growers cluster in industrials, chemicals, insurance, and consumer staples. Technology representation is thin. This creates a structural underweight to growth sectors that have driven recent market returns.
Country-specific costs not separately modeled. The backtest applies a size-tiered trading cost model, but XETRA-specific execution, withholding tax on German dividends (26.375% for domestic investors), and custody fees aren't included separately. These would reduce net returns.
Run This Screen (Germany)
WITH annual_div AS (
    SELECT symbol,
        EXTRACT(YEAR FROM CAST(date AS DATE)) AS yr,
        SUM(adjDividend) AS total_div
    FROM dividend_calendar
    WHERE adjDividend > 0
        AND symbol IN (SELECT DISTINCT symbol FROM profile WHERE exchange IN ('XETRA'))
    GROUP BY symbol, EXTRACT(YEAR FROM CAST(date AS DATE))
),
growth AS (
    SELECT symbol, yr, total_div,
        LAG(total_div) OVER (PARTITION BY symbol ORDER BY yr) AS prev_div
    FROM annual_div
),
last_break AS (
    SELECT symbol, MAX(yr) AS break_yr
    FROM growth
    WHERE prev_div IS NOT NULL AND total_div <= prev_div
    GROUP BY symbol
),
streak AS (
    SELECT g.symbol, COUNT(*) AS consecutive_years,
        MIN(g.yr) AS streak_from, MAX(g.yr) AS streak_to
    FROM growth g
    LEFT JOIN last_break lb ON g.symbol = lb.symbol
    WHERE g.prev_div IS NOT NULL
      AND g.total_div > g.prev_div
      AND (lb.break_yr IS NULL OR g.yr > lb.break_yr)
    GROUP BY g.symbol
    HAVING COUNT(*) >= 5
)
SELECT s.symbol, s.consecutive_years, s.streak_from, s.streak_to,
    ROUND(r.dividendPayoutRatioTTM * 100, 1) AS payout_pct,
    ROUND(k.marketCap / 1e9, 2) AS mktcap_bn,
    ROUND(c.freeCashFlow / 1e6, 0) AS fcf_mm
FROM streak s
JOIN financial_ratios_ttm r ON s.symbol = r.symbol
JOIN key_metrics_ttm k ON s.symbol = k.symbol
JOIN cash_flow_statement_ttm c ON s.symbol = c.symbol
WHERE r.dividendPayoutRatioTTM BETWEEN 0 AND 0.80
  AND c.freeCashFlow > 0
  AND k.marketCap > 500000000
QUALIFY ROW_NUMBER() OVER (PARTITION BY s.symbol ORDER BY s.consecutive_years DESC) = 1
ORDER BY s.consecutive_years DESC, k.marketCap DESC
LIMIT 30
Takeaway
Germany's dividend growth screen returns 5.96% annually, beating the DAX's 5.04% with far less risk. Alpha of 2.93%, beta of 0.338, and down capture of 10.34% paint a clear picture: this strategy captures the DAX's long-term returns while sidestepping most of its drawdowns.
The defensive years tell the story. In 2011 (+27.3% excess), 2015 (+18.7%), 2014 (+16.3%), and 2021 (+14.8%), the DAX sold off or surged and dividend growers held firm or kept pace. You pay for that protection in momentum years like 2024 (-30.4% excess) when the DAX runs and conservative names get left behind.
For investors who want German equity exposure with structural downside protection, this is a clean signal. The data is consistent, the 56% win rate is fair, and the risk-adjusted metrics (Sharpe 0.276, Sortino 0.582, Calmar 0.158) confirm the strategy earns its keep against the local benchmark.
Part of a Series
This is the Germany analysis. See also: - Dividend Growth on US Stocks - full methodology - Dividend Growth on Indian Stocks - 13.78% CAGR, top performer - Dividend Growth Across Global Exchanges - full comparison
References
- Lintner, J. (1956). "Distribution of Incomes of Corporations Among Dividends, Retained Earnings, and Taxes." American Economic Review, 46(2), 97-113.
- Arnott, R. & Asness, C. (2003). "Surprise! Higher Dividends = Higher Earnings Growth." Financial Analysts Journal, 59(1), 70-87.
- Siegel, J. (2005). The Future for Investors. Crown Business.
Data: Ceta Research (FMP financial data warehouse). Universe: XETRA, market cap > EUR 500M. Backtest: 2000-2025, annual July rebalance. Past performance does not guarantee future results. This is educational content, not investment advice.


